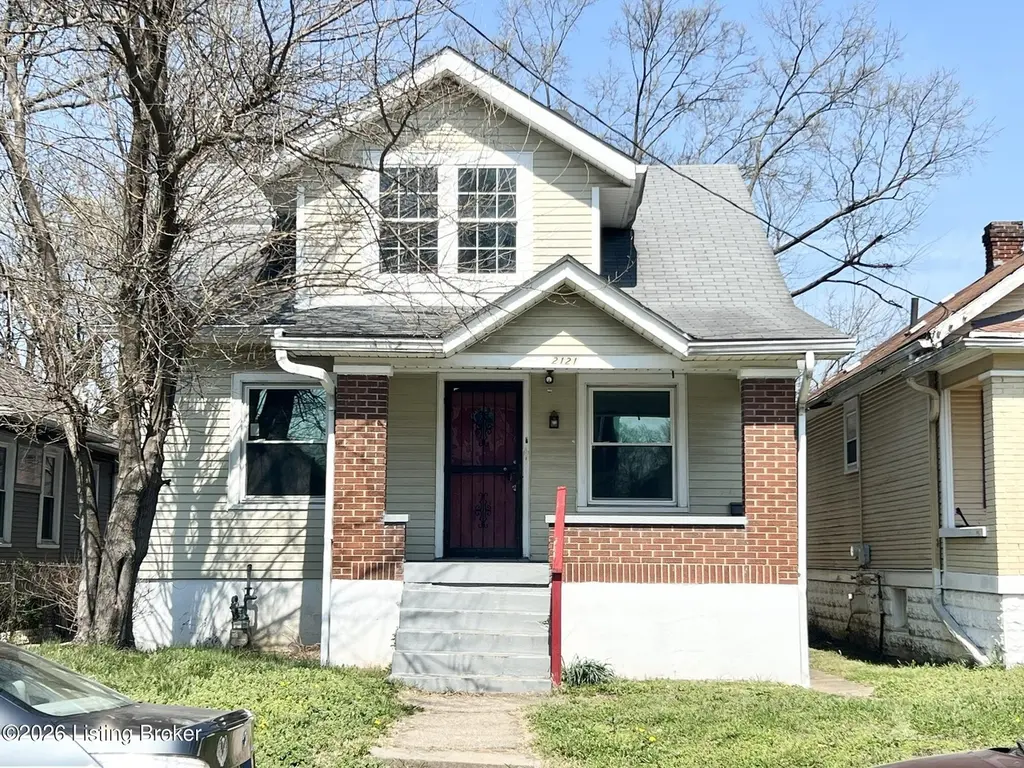
2121 W Lee St · Louisville, KY
Flood risk 1/10 · Minimal
- FEMA flood zone
- X (unshaded)
- Chance of flooding over 30 yrs
- 0.0%
- Est. flood insurance / yr
- $473 – $860
Fire risk 1/10 · Minimal
- Est. fire insurance / yr
- $839 – $1,559
Heat risk 5/10 · Moderate
- Hot days now (above 104°F)
- 7 days/yr
- Hot days in 30 yrs
- 20 days/yr
Wind risk 2/10 · Minimal
- Chance of severe wind over 30 yrs
- 1.0%
Air-quality risk 2/10 · Minimal
- Unhealthy air days now
- 1 days/yr
- Unhealthy air days in 30 yrs
- 3 days/yr
Risk factors via First Street. Map © Google.
Why this score? — see what drove the C- grade
The composite is a weighted blend of 9 inputs, each scored 0–100. Each bar is that input's sub-score; the figure is the points it added to the 100-point composite (weight × sub-score).
- Cash flow +21.1/30.0
- Appreciation +10.0/10.0
- DSCR +6.7/10.0
- 1% rule +4.6/10.0
- Rent growth +4.5/5.0
- Livability +3.2/5.0
- Condition / age +2.5/5.0
- Schools +2.3/10.0
- ARV discount +0.0/15.0
$139,000
🖨 Deal sheet (PDF) 📄 Offer letter ✓ Due diligence
Listing remarks MLS
Investor Alert! This property is a great opportunity to owner occupant or investor. Property is currently rented at $800 per month with 10.49% Cap Rate, This property is sold at present condition. Buyer is advised that representations by listing agents relating to total living area are approximate and not warranted. Buyer is advised to make independent determination of total living area prior to entering into a purchase offer. Please call today to schedule a personal tour! This property can be sold as bundle with MLS #s 1579913 & 1579915
Key facts
- 4,722 sq ft lot
- Garage
- Built 1915
Property features AI
Finance
- Other: Subdivision: WASHINGTON HEIGHTS
- HOA & community: No association fee
Exterior
- Parking: Detached garage, 1 car
- Utilities: Electricity connected; Natural gas available
- Home design: Single-family residence, Cape Cod style; 2 stories; Built in 1915
- Construction: Wood frame construction; Shingle roof; Poured concrete foundation
- Exterior features: Partial chain link fencing; Lot about 0.11 acres (4,722 sq ft)
Interior
- Kitchen: Kitchen on the first floor
- Bedrooms: 4 bedrooms total; Two bedrooms on the first floor; Two bedrooms on the second floor
- Bathrooms: 1 full bathroom; No half bathrooms
- Heating & cooling: Natural gas heating; Central air conditioning; 1 HVAC unit
- Interior features: 6 total rooms; 6 closets; Unfinished basement
- Laundry & utility: No first-floor laundry
Neighborhood map
What this means for you Summary
Snapshot
- This is a 4-bed/1.0-bath single-family listed at $139k.
Deal economics
- At list price, monthly cash flow is $199 ($2k/yr) — positive.
- The deal already cash-flows at list — no discount required.
- To meet the 1% rule (rent ≥ 1% of price), the offer needs to be $134k (3.8% below list).
- Recommended offer: $134k (3.8% below list) — sets the bar for 1% rule.
- Cap rate 8.0% vs local median 5.0% in Louisville — top-decile yield for the area; either an underpriced asset or a hidden risk that comps aren't pricing in. Stress-test before assuming the spread holds.
Location & tenants
- Location reads 63/100 on livability (#333 in KY) — a middle-class / working-renter tenant base. Strengths: cost of living A+, housing A+; Watch: employment C-, health & safety D+, schools D-.
- Jefferson County (urban): math 19% / reading 35% proficiency, ranked #121 of 165 in KY (top 73%) — low school quality limits family demand, transient renter base, plan for 1-2y turnover.
- Market conditions: Rents rising fast (+8.1%/yr); 91 active listings in the ZIP; 40 comparable units currently listed for rent nearby; rentals at typical pace (median 24d on market — plan ~3-4 weeks tenant-placement turnaround); lower-income renter base — watch delinquency; 2,836 units permitted in Jefferson County in 2024 (1,558 in 5+ unit buildings).
Forward outlook
- In year one you build about $15k of equity ($961 loan paydown + $14k appreciation (10.0% local appreciation)).
- Jefferson County population projected at +13% by 2050 — modest demand growth; plan on rents tracking national, not racing it.
- At projected returns (10.0% appreciation + 8.0% rent growth), your $39k cash investment doubles in ~3 years — after that, you're playing with house money.
- By year 3, paydown + projected appreciation supports a ~$38k cash-out refi (75% LTV) — recoverable capital for the next deal without selling this one.
Negotiation context
- It's been on market 18 days — a 2% lower offer ($137k) is reasonable based on typical stale-listing flexibility.
- 8 sale attempts since 18y ago with the ask held roughly flat each time — persistent listings suggest the price (not the market) is what's stuck; bring a comps-based counter.
- Current owner paid $67k; list at $139k implies a 107% gain — meaningful room to come down on a strong offer.
Risks & watch-outs
- Watch-outs: built in 1915 — expect roof / HVAC / electrical / plumbing capex.
- Climate carrying-cost: extreme-heat days projected 7→20/yr by 2055 (HVAC capex compounding) — expect insurance premiums to compound above CPI over the hold.
Questions for the listing agent
- Built in 1915 — when were the roof, HVAC, electrical panel, plumbing, and water heater last replaced?
- Is there a deadline driving the sale (1031 exchange, divorce, estate, relocation)? That informs how much negotiation room exists.
- Schools are D-rated, which usually means shorter tenancies and higher turnover. Who's the typical renter profile here, and what's been the actual vacancy rate?
- Crime grade is F in this area — have there been break-ins, vandalism, or insurance claims at this property in the last 3 years? What carrier currently insures it and at what premium?
- What's the average days-on-market for RENTAL listings here right now (not sales)? A rising rental-DOM trend means longer vacancies and softer asking-rent achievability than the comps imply.
- What's the recent tenant-quality profile in this submarket — average credit score on applications, eviction rate, late-payment / NSF rate, and stable-employment percentage? A property-management company in the area should have these aggregated.
- How much new for-sale + rental construction is in the pipeline within 1–3 miles? Heavy new supply typically softens prices + rents 12–24 months out; constrained supply supports both.
Investment metrics
- 1% rule
- 0.96% ✗
- Cap rate
- 8.01%
- Cash-on-cash
- 6.15%
- DSCR
- 1.27
- GRM
- 8.7
CMA / ARV
- ARV (on-the-fly)
- $103,750
- Comps found
- 12
Show comp detail 12 sales within ~0.75 mi
| Address | Dist | Beds/Ba | Sqft | Sold | Price | $/sf | Match |
|---|---|---|---|---|---|---|---|
| 2136 W Gaulbert Ave | 0.05mi | 4/1.5 | 1,210 (-3%) | 6mo | $92,000 | $76 | 85 |
| 2104 W Burnett Ave | 0.24mi | 3/1.0 (-1) | 1,282 (+3%) | 6mo | $67,000 | $52 | 75 |
| 1812 Wilson Ave | 0.58mi | 3/1.5 (-1) | 1,248 (-0%) | 1mo | $135,000 | $108 | 65 |
| 1736 W Gaulbert Ave | 0.42mi | 3/1.0 (-1) | 1,326 (+6%) | 4mo | $53,600 | $40 | 62 |
| 1419 S 28th St | 0.51mi | 4/2.0 | 1,203 (-4%) | 6mo | $100,000 | $83 | 61 |
| 2008 W Burnett Ave | 0.25mi | 3/1.5 (-1) | 1,396 (+12%) | 7mo | $115,900 | $83 | 56 |
| 2629 Olive St | 0.57mi | 4/1.0 | 1,120 (-10%) | 2mo | $98,000 | $88 | 54 |
| 1624 Hemlock Ct | 0.52mi | 3/1.0 (-1) | 1,376 (+10%) | 2mo | $32,500 | $24 | 52 |
| 1415 S 28th St | 0.52mi | 3/2.0 (-1) | 1,384 (+11%) | 2mo | $190,000 | $137 | 47 |
| 1331 S 28th St | 0.64mi | 3/1.5 (-1) | 1,152 (-8%) | 6mo | $60,000 | $52 | 46 |
| 1422 S 28th St | 0.53mi | 3/1.0 (-1) | 1,081 (-14%) | 8mo | $50,000 | $46 | 42 |
| 1714 Bolling Ave | 0.50mi | 3/2.0 (-1) | 1,068 (-15%) | 4mo | $110,000 | $103 | 40 |
Match score weights: distance 35% · size 25% · config 20% · recency 20%. Top-matched comps best support the ARV.
Projected returns pro-forma
10.0% appreciation · 8.0% rent growth · sell at horizon
- IRR
- 30.6%
- Equity multiple
- 3.45×
- Total profit
- $95,422
- Equity at exit
- $125,222
- IRR
- 28.0%
- Equity multiple
- 8.41×
- Total profit
- $288,442
- Equity at exit
- $270,046
Cash invested: $38,920 (down + closing). Projections, not guarantees.
Landlord ↔ Tenant lean methodology
- Overall (STATE)
- 83 Strongly Landlord-Friendly
- State Kentucky
- 83 Strongly Landlord-Friendly · R+16
- County
- — inherits STATE
- City
- — inherits STATE
ZIP-level market 40210
- Home prices YoY
- 12.1%
- Rents YoY
- 8.1%
- Active inventory
- 91
- Price-to-rent
- 8.7×
Monthly cashflow live
- Estimated rent
- $1,337 high interval (Pro) →
- Mortgage (P&I)
- −$729
- Tax from tax record
- −$70 /mo · $844/yr
- Insurance
- −$58
- HOA
- −$0
- Vacancy / Maint / Mgmt
- −$281
- Net cashflow
- $199
Break-even live
Sensitivity live
| Price | -10% $278 | -5% $239 | +0% $199 | +5% $160 | +10% $121 |
|---|---|---|---|---|---|
| Rent | -10% $94 | -5% $146 | +0% $199 | +5% $252 | +10% $305 |
| Rate | -1.0pp $269 | -0.5pp $235 | base $199 | +0.5pp $163 | +1.0pp $127 |
UW: 25.0% down · 7.5% · 30yr · 1.5% tax · 5.0% vac · 8.0% maint · 8.0% mgmt
Financing live
Cash to close
- Down payment
- $34,750
- Closing costs
- $4,170
- Reserves months
- —
- Total cash needed
- —
Loan-product check · same deal, 3 products live
Conventional
25% down · 7.5% · 30yr
- Down + closing
- —
- Monthly P&I
- —
- Monthly cashflow
- —
- DSCR
- —
- Eligible?
- —
Personal DTI + credit; lowest rate.
DSCR
20% down · 8.5% · 30yr
- Down + closing
- —
- Monthly P&I
- —
- Monthly cashflow
- —
- DSCR
- —
- Eligible?
- —
No personal income docs; deal must DSCR.
Hard money
10% down · 12.0% · 12mo
- Down + closing
- —
- Monthly P&I
- —
- Monthly cashflow
- —
- DSCR
- —
- Eligible?
- —
Short-term bridge; refi at stabilization.
Rent comps 40 comps
| Address | Beds | Baths | Sqft | Rent | $/sqft | DOM | Units | Dist |
|---|---|---|---|---|---|---|---|---|
| 1410 Standard Village Cir Louisville, KY | 3.0 | 2.0 | 1200 | $900 | $0.75 | 24d | 1 | 0.33mi |
| 1774 Bolling Ave Louisville, KY | 3.0 | 2.0 | 1611 | $1,300 | $0.81 | 11d | 1 | 0.37mi |
| 1545 Catalpa St Louisville, KY | 4.0 | 1.5 | 1760 | $1,545 | $0.88 | 4d | 1 | 0.42mi |
| 2223 Saint Louis Ave Louisville, KY | 3.0 | 1.5 | 1152 | $1,175 | $1.02 | 24d | 1 | 0.46mi |
| 1714 W Hill St Louisville, KY | 3.0 | 1.0 | 1050 | $1,045 | $1.00 | 24d | 1 | 0.51mi |
| 1708 W Gaulbert Ave Louisville, KY | 3.0 | 1.0 | 936 | $975 | $1.04 | 24d | 1 | 0.52mi |
| 2629 Olive St Louisville, KY | 4.0 | 1.0 | 1120 | $1,500 | $1.34 | 24d | 1 | 0.57mi |
| 1339 S 28th St Unit 3 Louisville, KY | 3.0 | 1.0 | 1125 | $1,175 | $1.04 | 20d | 1 | 0.58mi |
| 1622 Beech St Louisville, KY | 4.0 | 1.0 | 1108 | $1,445 | $1.30 | 16d | 1 | 0.59mi |
| 1439 Beech St Apt 1 Louisville, KY | 3.0 | 1.5 | 1000 | $820 | $0.82 | 24d | 1 | 0.63mi |
| 2913 Dumesnil St Apt 3 Louisville, KY | 3.0 | 1.0 | 1112 | $740 | $0.67 | 11d | 1 | 0.75mi |
| 1155 S 28th St Unit 4 Louisville, KY | 4.0 | 2.0 | 1010 | $1,350 | $1.34 | 24d | 1 | 0.78mi |
| 2706 Hale Ave Unit 1 Louisville, KY | 3.0 | 1.0 | 1100 | $1,400 | $1.27 | 24d | 1 | 0.78mi |
| 2311 Plantation Dr Louisville, KY | 3.0 | 1.0 | 988 | $1,200 | $1.21 | 16d | 1 | 0.89mi |
| 1705 1/2 Hale Ave Louisville, KY | 3.0 | 2.0 | 1257 | $1,400 | $1.11 | 11d | 1 | 0.92mi |
| 3313 Penway Ave Louisville, KY | 4.0 | 2.0 | 1142 | $1,645 | $1.44 | 24d | 1 | 0.93mi |
| 1148 S 17th St Unit 2 Louisville, KY | 3.0 | 1.0 | 1000 | $895 | $0.90 | 24d | 1 | 0.94mi |
| 2708 Greenwood Ave Apt 1 Louisville, KY | 3.0 | 1.0 | 1100 | $1,300 | $1.18 | 24d | 1 | 0.97mi |
| 1731 Sonne Ave Louisville, KY | 3.0 | 1.0 | 1010 | $1,300 | $1.29 | 16d | 1 | 1.01mi |
| 1616 Gallagher St Louisville, KY | 3.0 | 1.5 | 1056 | $1,400 | $1.33 | 24d | 1 | 1.03mi |
| 3215 Virginia Ave Louisville, KY | 3.0 | 1.0 | 975 | $924 | $0.95 | 24d | 1 | 1.04mi |
| 2912 Greenwood Ave Louisville, KY | 3.0 | 2.0 | 1362 | $1,150 | $0.84 | 16d | 1 | 1.05mi |
| 2821 Greenwood Ave #1 Louisville, KY | 3.0 | 1.0 | 1113 | $1,300 | $1.17 | 24d | 1 | 1.05mi |
| 2825 Greenwood Ave #4 Louisville, KY | 3.0 | 1.0 | 1440 | $1,250 | $0.87 | 24d | 1 | 1.05mi |
| 2710 W Kentucky St Apt 2 Louisville, KY | 3.0 | 1.0 | 1015 | $1,300 | $1.28 | 24d | 1 | 1.06mi |
| 1115 S 32nd St Louisville, KY | 3.0 | 1.0 | 1393 | $1,275 | $0.92 | 24d | 1 | 1.07mi |
| 1115 S 32nd St Louisville, KY | 3.0 | 1.0 | 1393 | $1,275 | $0.92 | 22d | 1 | 1.07mi |
| 2711 W Kentucky St Louisville, KY | 3.0 | 1.0 | 1155 | $1,100 | $0.95 | 24d | 1 | 1.10mi |
| 2416 Garland Ave Louisville, KY | 3.0 | 2.0 | 1172 | $1,600 | $1.37 | 24d | 1 | 1.12mi |
| 1244 Algonquin Pkwy Louisville, KY | 3.0 | 1.5 | 1136 | $1,400 | $1.23 | 24d | 1 | 1.14mi |
| 2634 Garland Ave Unit B Louisville, KY | 3.0 | 1.0 | 1152 | $895 | $0.78 | 20d | 1 | 1.15mi |
| 2634 Garland Ave Unit A Louisville, KY | 3.0 | 1.0 | 1152 | $940 | $0.82 | 24d | 1 | 1.15mi |
| 1644 W Kentucky St Unit 3 Louisville, KY | 3.0 | 1.0 | 900 | $950 | $1.06 | 24d | 1 | 1.16mi |
| 1723 W Kentucky St Unit 3 Louisville, KY | 3.0 | 1.0 | 1200 | $1,300 | $1.08 | 24d | 1 | 1.17mi |
| 848 S 23rd St Louisville, KY | 3.0 | 1.5 | 1050 | $1,450 | $1.38 | 24d | 1 | 1.21mi |
| 3122 W Kentucky St Louisville, KY | 3.0 | 1.0 | 1030 | $1,150 | $1.12 | 24d | 1 | 1.23mi |
| 1804 Russell Lee Dr Louisville, KY | 1.0–3.0 | 1.0–1.5 | 810 | $1,304 | $1.61 | 2d | 1 | 1.24mi |
| 3611 Regatta Way Louisville, KY | 3.0 | 1.0 | 1035 | $1,450 | $1.40 | 16d | 1 | 1.29mi |
| 3514 Grand Ave Louisville, KY | 3.0 | 1.5 | 1450 | $1,295 | $0.89 | 22d | 1 | 1.33mi |
| 820 Hazel St Louisville, KY | 4.0 | 2.0 | 1872 | $1,395 | $0.75 | 3d | 1 | 1.39mi |
Listing history 13 events
-
2026-06-18days on market $139,000 Active 18 DOM
-
2026-06-17days on market $139,000 Active 17 DOM
-
2026-06-16days on market $139,000 Active 16 DOM
-
2026-06-15days on market $139,000 Active 15 DOM
-
2026-06-13days on market $139,000 Active 13 DOM
-
2026-06-10days on market $139,000 Active 10 DOM
-
2026-06-09days on market $139,000 Active 9 DOM
-
2026-06-08days on market $139,000 Active 8 DOM
-
2026-06-07days on market $139,000 Active 7 DOM
-
2026-06-03days on market $139,000 Active 3 DOM
-
2026-06-02days on market $139,000 Active 2 DOM
-
2026-06-01remarks 699-char remark
-
2026-06-01$139,000 Active 1 DOM
ⓘ Source: listings_history table (triggers on properties + properties_extension) + one-shot
backfill from property_details.listing_events for pre-trigger history.
Tax reassessment forecast KY · Resets to sale price
- Current annual tax
- $844 · $70/mo
- Projected year-2 tax
- $1,195 · $100/mo
- Expected delta
- +$351/yr (+$29/mo · 41.6%)
ⓘ Screening estimate from a state-policy table — verify with the county assessor before closing.
Climate risk First Street
- Flood 1/10 Low FEMA zone X (unshaded) · 0% chance over 30 yrs
- Wildfire 1/10 Low
- Heat 5/10 Major 7 d/yr ≥104°F today · 20 d/yr by 30 yrs out
- Wind 2/10 Low 100% chance of damaging wind over 30 yrs
- Air quality 2/10 Low 1 unhealthy d/yr today · 3 by 30 yrs out
Nearby sold comps map
Loading sold comps map…
Walkable amenities ~0.75 mi
Loading nearby amenities…
Taxation est. · year 1
- Rental income
- $16,048
- − Mortgage interest
- −$7,786
- − Property taxes
- −$844
- − Insurance
- −$695
- − Repairs & maintenance
- −$1,284
- − Management
- −$1,284
- − Depreciation
- −$4,044
- Taxable income
- $112
- Est. tax owed @ 24.0%
- −$27
- After-tax cash flow
- $2,365/yr
For passive investors: Depreciation is non-cash, so a rental often shows a tax loss while cash-flowing — sheltering income. Rental losses are passive: they offset passive income freely, and up to $25,000/yr can offset ordinary (W-2) income if you actively participate and your MAGI is under $100k (phasing out to $0 by $150k); unused losses carry forward. On sale, claimed depreciation is recaptured at up to 25%, and gains may owe capital-gains tax (a 1031 exchange can defer both). Figures are a year-1 estimate at your 24.0% rate — not tax advice; consult a CPA.
Schools (NCES district)
- District
- Jefferson County
- NCES district ID
- 2102990
- Math proficiency
- 19% ▼ -17.00%
- Reading proficiency
- 35% ▼ -11.00%
- Median HH income
- $47,885
- Composite
- 23.45/100
- National rank
- #7884
- State rank
- #121 of 165 in KY
Livability — Louisville
- Score
- 63/100
- State rank
- #333
- US rank
- #15887
Category grades
Schools grade is shown separately in the Schools card above.
Census & demographics
- Census place
- Louisville, KY
- County
- Jefferson County · 790,184 people
- City population
- 769,292
- Metro
- Louisville/Jefferson County, KY-IN
- Population (ZIP)
- 13,518
- Household income
- $35,347
- Rent vs Own
- Severe rent burden
- 815.0
Population outlook (Jefferson County) Hauer SSP2
- Today (2025)
- 823,112 people
- By 2030
- 849,343 · +3.2%
- By 2040
- 895,696 · +8.8%
- By 2050
- 933,630 · +13.4%
- By 2075
- 1,028,262 · +24.9%
- By 2100
- 1,072,675 · +30.3%
Race, ethnicity, and origin ACS 2023
- Neighborhood character
- Predominantly Black (84%)
- Race & ethnicity
- Black 84% White 8% Two or more races 5% Hispanic / Latino 3%
- Common ancestry
- Iranian 1%
- Foreign-born
- 4% · Canada
- Languages at home
- 93% English-only · Spanish 3%
Political lean MEDSL · Jefferson
- 2024 margin
- D (+16.6) · D 57.4% · R 40.9% · Other 1.7%
- 2008→2024 swing
- +4.5pp toward D · 2008: 12.0pp · 2024: 16.6pp
- All cycles
- 2024: D+16.6 2020: D+20.1 2016: D+13.3 2012: D+11.1 2008: D+12.0
Not yet ingested
- Civics
- —
Market trends
- HPI YoY
- ▲ 28.45%
- Current HPI
- 264.0146
- Rent YoY
- ▲ 8.05%
- Metro
- Louisville/Jefferson County, KY-IN
- State GDP YoY
- ▲ 1.81%
- F500 in state
- 4
Industry mix (Fortune 500 HQ in KY)
| Industry | F500 HQs | Revenue |
|---|---|---|
| Healthcare | 1 | $118B |
|
||
| Food / Beverage | 1 | $7B |
|
||
Price history
+90.4% since first listed20 events — show timeline
- 2026-05-31 Listed $139,000 Metro Search MLS
- 2026-04-11 Rental Removed $1,350 BUILDIUM
- 2026-03-24 Listed for Rent $1,350 BUILDIUM
- 2022-11-22 Rental Removed — RENT.
- 2022-04-06 Sold (Public Records) $67,000 Public Records
- 2022-04-06 Sold (MLS) $67,000 Metro Search MLS
- 2022-01-13 Pending — Metro Search MLS
- 2022-01-11 Contingent — Metro Search MLS
- 2021-10-01 Listed $75,000 Metro Search MLS
- 2021-09-30 Listing Removed — Metro Search MLS
- 2021-03-01 Listed $75,000 Metro Search MLS
- 2021-02-27 Listing Removed — Metro Search MLS
- 2020-08-21 Listed $75,000 Metro Search MLS
- 2019-06-30 Listing Removed — Metro Search MLS
- 2019-01-14 Listed $65,000 Metro Search MLS
- 2008-12-30 Sold (MLS) $23,000 Metro Search MLS
- 2008-09-19 Listed $24,900 Metro Search MLS
- 2008-05-07 Listing Removed — Metro Search MLS
- 2008-03-14 Listed $65,000 Metro Search MLS
- 2006-07-12 Sold (Public Records) $73,000 Public Records
Property tax history
+7.1%/yrLatest (2025): $844 · -1.9% YoY. Source: county tax records.
Cash-flow waterfall
monthlySold comps — $/sqft
last 12 mo · ≤1 miLoading sold comps…