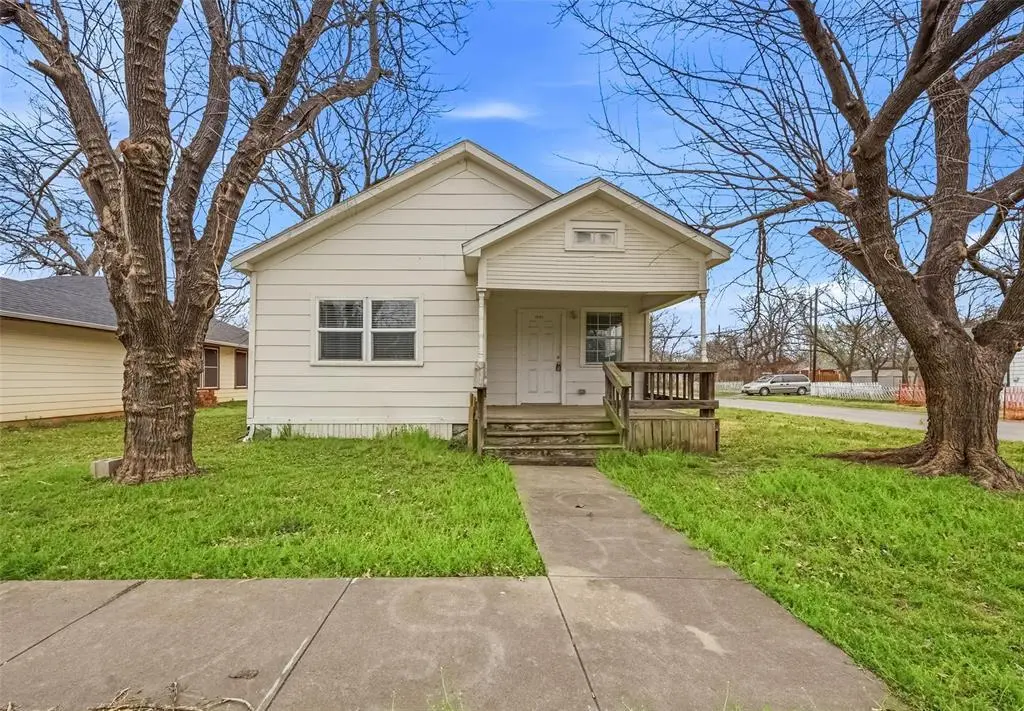
1101 N Harrison Ave · Sherman, TX
Flood risk 1/10 · Minimal
- FEMA flood zone
- X (unshaded)
- Chance of flooding over 30 yrs
- 0.0%
- Est. flood insurance / yr
- $507 – $1,088
Fire risk 6/10 · Moderate
- Est. fire insurance / yr
- $1,222 – $2,270
Heat risk 6/10 · Moderate
- Hot days now (above 108°F)
- 7 days/yr
- Hot days in 30 yrs
- 22 days/yr
Wind risk 4/10 · Minor
- Chance of severe wind over 30 yrs
- 21.0%
Air-quality risk 2/10 · Minimal
- Unhealthy air days now
- 2 days/yr
- Unhealthy air days in 30 yrs
- 2 days/yr
Risk factors via First Street. Map © Google.
Why this score? — see what drove the C- grade
The composite is a weighted blend of 9 inputs, each scored 0–100. Each bar is that input's sub-score; the figure is the points it added to the 100-point composite (weight × sub-score).
- Cash flow +17.8/30.0
- ARV discount +15.0/15.0
- DSCR +5.6/10.0
- 1% rule +5.0/10.0
- Livability +3.1/5.0
- Schools +2.9/10.0
- Condition / age +2.5/5.0
- Rent growth +1.8/5.0
- Appreciation +0.0/10.0
$120,000
🖨 Deal sheet 📄 Offer letter ✓ Due diligence
Listing remarks MLS
Cute 3 bedroom 1 bath in great part of Sherman. Priced to sell and ready for new owners. Nice corner lot and great central location Come see it today!
Key facts
- 7,492 sq ft lot
- Built 1930
- Listed 98 days
Neighborhood map
What this means for you Summary
Snapshot
- This is a 2-bed/1.0-bath single-family listed at $120k.
Deal economics
- At list price, monthly cash flow is $99 ($1k/yr) — positive.
- The deal already cash-flows at list — no discount required.
- Meets the 1% rule at list price ($1k rent vs $120k).
- Recommended offer: $109k (9.0% below list) — sets the bar for market timing.
- Cap rate 7.3% vs local median 3.7% in Sherman — top-decile yield for the area; either an underpriced asset or a hidden risk that comps aren't pricing in. Stress-test before assuming the spread holds.
Location & tenants
- Location reads 61/100 on livability (#1,027 in TX) — a middle-class / working-renter tenant base. Strengths: cost of living A+, housing A+; Watch: crime C-, employment C-, schools D-.
- Sherman ISD (urban): math 31% / reading 37% proficiency, ranked #546 of 826 in TX (top 66%) — families likely to look elsewhere, expect single-tenant / working-renter base with shorter leases.
- Market conditions: Rents soft (-2.7%/yr); 473 active listings in the ZIP; 13 comparable units currently listed for rent nearby; rentals lingering (median 44d on market — plan ~5-8 weeks vacancy on turnover, expect pricing pressure); 62% of comp listings sitting > 30 days — soft ceiling on asking rent; 2,272 units permitted in Grayson County in 2024 (750 in 5+ unit buildings).
Forward outlook
- Local home prices are declining (-3.0%/yr); year-one equity from $830 of loan paydown is wiped out by about $4k of value loss. Plan a longer hold.
- Grayson County population projected at +12% by 2050 — modest demand growth; plan on rents tracking national, not racing it.
Negotiation context
- It's been on market 99 days — a 9% lower offer ($109k) is reasonable based on typical stale-listing flexibility.
- 2 sale attempts; this cycle's ask is 8176% above the opening price — seller raised mid-cycle; expect resistance to lowballs.
Risks & watch-outs
- Watch-outs: built in 1930 — expect roof / HVAC / electrical / plumbing capex.
- Climate carrying-cost: major wildfire risk; extreme-heat days projected 7→22/yr by 2055 (HVAC capex compounding) — expect insurance premiums to compound above CPI over the hold.
Questions for the listing agent
- It's been on market 99 days. Have you received any prior offers? Is the seller open to a 9% concession, seller financing, or rate buy-down credit?
- Built in 1930 — when were the roof, HVAC, electrical panel, plumbing, and water heater last replaced?
- Why hasn't it sold? Are there any deal-killer items the seller is aware of (foundation, flood, title, zoning, code violations)?
- Is there a deadline driving the sale (1031 exchange, divorce, estate, relocation)? That informs how much negotiation room exists.
- Schools are D-rated, which usually means shorter tenancies and higher turnover. Who's the typical renter profile here, and what's been the actual vacancy rate?
- What's the average days-on-market for RENTAL listings here right now (not sales)? A rising rental-DOM trend means longer vacancies and softer asking-rent achievability than the comps imply.
- What's the recent tenant-quality profile in this submarket — average credit score on applications, eviction rate, late-payment / NSF rate, and stable-employment percentage? A property-management company in the area should have these aggregated.
- How much new for-sale + rental construction is in the pipeline within 1–3 miles? Heavy new supply typically softens prices + rents 12–24 months out; constrained supply supports both.
Investment metrics
- 1% rule
- 1.00% ✓
- Cap rate
- 7.28%
- Cash-on-cash
- 3.53%
- DSCR
- 1.16
- GRM
- 8.3
CMA / ARV
- ARV (median comp)
- $147,297
- List price
- $120,000
- Delta
- -18.53%
- Verdict
- UNDERPRICED
- Comps
- 20 within 1.0 mi
Show comp detail 6 sales within ~0.75 mi
| Address | Dist | Beds/Ba | Sqft | Sold | Price | $/sf | Match |
|---|---|---|---|---|---|---|---|
| 1306 N Brents Ave | 0.19mi | 2/1.0 | 820 (-7%) | 17mo | $159,000 | $194 | 64 |
| 1424 N Brents Ave | 0.28mi | 2/1.0 | 980 (+11%) | 11mo | $125,000 | $128 | 60 |
| 302 N Colbert Ave | 0.61mi | 2/1.0 | 916 (+3%) | 13mo | $109,990 | $120 | 55 |
| 512 N Lee Ave | 0.47mi | 2/1.0 | 988 (+12%) | 9mo | $72,500 | $73 | 51 |
| 1108 N Throckmorton St | 0.72mi | 2/1.0 | 958 (+8%) | 15mo | $167,500 | $175 | 41 |
| 517 N Elliott St | 0.52mi | 2/1.0 | 991 (+12%) | 22mo | $78,000 | $79 | 38 |
Match score weights: distance 35% · size 25% · config 20% · recency 20%. Top-matched comps best support the ARV.
Projected returns pro-forma
-3.0% appreciation · 0.0% rent growth · sell at horizon
- IRR
- -14.2%
- Equity multiple
- 0.50×
- Total profit
- $-16,640
- Equity at exit
- $17,892
- IRR
- -11.5%
- Equity multiple
- 0.41×
- Total profit
- $-19,876
- Equity at exit
- $10,375
Cash invested: $33,600 (down + closing). Projections, not guarantees.
Landlord ↔ Tenant lean methodology
- Overall (STATE)
- 87 Strongly Landlord-Friendly
- State Texas
- 87 Strongly Landlord-Friendly · R+5
- County
- — inherits STATE
- City
- — inherits STATE
ZIP-level market 75090
- Home prices YoY
- -20.0%
- Rents YoY
- -2.7%
- Active inventory
- 473
- Price-to-rent
- 8.3×
Monthly cashflow live
- Estimated rent
- $1,203 high interval (Pro) →
- Mortgage (P&I)
- −$629
- Tax from tax record
- −$172 /mo · $2,067/yr
- Insurance
- −$50
- HOA
- −$0
- Vacancy / Maint / Mgmt
- −$253
- Net cashflow
- $99
Break-even live
UW: 25.0% down · 7.5% · 30yr · 1.5% tax · 5.0% vac · 8.0% maint · 8.0% mgmt
Financing live
Cash to close
- Down payment
- $30,000
- Closing costs
- $3,600
- Reserves months
- —
- Total cash needed
- —
Loan-product check · same deal, 3 products live
Conventional
25% down · 7.5% · 30yr
- Down + closing
- —
- Monthly P&I
- —
- Monthly cashflow
- —
- DSCR
- —
- Eligible?
- —
Personal DTI + credit; lowest rate.
DSCR
20% down · 8.5% · 30yr
- Down + closing
- —
- Monthly P&I
- —
- Monthly cashflow
- —
- DSCR
- —
- Eligible?
- —
No personal income docs; deal must DSCR.
Hard money
10% down · 12.0% · 12mo
- Down + closing
- —
- Monthly P&I
- —
- Monthly cashflow
- —
- DSCR
- —
- Eligible?
- —
Short-term bridge; refi at stabilization.
Rent comps 13 comps
| Address | Beds | Baths | Sqft | Rent | $/sqft | DOM | Units | Dist |
|---|---|---|---|---|---|---|---|---|
| 515 N Colbert Ave Sherman, TX | 2.0 | 1.0 | 707 | $1,250 | $1.77 | 21d | 1 | 0.50mi |
| 108 N Cleveland Ave Sherman, TX | 3.0 | 1.5 | 1060 | $1,200 | $1.13 | 43d | 1 | 0.66mi |
| 704 Frisco Rd Sherman, TX | 2.0 | 1.0 | 682 | $795 | $1.17 | 43d | 1 | 0.76mi |
| 410 S Vaden St Unit A Sherman, TX | 1.0 | 1.0 | 700 | $850 | $1.21 | 43d | 1 | 0.98mi |
| 620 N Walnut St Sherman, TX | 2.0 | 1.0 | 1100 | $1,050 | $0.95 | 43d | 1 | 1.12mi |
| 1312 N Travis St Sherman, TX | 3.0 | 1.5 | 1086 | $1,325 | $1.22 | 43d | 1 | 1.20mi |
| 1600 La Salle Dr Sherman, TX | 2.0 | 1.0–2.0 | 687 | $1,014 | $1.47 | 21d | 15 | 1.36mi |
| 304 E King St Sherman, TX | 2.0 | 1.0 | 876 | $1,250 | $1.43 | 43d | 1 | 1.40mi |
| 221 W Taylor St Sherman, TX | 3.0 | 2.0 | 917 | $1,425 | $1.55 | 21d | 1 | 1.43mi |
| 1615 N Alexander St Sherman, TX | 2.0 | 1.0 | 826 | $950 | $1.15 | 21d | 1 | 1.45mi |
| 820 N Sam Rayburn Fwy Unit 204 Sherman, TX | 2.0 | 1.5 | 1027 | $1,350 | $1.31 | 43d | 1 | 1.46mi |
| 923 S First St Sherman, TX | 2.0 | 1.0 | 891 | $1,125 | $1.26 | 21d | 1 | 1.46mi |
| 1006 S Throckmorton St Sherman, TX | 2.0 | 1.0 | 705 | $1,026 | $1.46 | 43d | 1 | 1.50mi |
Listing history 23 events
-
2026-06-19days on market $120,000 Active 99 DOM
-
2026-06-18days on market $120,000 Active 98 DOM
-
2026-06-17days on market $120,000 Active 97 DOM
-
2026-06-16days on market $120,000 Active 96 DOM
-
2026-06-15price $120,000 Active 95 DOM
-
2026-06-15days on market $130,000 Active 95 DOM
-
2026-06-14days on market $130,000 Active 93 DOM
-
2026-06-13days on market $130,000 Active 92 DOM
-
2026-06-10days on market $130,000 Active 90 DOM
-
2026-06-09days on market $130,000 Active 89 DOM
-
2026-06-08days on market $130,000 Active 88 DOM
-
2026-06-07days on market $130,000 Active 87 DOM
-
2026-06-03days on market $130,000 Active 83 DOM
-
2026-06-02days on market $130,000 Active 82 DOM
-
2026-06-01days on market $130,000 Active 81 DOM
-
2026-05-31days on market $130,000 Active 80 DOM
-
2026-05-30days on market $130,000 Active 79 DOM
-
2026-05-09price $1,375
Show marketing remark (152 chars)
Cute 3 bedroom 1 bath in great part of Sherman. Priced to sell and ready for new owners. Nice corner lot and great central location Come see it today!
-
2026-05-09price $130,000 152-char remark
Show marketing remark (152 chars)
Cute 3 bedroom 1 bath in great part of Sherman. Priced to sell and ready for new owners. Nice corner lot and great central location Come see it today!
-
2026-03-20$1,450
-
2026-03-12$137,500 Active 152-char remark
Show marketing remark (152 chars)
Cute 3 bedroom 1 bath in great part of Sherman. Priced to sell and ready for new owners. Nice corner lot and great central location Come see it today!
-
2022-06-23soldstatus
-
2007-08-29soldstatus
ⓘ Source: listings_history table (triggers on properties + properties_extension) + one-shot
backfill from property_details.listing_events for pre-trigger history.
Tax reassessment forecast TX · Resets to sale price
- Current annual tax
- $2,067 · $172/mo
- Projected year-2 tax
- $2,196 · $183/mo
- Expected delta
- +$129/yr (+$11/mo · 6.2%)
ⓘ Screening estimate from a state-policy table — verify with the county assessor before closing.
Climate risk First Street
- Flood 1/10 Low FEMA zone X (unshaded) · 0% chance over 30 yrs
- Wildfire 6/10 Major
- Heat 6/10 Major 7 d/yr ≥108°F today · 22 d/yr by 30 yrs out
- Wind 4/10 Moderate 21% chance of damaging wind over 30 yrs
- Air quality 2/10 Low 2 unhealthy d/yr today · 2 by 30 yrs out
Nearby sold comps map
Loading sold comps map…
Walkable amenities ~0.75 mi
Loading nearby amenities…
Taxation est. · year 1
- Rental income
- $14,437
- − Mortgage interest
- −$6,722
- − Property taxes
- −$2,067
- − Insurance
- −$600
- − Repairs & maintenance
- −$1,155
- − Management
- −$1,155
- − Depreciation
- −$3,491
- Taxable loss
- −$753
- Est. tax savings @ 24.0%
- +$181
- After-tax cash flow
- $1,367/yr
For passive investors: Depreciation is non-cash, so a rental often shows a tax loss while cash-flowing — sheltering income. Rental losses are passive: they offset passive income freely, and up to $25,000/yr can offset ordinary (W-2) income if you actively participate and your MAGI is under $100k (phasing out to $0 by $150k); unused losses carry forward. On sale, claimed depreciation is recaptured at up to 25%, and gains may owe capital-gains tax (a 1031 exchange can defer both). Figures are a year-1 estimate at your 24.0% rate — not tax advice; consult a CPA.
Schools (NCES district)
- District
- Sherman ISD
- NCES district ID
- 4840080
- Math proficiency
- 31% ▼ -9.00%
- Reading proficiency
- 37% ▼ -2.00%
- Median HH income
- $42,587
- Composite
- 28.79/100
- National rank
- #6665
- State rank
- #546 of 826 in TX
Livability — Sherman
- Score
- 61/100
- State rank
- #1027
- US rank
- #18243
Category grades
Schools grade is shown separately in the Schools card above.
Census & demographics
- Census place
- Sherman, TX
- County
- Grayson County · 108,053 people
- City population
- 54,936
- Metro
- Sherman-Denison, TX
- Population (ZIP)
- 26,594
- Household income
- $55,543
- Rent vs Own
- Severe rent burden
- 840.0
Population outlook (Grayson County) Hauer SSP2
- Today (2025)
- 134,540 people
- By 2030
- 138,653 · +3.1%
- By 2040
- 145,958 · +8.5%
- By 2050
- 151,218 · +12.4%
- By 2075
- 161,802 · +20.3%
- By 2100
- 159,036 · +18.2%
Race, ethnicity, and origin ACS 2023
- Neighborhood character
- Diverse neighborhood (Simpson 0.64)
- Race & ethnicity
- White 49% Hispanic / Latino 32% Two or more races 17% Black 11%
- Hispanic origin (detail)
- Mexican 26%
- Common ancestry
- Slovak 2% Romanian 2% Lithuanian 1%
- Foreign-born
- 15% · Canada
- Languages at home
- 73% English-only · Spanish 24% German/W. Germanic 1% Other Indo-European 1%
Political lean MEDSL · Grayson
- 2024 margin
- Solid R (+54.3) · D 22.5% · R 76.7%
- 2008→2024 swing
- -16.4pp toward R · 2008: -37.9pp · 2024: -54.3pp
- All cycles
- 2024: R+54.3 2020: R+49.9 2016: R+53.1 2012: R+48.0 2008: R+37.9
Not yet ingested
- Civics
- —
Market trends
- HPI YoY
- ▼ -69.00%
- Current HPI
- 276.5739
- Rent YoY
- ▼ -2.70%
- Metro
- Sherman-Denison, TX
- State GDP YoY
- ▲ 3.95%
- F500 in state
- 110
Industry mix (Fortune 500 HQ in TX)
| Industry | F500 HQs | Revenue |
|---|---|---|
| Energy | 16 | $1,198B |
|
||
| Technology | 5 | $198B |
|
||
| Engineering / Construction | 4 | $72B |
|
||
| Energy Services | 3 | $60B |
|
||
| Utilities | 3 | $41B |
|
||
| Healthcare | 2 | $330B |
|
||
Price history
-99.0% since first listed6 events — show timeline
- 2026-05-09 Price Changed $1,375 NTREIS
- 2026-05-09 Price Changed $130,000 NTREIS
- 2026-03-20 Listed for Rent $1,450 NTREIS
- 2026-03-12 Listed $137,500 NTREIS
- 2022-06-23 Sold (Public Records) — Public Records
- 2007-08-29 Sold (Public Records) — Public Records
Property tax history
+5.7%/yrLatest (2025): $2,067 · -4.5% YoY. Source: county tax records.
Cash-flow waterfall
monthlySold comps — $/sqft
last 12 mo · ≤1 miLoading sold comps…