26025 S Cherry St · Georgetown, DE
Flood risk 1/10 · Minimal
- FEMA flood zone
- X (unshaded)
- Chance of flooding over 30 yrs
- 0.0%
- Est. flood insurance / yr
- $473 – $860
Fire risk 2/10 · Minimal
- Est. fire insurance / yr
- $476 – $884
Heat risk 8/10 · Major
- Hot days now (above 105°F)
- 7 days/yr
- Hot days in 30 yrs
- 16 days/yr
Wind risk 8/10 · Major
- Chance of severe wind over 30 yrs
- 80.0%
Air-quality risk 2/10 · Minimal
- Unhealthy air days now
- 1 days/yr
- Unhealthy air days in 30 yrs
- 1 days/yr
Risk factors via First Street. Map © Google.
Why this score? — see what drove the D grade
The composite is a weighted blend of 9 inputs, each scored 0–100. Each bar is that input's sub-score; the figure is the points it added to the 100-point composite (weight × sub-score).
- Cash flow +15.0/30.0
- ARV discount +7.5/15.0
- 1% rule +5.0/10.0
- DSCR +5.0/10.0
- Livability +3.4/5.0
- Schools +2.9/10.0
- Rent growth +2.5/5.0
- Condition / age +2.5/5.0
- Appreciation +0.0/10.0
$44,999
🖨 Deal sheet 📄 Offer letter ✓ Due diligence
Listing remarks
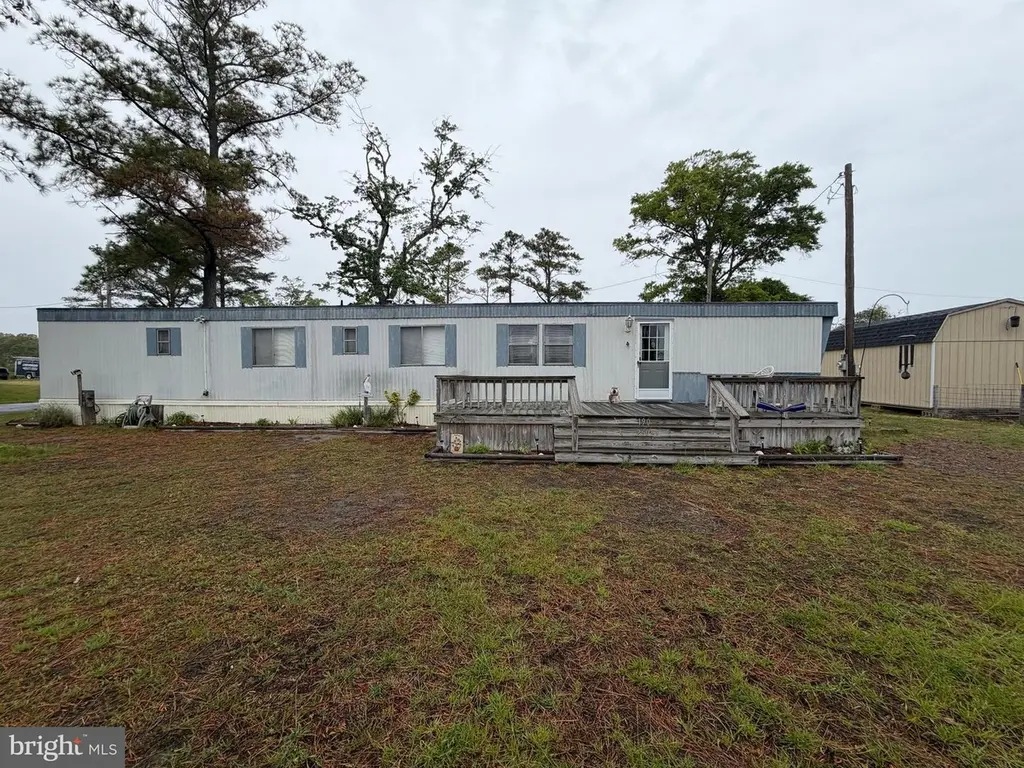
Tucked away in the sought-after Bay City community of Millsboro, this 3-bedroom, 1.5-bath home offers the kind of peaceful marsh views that make every day feel like a getaway. Whether you're searching for a weekend retreat, vacation rental opportunity, or your own coastal escape, this property is ready to enjoy from day one while still offering room to add value and personal touches. Inside, you’ll find comfortable living spaces with plenty of potential to bring the home into full 2026 style and design. Outside is where this property truly shines — relax with your morning coffee overlooking the marsh, unwind after a beach day, or entertain while soaking in the natural beauty tha
Key facts
- 187.48 acre lot
- 4 parking spots
- Built 1981
Property features AI
Finance
- Other: Located outside city limits; Situated between Route 1 and 113; Waterbody type: cove; Federal flood zone
- Financial info: Land lease of $950.67 per month; Land lease years remaining listed as 0
- HOA & community: Community amenities include beach, boat slip, boat ramp, tennis courts, and playground
Exterior
- Parking: Driveway with four parking spaces (total of four garage/parking spaces listed)
- Security:
- Utilities: Public water; Public sewer; Electric cooling fuel; Electric hot water
- Home design: Detached structure; Modular/Manufactured construction
- Construction: Crawl space foundation; Above-grade and below-grade other structures
- Exterior features: Water view; On waterfront with approximately 100 feet of water frontage; 2+ access exits
Interior
- Kitchen:
- Bedrooms: Three bedrooms on the main level
- Flooring:
- Bathrooms: One full bathroom; One half bathroom
- Heating & cooling: Forced air heating; Central air conditioning; Propane (leased) heating fuel; Electric hot water
- Interior features: No basement; Living area per assessor
- Laundry & utility:
Neighborhood map
What this means for you Summary
Snapshot
- This is a 3-bed/1.5-bath manufactured listed at $45k.
Deal economics
- At list price, monthly cash flow is $1k ($17k/yr) — positive.
- The deal already cash-flows at list — no discount required.
- Meets the 1% rule at list price ($2k rent vs $45k).
- Recommended offer: $44k (3.0% below list) — sets the bar for market timing.
- Cap rate 44.1% vs local median 2.9% in Georgetown — top-decile yield for the area; either an underpriced asset or a hidden risk that comps aren't pricing in. Stress-test before assuming the spread holds.
Location & tenants
- Location reads 68/100 on livability (#35 in DE) — a middle-class / working-renter tenant base. Strengths: health & safety A+, cost of living B+; Watch: amenities D+, commute D+, schools D.
- Indian River School District (rural): math 25% / reading 41% proficiency, ranked #14 of 26 in DE (top 54%) — families likely to look elsewhere, expect single-tenant / working-renter base with shorter leases.
- Market conditions: 865 active listings in the ZIP; 1 comparable units currently listed for rent nearby; solid renter incomes; 4,354 units permitted in Sussex County in 2024 (344 in 5+ unit buildings).
- This rent runs 33% of the median local income ($78k/yr) — at the standard rent-burdened threshold; future hikes will face affordability resistance.
Forward outlook
- Local home prices are declining (-3.0%/yr); year-one equity from $311 of loan paydown is wiped out by about $1k of value loss. Plan a longer hold.
- Sussex County population projected at +25% by 2050 — long-run rental-demand tailwind backs the buy-and-hold thesis.
- At projected returns (-3.0% appreciation + 3.0% rent growth), your $13k cash investment doubles in ~1 year — after that, you're playing with house money.
Negotiation context
- It's been on market 35 days — a 3% lower offer ($44k) is reasonable based on typical stale-listing flexibility.
Risks & watch-outs
- Climate carrying-cost: severe wind risk, 80% chance of damaging wind over 30y; extreme-heat days projected 7→16/yr by 2055 (HVAC capex compounding) — expect insurance premiums to compound above CPI over the hold.
Questions for the listing agent
- It's been on market 35 days. Have you received any prior offers? Is the seller open to a 3% concession, seller financing, or rate buy-down credit?
- Is there a deadline driving the sale (1031 exchange, divorce, estate, relocation)? That informs how much negotiation room exists.
- Schools are D-rated, which usually means shorter tenancies and higher turnover. Who's the typical renter profile here, and what's been the actual vacancy rate?
- Crime grade is F in this area — have there been break-ins, vandalism, or insurance claims at this property in the last 3 years? What carrier currently insures it and at what premium?
- The area grade is low — what's the realistic commute time and amenity access for the typical tenant pool here? Any planned neighborhood developments (good or bad) we should know about?
- What's the average days-on-market for RENTAL listings here right now (not sales)? A rising rental-DOM trend means longer vacancies and softer asking-rent achievability than the comps imply.
- What's the recent tenant-quality profile in this submarket — average credit score on applications, eviction rate, late-payment / NSF rate, and stable-employment percentage? A property-management company in the area should have these aggregated.
- How much new for-sale + rental construction is in the pipeline within 1–3 miles? Heavy new supply typically softens prices + rents 12–24 months out; constrained supply supports both.
Investment metrics
- 1% rule
- 4.75% ✓
- Cap rate
- 44.12%
- Cash-on-cash
- 135.10%
- DSCR
- 7.01
- GRM
- 1.8
CMA / ARV
- ARV (median comp)
- $286,877
- List price
- $44,999
- Delta
- -84.31%
- Verdict
- UNDERPRICED
- Comps
- 17 within 1.0 mi
Projected returns pro-forma
-3.0% appreciation · 3.0% rent growth · sell at horizon
- IRR
- —
- Equity multiple
- 7.59×
- Total profit
- $83,060
- Equity at exit
- $6,709
- IRR
- —
- Equity multiple
- 15.98×
- Total profit
- $188,688
- Equity at exit
- $3,891
Cash invested: $12,600 (down + closing). Projections, not guarantees.
Landlord ↔ Tenant lean methodology
- Overall (STATE)
- 70 Landlord-Friendly
- State Delaware
- 70 Landlord-Friendly · D+7
- County
- — inherits STATE
- City
- — inherits STATE
ZIP-level market 19966
- Home prices YoY
- -6.4%
- Active inventory
- 865
- Price-to-rent
- 1.8×
Monthly cashflow live
- Estimated rent
- $2,137 medium interval (Pro) →
- Mortgage (P&I)
- −$236
- Tax from tax record
- −$15 /mo · $181/yr
- Insurance
- −$19
- HOA
- −$0
- Vacancy / Maint / Mgmt
- −$449
- Net cashflow
- $1,418
Break-even live
UW: 25.0% down · 7.5% · 30yr · 1.5% tax · 5.0% vac · 8.0% maint · 8.0% mgmt
Financing live
Cash to close
- Down payment
- $11,250
- Closing costs
- $1,350
- Reserves months
- —
- Total cash needed
- —
Loan-product check · same deal, 3 products live
Conventional
25% down · 7.5% · 30yr
- Down + closing
- —
- Monthly P&I
- —
- Monthly cashflow
- —
- DSCR
- —
- Eligible?
- —
Personal DTI + credit; lowest rate.
DSCR
20% down · 8.5% · 30yr
- Down + closing
- —
- Monthly P&I
- —
- Monthly cashflow
- —
- DSCR
- —
- Eligible?
- —
No personal income docs; deal must DSCR.
Hard money
10% down · 12.0% · 12mo
- Down + closing
- —
- Monthly P&I
- —
- Monthly cashflow
- —
- DSCR
- —
- Eligible?
- —
Short-term bridge; refi at stabilization.
Rent comps 1 comps
| Address | Beds | Baths | Sqft | Rent | $/sqft | DOM | Units | Dist |
|---|---|---|---|---|---|---|---|---|
| 401 College Park Dr Georgetown, DE | 1.0–2.0 | 1.0–2.0 | 856 | $1,649 | $1.93 | 13d | 1 | 0.61mi |
Listing history 16 events
-
2026-06-18days on market $44,999 Active 35 DOM
-
2026-06-17days on market $44,999 Active 34 DOM
-
2026-06-16days on market $44,999 Active 33 DOM
-
2026-06-15days on market $44,999 Active 32 DOM
-
2026-06-14days on market $44,999 Active 30 DOM
-
2026-06-13days on market $44,999 Active 29 DOM
-
2026-06-10days on market $44,999 Active 27 DOM
-
2026-06-09days on market $44,999 Active 26 DOM
-
2026-06-08days on market $44,999 Active 25 DOM
-
2026-06-07pricedays on market $44,999 Active 24 DOM
-
2026-06-02days on market $49,999 Active 19 DOM
-
2026-06-01days on market $49,999 Active 18 DOM
-
2026-05-31days on market $49,999 Active 17 DOM
-
2026-05-30days on market $49,999 Active 16 DOM
-
2026-05-15$49,999 Active 989-char remark
-
2026-05-14historical $49,999 989-char remark
ⓘ Source: listings_history table (triggers on properties + properties_extension) + one-shot
backfill from property_details.listing_events for pre-trigger history.
Tax reassessment forecast DE · Partial reset (capped growth)
- Current annual tax
- $181 · $15/mo
- Projected year-2 tax
- $221 · $18/mo
- Expected delta
- +$40/yr (+$3/mo · 22.0%)
ⓘ Screening estimate from a state-policy table — verify with the county assessor before closing.
Climate risk First Street
- Flood 1/10 Low FEMA zone X (unshaded) · 0% chance over 30 yrs
- Wildfire 2/10 Low
- Heat 8/10 Severe 7 d/yr ≥105°F today · 16 d/yr by 30 yrs out
- Wind 8/10 Severe 80% chance of damaging wind over 30 yrs
- Air quality 2/10 Low 1 unhealthy d/yr today · 1 by 30 yrs out
Nearby sold comps map
Loading sold comps map…
Walkable amenities ~0.75 mi
Loading nearby amenities…
Taxation est. · year 1
- Rental income
- $25,645
- − Mortgage interest
- −$2,521
- − Property taxes
- −$181
- − Insurance
- −$225
- − Repairs & maintenance
- −$2,052
- − Management
- −$2,052
- − Depreciation
- −$1,309
- Taxable income
- $17,306
- Est. tax owed @ 24.0%
- −$4,153
- After-tax cash flow
- $12,868/yr
For passive investors: Depreciation is non-cash, so a rental often shows a tax loss while cash-flowing — sheltering income. Rental losses are passive: they offset passive income freely, and up to $25,000/yr can offset ordinary (W-2) income if you actively participate and your MAGI is under $100k (phasing out to $0 by $150k); unused losses carry forward. On sale, claimed depreciation is recaptured at up to 25%, and gains may owe capital-gains tax (a 1031 exchange can defer both). Figures are a year-1 estimate at your 24.0% rate — not tax advice; consult a CPA.
Schools (NCES district)
- District
- Indian River School District
- NCES district ID
- 1000680
- Math proficiency
- 25% ▼ -27.00%
- Reading proficiency
- 41% ▼ -17.00%
- Median HH income
- $53,838
- Composite
- 28.99/100
- National rank
- #6620
- State rank
- #14 of 26 in DE
Livability — Georgetown
- Score
- 68/100
- State rank
- #35
- US rank
- #9760
Category grades
Schools grade is shown separately in the Schools card above.
Census & demographics
- Census place
- Georgetown, DE
- County
- Sussex County · 82,708 people
- Metro
- Salisbury, MD-DE
- Population (ZIP)
- 35,884
- Household income
- $78,305
- Rent vs Own
- Severe rent burden
- 464.0
Population outlook (Sussex County) Hauer SSP2
- Today (2025)
- 248,853 people
- By 2030
- 264,464 · +6.3%
- By 2040
- 290,980 · +16.9%
- By 2050
- 311,259 · +25.1%
- By 2075
- 352,488 · +41.6%
- By 2100
- 367,406 · +47.6%
Race, ethnicity, and origin ACS 2023
- Neighborhood character
- Predominantly White (74%)
- Race & ethnicity
- White 74% Hispanic / Latino 11% Black 8% Two or more races 7% Native American 3% Asian 1%
- Hispanic origin (detail)
- Mexican 3%
- Common ancestry
- Romanian 4% Slovak 2% Serbian 1%
- Foreign-born
- 8% · Canada, China
- Languages at home
- 88% English-only · Spanish 9% Other Indo-European 1%
Political lean MEDSL · Sussex
- 2024 margin
- R (+11.0) · D 43.9% · R 54.9% · Other 1.2%
- 2008→2024 swing
- -2.4pp toward R · 2008: -8.6pp · 2024: -11.0pp
- All cycles
- 2024: R+11.0 2020: R+11.2 2016: R+22.0 2012: R+13.0 2008: R+8.6
Not yet ingested
- Civics
- —
Market trends
- HPI YoY
- ▼ -18.26%
- Current HPI
- 268.5609
- Rent YoY
- —
- Metro
- Salisbury, MD-DE
- State GDP YoY
- —
- F500 in state
- 0
Price history
-10.0% since first listed3 events — show timeline
- 2026-06-04 Price Changed $44,999 BRIGHT MLS
- 2026-05-15 Listed $49,999 BRIGHT MLS
- 2026-05-14 Coming Soon $49,999 BRIGHT MLS
Property tax history
-4.8%/yrLatest (2025): $181 · -42.6% YoY. Source: county tax records.
Cash-flow waterfall
monthlySold comps — $/sqft
last 12 mo · ≤1 miLoading sold comps…