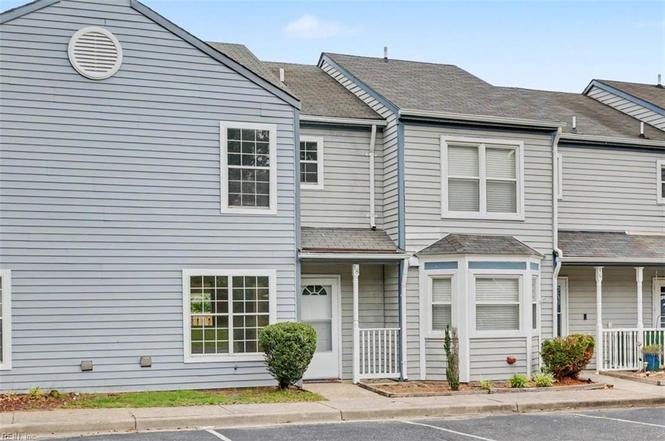
18 Bayview Ct · Hampton, VA
Flood risk 5/10 · Moderate
- FEMA flood zone
- X (unshaded)
- Chance of flooding over 30 yrs
- 0.51%
- Est. flood insurance / yr
- $507 – $1,088
Fire risk 1/10 · Minimal
- Est. fire insurance / yr
- $666 – $1,236
Heat risk 9/10 · Severe
- Hot days now (above 105°F)
- 7 days/yr
- Hot days in 30 yrs
- 17 days/yr
Wind risk 8/10 · Major
- Chance of severe wind over 30 yrs
- 80.0%
Air-quality risk 2/10 · Minimal
- Unhealthy air days now
- 2 days/yr
- Unhealthy air days in 30 yrs
- 2 days/yr
Risk factors via First Street. Map © Google.
Why this score? — see what drove the D- grade
The composite is a weighted blend of 9 inputs, each scored 0–100. Each bar is that input's sub-score; the figure is the points it added to the 100-point composite (weight × sub-score).
- Cash flow +12.6/30.0
- Schools +5.5/10.0
- ARV discount +4.5/15.0
- DSCR +3.8/10.0
- Livability +3.8/5.0
- 1% rule +3.4/10.0
- Rent growth +2.5/5.0
- Condition / age +2.5/5.0
- Appreciation +0.0/10.0
$239,900
🖨 Deal sheet (PDF) 📄 Offer letter ✓ Due diligence
Listing remarks MLS
Welcome to Buckroe Beach VA! Enjoy living at the front door of the beaches of Hampton! 2 story, townhome with 2 master bedroom suites, 2 full and 1 half bath! New HGTV kitchen with new stainless steel appliances! Shows like new money but only $239,900.
Key facts
- 2 story townhome
- New hgtv kitchen
- $60 HOA
Tags
Property features AI
Finance
- HOA & community: Bayview Landing HOA; Monthly POA fee: $60; Ground maintenance and trash pickup included
Exterior
- Parking: Assigned/reserved parking; Off-street parking; Driveway space
- Utilities: City/County water; City/County sewer; Electric water heater; 220 V electrical available
- Home design: Detached townhouse; Two stories (2 living levels); Slab foundation; Simple ownership
- Construction: Aluminum and vinyl siding; Asphalt shingle roof
- Exterior features: Patio; Back and partial fencing; Storage shed; Wooded view
Interior
- Kitchen: Electric range; Dishwasher; Garbage disposal; Refrigerator; Breakfast area
- Bedrooms: Two bedrooms with ensuite bathrooms; Master bedroom on 2nd floor
- Flooring: Carpet; Laminate
- Bathrooms: Two full bathrooms; One half bathroom
- Heating & cooling: Heat pump; Central air; Forced hot air
- Interior features: Ceiling fan; Wood-burning fireplace; Walk-in closet; Attic; Foyer; Porch; Utility closet
- Laundry & utility: Main floor laundry; Dryer hookup; Washer hookup; Utility room
Neighborhood map
What this means for you Summary
Snapshot
- This is a 3-bed/2.5-bath townhouse listed at $240k.
Deal economics
- At list price, monthly cash flow is $-30 ($-359/yr) — negative.
- To cash-flow at today's rent, offer at most $235k (2.2% below list).
- To meet the 1% rule (rent ≥ 1% of price), the offer needs to be $201k (16.1% below list).
- Recommended offer: $201k (16.1% below list) — sets the bar for 1% rule.
- Cap rate 6.1% vs local median 4.5% in Hampton — top-decile yield for the area; either an underpriced asset or a hidden risk that comps aren't pricing in. Stress-test before assuming the spread holds.
Location & tenants
- Location reads 75/100 on livability (#133 in VA, #4,302 nationally) — a middle-class / working-renter tenant base. Strengths: housing A+, health & safety A+, cost of living A; Watch: crime C-, amenities D+, commute F.
- Hampton City Public School District (urban): math 60% / reading 70% proficiency, ranked #40 of 131 in VA (top 30%) — acceptable for families but not a draw, mixed tenant base, ~2y average lease.
- Zoned schools: Jane H. Bryan Elementary (math 42% / reading 57%, grade D, #742 of 1,108 statewide, top 70%, 376 students, 82% FRL); Benjamin Syms Middle (math 62% / reading 64%, grade B+, #134 of 342 statewide, top 40%, 897 students, 69% FRL); Phoebus High (math 57% / reading 76%, grade B, #195 of 319 statewide, top 62%, 1,365 students, 86% FRL) — zoned schools average 79% FRL vs 49% district-wide (30 pts higher); higher-poverty schools than district average — tighter screening recommended.
- Market conditions: 97 active listings in the ZIP; 17 comparable units currently listed for rent nearby; rentals at typical pace (median 23d on market — plan ~3-4 weeks tenant-placement turnaround); 41% of comp listings sitting > 30 days — soft ceiling on asking rent; solid renter incomes; 68 units permitted in Hampton city in 2024 (0 in 5+ unit buildings).
Forward outlook
- Local home prices are declining (-3.0%/yr); year-one equity from $2k of loan paydown is wiped out by about $7k of value loss. Plan a longer hold.
- Hampton County population projected at -13% by 2050 — secular population decline; favor cash flow + early exit over multi-decade hold.
Negotiation context
- Only 4 days on market — expect competitive offers; lowballing is unlikely to land.
- 2 sale attempts with the ask held roughly flat each time — persistent listings suggest the price (not the market) is what's stuck; bring a comps-based counter.
- Current owner paid $160k; 50% above their basis — modest negotiation headroom, anchor on the comps not their cost.
Risks & watch-outs
- Climate carrying-cost: moderate flood risk; severe wind risk, 80% chance of damaging wind over 30y; extreme-heat days projected 7→17/yr by 2055 (HVAC capex compounding) — expect insurance premiums to compound above CPI over the hold.
Questions for the listing agent
- What do current leases actually rent for vs. the listed asking? Can we see a recent rent roll and the last 12 months of T-12 income?
- What does the HOA fee cover, when was the last increase, and are there any pending special assessments or reserve-fund shortfalls?
- Is there a deadline driving the sale (1031 exchange, divorce, estate, relocation)? That informs how much negotiation room exists.
- Schools are B-rated — typically a magnet for longer-tenancy family renters. What's the average tenant stay here, and is there a school-zone premium baked into asking?
- The area grade is low — what's the realistic commute time and amenity access for the typical tenant pool here? Any planned neighborhood developments (good or bad) we should know about?
- What's the average days-on-market for RENTAL listings here right now (not sales)? A rising rental-DOM trend means longer vacancies and softer asking-rent achievability than the comps imply.
- What's the recent tenant-quality profile in this submarket — average credit score on applications, eviction rate, late-payment / NSF rate, and stable-employment percentage? A property-management company in the area should have these aggregated.
- How much new for-sale + rental construction is in the pipeline within 1–3 miles? Heavy new supply typically softens prices + rents 12–24 months out; constrained supply supports both.
Investment metrics
- 1% rule
- 0.84% ✗
- Cap rate
- 6.14%
- Cash-on-cash
- -0.53%
- DSCR
- 0.98
- GRM
- 9.9
CMA / ARV
- ARV (on-the-fly)
- $224,688
- Comps found
- 12
Show comp detail 12 sales within ~0.75 mi
| Address | Dist | Beds/Ba | Sqft | Sold | Price | $/sf | Match |
|---|---|---|---|---|---|---|---|
| 9 Bayview Ct | 0.03mi | 2/2.5 (-1) | 1,208 (0%) | 1mo | $225,000 | $186 | 93 |
| 16 Bayview Ct | 0.00mi | 2/2.5 (-1) | 1,168 (-3%) | 5mo | $230,000 | $197 | 85 |
| 157 Atlantic Ave Unit C | 0.22mi | 2/2.0 (-1) | 1,220 (+1%) | 9mo | $215,000 | $176 | 74 |
| 13 Cantamar Ct | 0.48mi | 2/2.5 (-1) | 1,200 (-1%) | 1mo | $325,000 | $271 | 71 |
| 128 N First St | 0.50mi | 2/2.5 (-1) | 1,200 (-1%) | 2mo | $301,000 | $251 | 69 |
| 155 Atlantic Ave Unit C2 | 0.23mi | 3/2.0 | 1,351 (+12%) | 3mo | $240,000 | $178 | 65 |
| 155 Atlantic Ave Unit C | 0.23mi | 3/2.0 | 1,357 (+12%) | 3mo | $240,000 | $177 | 64 |
| 161 Atlantic Ave Unit A | 0.22mi | 2/2.0 (-1) | 1,229 (+2%) | 20mo | $236,000 | $192 | 63 |
| 175 Atlantic Ave Unit B | 0.22mi | 3/2.0 | 1,351 (+12%) | 10mo | $240,000 | $178 | 60 |
| 155 Atlantic Ave Unit B | 0.22mi | 3/2.0 | 1,365 (+13%) | 12mo | $250,000 | $183 | 56 |
| 308 N First St | 0.64mi | 2/2.0 (-1) | 1,200 (-1%) | 13mo | $297,500 | $248 | 51 |
| 169 Atlantic Ave Unit A | 0.22mi | 3/2.0 | 1,365 (+13%) | 21mo | $236,000 | $173 | 49 |
Match score weights: distance 35% · size 25% · config 20% · recency 20%. Top-matched comps best support the ARV.
Projected returns pro-forma
-3.0% appreciation · 3.0% rent growth · sell at horizon
- IRR
- -17.2%
- Equity multiple
- 0.39×
- Total profit
- $-40,770
- Equity at exit
- $35,770
- IRR
- -9.1%
- Equity multiple
- 0.44×
- Total profit
- $-37,926
- Equity at exit
- $20,742
Cash invested: $67,172 (down + closing). Projections, not guarantees.
Landlord ↔ Tenant lean methodology
- Overall (STATE)
- 55 Moderately Landlord-Leaning
- State Virginia
- 55 Moderately Landlord-Leaning · D+2
- County
- — inherits STATE
- City
- — inherits STATE
ZIP-level market 23664
- Home prices YoY
- -23.6%
- Active inventory
- 97
- Price-to-rent
- 9.9×
Monthly cashflow live
- Estimated rent
- $2,012 high interval (Pro) →
- Mortgage (P&I)
- −$1,258
- Tax from tax record
- −$201 /mo · $2,415/yr
- Insurance
- −$100
- HOA
- −$60
- Vacancy / Maint / Mgmt
- −$422
- Net cashflow
- $-30
Break-even live
Sensitivity live
| Price | -10% $106 | -5% $38 | +0% $-30 | +5% $-98 | +10% $-166 |
|---|---|---|---|---|---|
| Rent | -10% $-189 | -5% $-109 | +0% $-30 | +5% $50 | +10% $129 |
| Rate | -1.0pp $91 | -0.5pp $31 | base $-30 | +0.5pp $-92 | +1.0pp $-155 |
UW: 25.0% down · 7.5% · 30yr · 1.5% tax · 5.0% vac · 8.0% maint · 8.0% mgmt
Financing live
Cash to close
- Down payment
- $59,975
- Closing costs
- $7,197
- Reserves months
- —
- Total cash needed
- —
Loan-product check · same deal, 3 products live
Conventional
25% down · 7.5% · 30yr
- Down + closing
- —
- Monthly P&I
- —
- Monthly cashflow
- —
- DSCR
- —
- Eligible?
- —
Personal DTI + credit; lowest rate.
DSCR
20% down · 8.5% · 30yr
- Down + closing
- —
- Monthly P&I
- —
- Monthly cashflow
- —
- DSCR
- —
- Eligible?
- —
No personal income docs; deal must DSCR.
Hard money
10% down · 12.0% · 12mo
- Down + closing
- —
- Monthly P&I
- —
- Monthly cashflow
- —
- DSCR
- —
- Eligible?
- —
Short-term bridge; refi at stabilization.
Rent comps 17 comps
| Address | Beds | Baths | Sqft | Rent | $/sqft | DOM | Units | Dist |
|---|---|---|---|---|---|---|---|---|
| 1665 N Mallory St Hampton, VA | 2.0 | 1.0 | 1250 | $1,785 | $1.43 | 45d | 1 | 0.06mi |
| 229 Atlantic Ave Hampton, VA | 2.0 | 1.0 | 1170 | $1,600 | $1.37 | 14d | 1 | 0.10mi |
| 216 S 2nd St Hampton, VA | 2.0 | 2.0 | 1429 | $2,395 | $1.68 | 23d | 1 | 0.27mi |
| 2010 E Pembroke Ave Hampton, VA | 2.0 | 1.0 | 900 | $1,150 | $1.28 | 5d | 1 | 0.32mi |
| 1805 Nickerson Blvd Hampton, VA | 3.0 | 1.5 | 1393 | $1,695 | $1.22 | 45d | 1 | 0.53mi |
| 203 N First St Unit A Hampton, VA | 2.0 | 1.5 | 1406 | $2,900 | $2.06 | 45d | 1 | 0.57mi |
| 2304 Burnette Dr Hampton, VA | 4.0 | 2.0 | 1322 | $2,100 | $1.59 | 16d | 1 | 0.61mi |
| 334 N 1st St Hampton, VA | 2.0 | 1.5 | 1200 | $2,495 | $2.08 | 16d | 1 | 0.68mi |
| 1210 Pansy St Hampton, VA | 2.0 | 2.0 | 1409 | $2,000 | $1.42 | 45d | 1 | 0.92mi |
| 2000 Neville Cir Hampton, VA | 3.0 | 1.0 | 1100 | $1,750 | $1.59 | 45d | 1 | 1.05mi |
| 1026 High Dunes Quay Hampton, VA | 3.0 | 2.0 | 1216 | $2,100 | $1.73 | 25d | 1 | 1.16mi |
| 29 Glascow Way Hampton, VA | 3.0 | 1.5 | 1382 | $2,200 | $1.59 | 16d | 1 | 1.20mi |
| 1802 Moger Dr Hampton, VA | 3.0 | 1.0 | 900 | $1,700 | $1.89 | 14d | 1 | 1.20mi |
| 949 N Mallory St Hampton, VA | 2.0 | 1.5 | 1054 | $1,250 | $1.19 | 3d | 1 | 1.21mi |
| 2001 Grimes Rd Hampton, VA | 4.0 | 2.0 | 1430 | $2,100 | $1.47 | 4d | 1 | 1.24mi |
| 244 Loch Cir Hampton, VA | 3.0 | 2.5 | 1440 | $1,850 | $1.28 | 45d | 1 | 1.28mi |
| 102 Silver Isles Blvd Hampton, VA | 3.0 | 2.0 | 1025 | $1,900 | $1.85 | 45d | 1 | 1.48mi |
HOA detail
- Monthly dues
- $60 · $720/yr
Listing history 3 events
-
2026-06-21days on market $239,900 Active 4 DOM
-
2026-06-17remarks 252-char remark
Show marketing remark (252 chars)
Welcome to Buckroe Beach VA! Enjoy living at the front door of the beaches of Hampton! 2 story, townhome with 2 master bedroom suites, 2 full and 1 half bath! New HGTV kitchen with new stainless steel appliances! Shows like new money but only $239,900.
-
2026-06-17$239,900 Active 1 DOM
Show marketing remark (252 chars)
Welcome to Buckroe Beach VA! Enjoy living at the front door of the beaches of Hampton! 2 story, townhome with 2 master bedroom suites, 2 full and 1 half bath! New HGTV kitchen with new stainless steel appliances! Shows like new money but only $239,900.
ⓘ Source: listings_history table (triggers on properties + properties_extension) + one-shot
backfill from property_details.listing_events for pre-trigger history.
Tax reassessment forecast VA · Resets to sale price
- Current annual tax
- $2,415 · $201/mo
- Projected year-2 tax
- $2,415 · $201/mo
- Expected delta
- $0/yr ($0/mo · 0.0%)
ⓘ Screening estimate from a state-policy table — verify with the county assessor before closing.
Climate risk First Street
- Flood 5/10 Major FEMA zone X (unshaded) · 51% chance over 30 yrs
- Wildfire 1/10 Low
- Heat 9/10 Extreme 7 d/yr ≥105°F today · 17 d/yr by 30 yrs out
- Wind 8/10 Severe 80% chance of damaging wind over 30 yrs
- Air quality 2/10 Low 2 unhealthy d/yr today · 2 by 30 yrs out
Nearby sold comps map
Loading sold comps map…
Walkable amenities ~0.75 mi
Loading nearby amenities…
Taxation est. · year 1
- Rental income
- $24,142
- − Mortgage interest
- −$13,438
- − Property taxes
- −$2,415
- − Insurance
- −$1,200
- − Repairs & maintenance
- −$1,931
- − Management
- −$1,931
- − HOA
- −$720
- − Depreciation
- −$6,979
- Taxable loss
- −$4,472
- Est. tax savings @ 24.0%
- +$1,073
- After-tax cash flow
- $715/yr
For passive investors: Depreciation is non-cash, so a rental often shows a tax loss while cash-flowing — sheltering income. Rental losses are passive: they offset passive income freely, and up to $25,000/yr can offset ordinary (W-2) income if you actively participate and your MAGI is under $100k (phasing out to $0 by $150k); unused losses carry forward. On sale, claimed depreciation is recaptured at up to 25%, and gains may owe capital-gains tax (a 1031 exchange can defer both). Figures are a year-1 estimate at your 24.0% rate — not tax advice; consult a CPA.
Schools (NCES district)
- District
- Hampton City Public School District
- NCES district ID
- 5101800
- Math proficiency
- 60% ▼ -21.00%
- Reading proficiency
- 70% ▼ -4.00%
- Median HH income
- $50,089
- Composite
- 55.19/100
- National rank
- #1272
- State rank
- #40 of 131 in VA
Livability — Hampton
- Score
- 75/100
- State rank
- #133
- US rank
- #4302
Category grades
Schools grade is shown separately in the Schools card above.
Census & demographics
- Census place
- Hampton, VA
- County
- Hampton City · 132,421 people
- City population
- 132,421
- Metro
- Virginia Beach-Norfolk-Newport News, VA-NC
- Population (ZIP)
- 9,643
- Household income
- $87,412
- Rent vs Own
- Severe rent burden
- 394.0
Population outlook (Hampton County) Hauer SSP2
- Today (2025)
- 134,055 people
- By 2030
- 131,753 · -1.7%
- By 2040
- 125,017 · -6.7%
- By 2050
- 116,825 · -12.9%
- By 2075
- 97,033 · -27.6%
- By 2100
- 76,188 · -43.2%
Race, ethnicity, and origin ACS 2023
- Neighborhood character
- Predominantly White (67%)
- Race & ethnicity
- White 67% Black 24% Two or more races 4% Hispanic / Latino 3%
- Common ancestry
- Slovak 2% Lithuanian 2% Italian 2%
- Foreign-born
- 3% · Canada, Guatemala
- Languages at home
- 97% English-only · Arabic 1% Spanish 1%
Political lean MEDSL · Hampton
- 2024 margin
- Solid D (+39.9) · D 69.2% · R 29.4% · Other 1.4%
- 2008→2024 swing
- +1.0pp no change · 2008: 38.9pp · 2024: 39.9pp
- All cycles
- 2024: D+39.9 2020: D+42.2 2016: D+37.8 2012: D+45.4 2008: D+38.9
Not yet ingested
- Civics
- —
Market trends
- HPI YoY
- ▼ -73.71%
- Current HPI
- 238.491
- Rent YoY
- —
- Metro
- Virginia Beach-Norfolk-Newport News, VA-NC
- State GDP YoY
- ▲ 2.40%
- F500 in state
- 50
Industry mix (Fortune 500 HQ in VA)
| Industry | F500 HQs | Revenue |
|---|---|---|
| Aerospace / Defense | 4 | $236B |
|
||
| Technology / Defense | 3 | $32B |
|
||
| Financial Services | 2 | $176B |
|
||
| Utilities | 2 | $27B |
|
||
| Insurance | 2 | $25B |
|
||
| Technology | 2 | $15B |
|
||
Price history
+313.9% since first listed5 events — show timeline
- 2026-06-17 Listed $239,900 WMLS
- 2026-06-17 Listed $239,900 REINMLS
- 2026-03-25 Sold (Public Records) $160,000 Public Records
- 1994-03-01 Sold (Public Records) $60,000 Public Records
- 1990-10-01 Sold (Public Records) $57,963 Public Records
Property tax history
+9.5%/yrLatest (2025): $2,415 · +9.5% YoY. Source: county tax records.
Cash-flow waterfall
monthlySold comps — $/sqft
last 12 mo · ≤1 miLoading sold comps…