1517 N Woodstream Rd · Irmo, SC
Flood risk 1/10 · Minimal
- FEMA flood zone
- X (unshaded)
- Chance of flooding over 30 yrs
- 0.0%
- Est. flood insurance / yr
- $507 – $1,088
Fire risk 1/10 · Minimal
- Est. fire insurance / yr
- $783 – $1,453
Heat risk 6/10 · Moderate
- Hot days now (above 108°F)
- 7 days/yr
- Hot days in 30 yrs
- 16 days/yr
Wind risk 6/10 · Moderate
- Chance of severe wind over 30 yrs
- 65.0%
Air-quality risk 3/10 · Minor
- Unhealthy air days now
- 3 days/yr
- Unhealthy air days in 30 yrs
- 3 days/yr
Risk factors via First Street. Map © Google.
Why this score? — see what drove the D grade
The composite is a weighted blend of 9 inputs, each scored 0–100. Each bar is that input's sub-score; the figure is the points it added to the 100-point composite (weight × sub-score).
- Cash flow +11.0/30.0
- ARV discount +7.5/15.0
- Appreciation +5.0/10.0
- Schools +4.5/10.0
- Livability +3.7/5.0
- DSCR +3.2/10.0
- 1% rule +2.5/10.0
- Rent growth +2.5/5.0
- Condition / age +2.5/5.0
$179,900
🖨 Deal sheet (PDF) 📄 Offer letter ✓ Due diligence
Listing remarks
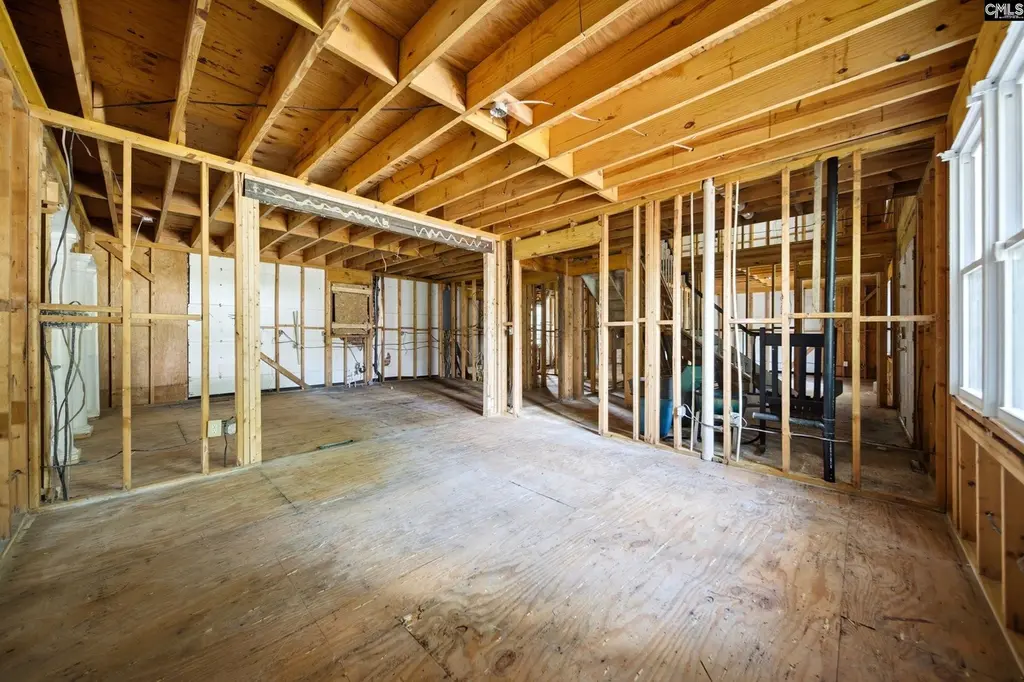
INVESTOR SPECIAL – CASH BUYERS ONLY. Rare opportunity to restore and reimagine a custom brick estate in the highly desirable Murraywood area of Columbia. Situated on a spacious lot, this property offers approximately 3,067 square feet, 4 bedrooms, 3 bathrooms, multiple living spaces, and distinctive architectural features including grand front columns, soaring ceilings, dramatic entry, and strong curb appeal. Significant interior demolition and remediation work have already been completed, providing a head start for the next owner. Structural engineering report available. Property is being sold strictly AS-IS. Ideal for investors, builders, rehab specialists, or buyers seeking a uniqu
Key facts
- Dramatic entry
- Strong curb appeal
- Soaring ceilings
Tags
Property features AI
Exterior
- Parking: Two-car attached side-entry garage; Four parking spaces total
- Utilities: Public sewer
- Home design: Two-story home
- Construction: Crawlspace foundation
- Exterior features: Brick exterior above the foundation; Paved road access; Public water
Interior
- Bedrooms: Master suite on the second floor
- Bathrooms: Three full bathrooms total; One full bathroom on the lower level; Two full main-level bathrooms
- Heating & cooling: Central heating; Central air conditioning
- Interior features: Basement; One fireplace
Neighborhood map
What this means for you Summary
Snapshot
- This is a 4-bed/3.0-bath single-family listed at $180k.
Deal economics
- At list price, monthly cash flow is $-75 ($-903/yr) — negative.
- To cash-flow at today's rent, offer at most $167k (7.4% below list).
- To meet the 1% rule (rent ≥ 1% of price), the offer needs to be $135k (25.0% below list).
- Recommended offer: $135k (25.0% below list) — sets the bar for 1% rule.
Location & tenants
- Location reads 73/100 on livability (#38 in SC) — a middle-class / working-renter tenant base. Strengths: cost of living A+, housing A+, employment B; Watch: amenities F, commute F.
- Lexington 05 (suburban): math 47% / reading 55% proficiency, ranked #5 of 80 in SC (top 6%) — acceptable for families but not a draw, mixed tenant base, ~2y average lease.
- Zoned schools: Nursery Road Elementary (math 39% / reading 42%, grade F, #286 of 597 statewide, top 49%, 450 students, 100% FRL); Irmo Middle (math 30% / reading 38%, grade F, #110 of 229 statewide, top 49%, 1,011 students, 100% FRL); Irmo High (math 27% / reading 82%, grade C-, #130 of 196 statewide, top 69%, 1,307 students, 100% FRL) — zoned schools average 100% FRL vs 27% district-wide (73 pts higher); higher-poverty schools than district average — tighter screening recommended.
- Market conditions: 1 active listings in the ZIP; 1,712 units permitted in Lexington County in 2024 (0 in 5+ unit buildings).
Forward outlook
- In year one you build about $7k of equity ($1k loan paydown + $5k appreciation (3.0% local appreciation)).
- Lexington County population projected at +26% by 2050 — long-run rental-demand tailwind backs the buy-and-hold thesis.
- At projected returns (3.0% appreciation + 3.0% rent growth), your $50k cash investment doubles in ~7 years — after that, you're playing with house money.
- By year 6, paydown + projected appreciation supports a ~$35k cash-out refi (75% LTV) — recoverable capital for the next deal without selling this one.
Negotiation context
- Only 6 days on market — expect competitive offers; lowballing is unlikely to land.
- 3 sale attempts since 7y ago with the ask held roughly flat each time — persistent listings suggest the price (not the market) is what's stuck; bring a comps-based counter.
Risks & watch-outs
- Climate carrying-cost: major wind risk, 65% chance of damaging wind over 30y; extreme-heat days projected 7→16/yr by 2055 (HVAC capex compounding) — expect insurance premiums to compound above CPI over the hold.
Questions for the listing agent
- What do current leases actually rent for vs. the listed asking? Can we see a recent rent roll and the last 12 months of T-12 income?
- Built in 1976 — when were the roof, HVAC, electrical panel, plumbing, and water heater last replaced?
- Is there a deadline driving the sale (1031 exchange, divorce, estate, relocation)? That informs how much negotiation room exists.
- Schools are B-rated — typically a magnet for longer-tenancy family renters. What's the average tenant stay here, and is there a school-zone premium baked into asking?
- The area grade is low — what's the realistic commute time and amenity access for the typical tenant pool here? Any planned neighborhood developments (good or bad) we should know about?
- What's the average days-on-market for RENTAL listings here right now (not sales)? A rising rental-DOM trend means longer vacancies and softer asking-rent achievability than the comps imply.
- What's the recent tenant-quality profile in this submarket — average credit score on applications, eviction rate, late-payment / NSF rate, and stable-employment percentage? A property-management company in the area should have these aggregated.
- How much new for-sale + rental construction is in the pipeline within 1–3 miles? Heavy new supply typically softens prices + rents 12–24 months out; constrained supply supports both.
Investment metrics
- 1% rule
- 0.75% ✗
- Cap rate
- 5.79%
- Cash-on-cash
- -1.79%
- DSCR
- 0.92
- GRM
- 11.1
CMA / ARV
No comps found within radius.
Projected returns pro-forma
3.0% appreciation · 3.0% rent growth · sell at horizon
- IRR
- 5.8%
- Equity multiple
- 1.33×
- Total profit
- $16,839
- Equity at exit
- $80,891
- IRR
- 8.8%
- Equity multiple
- 2.32×
- Total profit
- $66,628
- Equity at exit
- $124,662
Cash invested: $50,372 (down + closing). Projections, not guarantees.
Landlord ↔ Tenant lean methodology
- Overall (STATE)
- 90 Strongly Landlord-Friendly
- State South Carolina
- 90 Strongly Landlord-Friendly · R+6
- County
- — inherits STATE
- City
- — inherits STATE
ZIP-level market 29212-1130
- Active inventory
- 1
- Price-to-rent
- 11.1×
Monthly cashflow live
- Estimated rent
- $1,349 medium interval (Pro) →
- Mortgage (P&I)
- −$943
- Tax from tax record
- −$123 /mo · $1,471/yr
- Insurance
- −$75
- HOA
- −$0
- Vacancy / Maint / Mgmt
- −$283
- Net cashflow
- $-75
Break-even live
Sensitivity live
| Price | -10% $27 | -5% $-24 | +0% $-75 | +5% $-126 | +10% $-177 |
|---|---|---|---|---|---|
| Rent | -10% $-182 | -5% $-128 | +0% $-75 | +5% $-22 | +10% $31 |
| Rate | -1.0pp $15 | -0.5pp $-29 | base $-75 | +0.5pp $-122 | +1.0pp $-169 |
UW: 25.0% down · 7.5% · 30yr · 1.5% tax · 5.0% vac · 8.0% maint · 8.0% mgmt
Financing live
Cash to close
- Down payment
- $44,975
- Closing costs
- $5,397
- Reserves months
- —
- Total cash needed
- —
Loan-product check · same deal, 3 products live
Conventional
25% down · 7.5% · 30yr
- Down + closing
- —
- Monthly P&I
- —
- Monthly cashflow
- —
- DSCR
- —
- Eligible?
- —
Personal DTI + credit; lowest rate.
DSCR
20% down · 8.5% · 30yr
- Down + closing
- —
- Monthly P&I
- —
- Monthly cashflow
- —
- DSCR
- —
- Eligible?
- —
No personal income docs; deal must DSCR.
Hard money
10% down · 12.0% · 12mo
- Down + closing
- —
- Monthly P&I
- —
- Monthly cashflow
- —
- DSCR
- —
- Eligible?
- —
Short-term bridge; refi at stabilization.
Listing history 7 events
-
2026-06-19status $179,900 Pending 6 DOM
-
2026-06-18days on market $179,900 Active 6 DOM
-
2026-06-17days on market $179,900 Active 5 DOM
-
2026-06-16days on market $179,900 Active 4 DOM
-
2026-06-15days on market $179,900 Active 3 DOM
-
2026-06-13remarks 693-char remark
-
2026-06-13$179,900 Active 1 DOM
ⓘ Source: listings_history table (triggers on properties + properties_extension) + one-shot
backfill from property_details.listing_events for pre-trigger history.
Tax reassessment forecast SC · Resets to sale price
- Current annual tax
- $1,471 · $123/mo
- Projected year-2 tax
- $1,471 · $123/mo
- Expected delta
- $0/yr ($0/mo · 0.0%)
ⓘ Screening estimate from a state-policy table — verify with the county assessor before closing.
Climate risk First Street
- Flood 1/10 Low FEMA zone X (unshaded) · 0% chance over 30 yrs
- Wildfire 1/10 Low
- Heat 6/10 Major 7 d/yr ≥108°F today · 16 d/yr by 30 yrs out
- Wind 6/10 Major 65% chance of damaging wind over 30 yrs
- Air quality 3/10 Moderate 3 unhealthy d/yr today · 3 by 30 yrs out
Nearby sold comps map
Loading sold comps map…
Walkable amenities ~0.75 mi
Loading nearby amenities…
Taxation est. · year 1
- Rental income
- $16,188
- − Mortgage interest
- −$10,077
- − Property taxes
- −$1,471
- − Insurance
- −$900
- − Repairs & maintenance
- −$1,295
- − Management
- −$1,295
- − Depreciation
- −$5,233
- Taxable loss
- −$4,083
- Est. tax savings @ 24.0%
- +$980
- After-tax cash flow
- $77/yr
For passive investors: Depreciation is non-cash, so a rental often shows a tax loss while cash-flowing — sheltering income. Rental losses are passive: they offset passive income freely, and up to $25,000/yr can offset ordinary (W-2) income if you actively participate and your MAGI is under $100k (phasing out to $0 by $150k); unused losses carry forward. On sale, claimed depreciation is recaptured at up to 25%, and gains may owe capital-gains tax (a 1031 exchange can defer both). Figures are a year-1 estimate at your 24.0% rate — not tax advice; consult a CPA.
Schools (NCES district)
- District
- Lexington 05
- NCES district ID
- 4502820
- Math proficiency
- 47% ▼ -7.00%
- Reading proficiency
- 55% ▼ -4.00%
- Median HH income
- $67,732
- Composite
- 45.28/100
- National rank
- #2656
- State rank
- #5 of 80 in SC
Livability — Irmo
- Score
- 73/100
- State rank
- #38
- US rank
- #5024
Category grades
Schools grade is shown separately in the Schools card above.
Census & demographics
No demographic data for this ZIP.
Market trends
- HPI YoY
- —
- Current HPI
- —
- Rent YoY
- —
- Metro
- —
- State GDP YoY
- ▲ 4.51%
- F500 in state
- 2
Industry mix (Fortune 500 HQ in SC)
| Industry | F500 HQs | Revenue |
|---|---|---|
| Packaging | 1 | $7B |
|
||
Price history
+25.8% since first listed13 events — show timeline
- 2026-06-12 Listed $179,900 Consolidated MLS
- 2020-05-06 Sold (Public Records) $235,000 Public Records
- 2020-03-05 Delisted — Consolidated MLS
- 2020-02-25 Price Changed $234,900 Consolidated MLS
- 2020-02-12 Listed $239,900 Consolidated MLS
- 2019-05-13 Delisted — Consolidated MLS
- 2019-04-30 Listed $114,900 Consolidated MLS
- 2017-10-27 Price Changed $99,900 Consolidated MLS
- 2017-09-20 Price Changed $104,500 Consolidated MLS
- 2017-08-22 Price Changed $119,900 Consolidated MLS
- 2017-07-21 Price Changed $129,900 Consolidated MLS
- 2017-06-20 Price Changed $149,900 Consolidated MLS
- 2000-08-03 Sold (Public Records) $143,034 Public Records
Property tax history
-9.1%/yrLatest (2022): $1,471 · +1.4% YoY. Source: county tax records.
Cash-flow waterfall
monthlySold comps — $/sqft
last 12 mo · ≤1 miLoading sold comps…