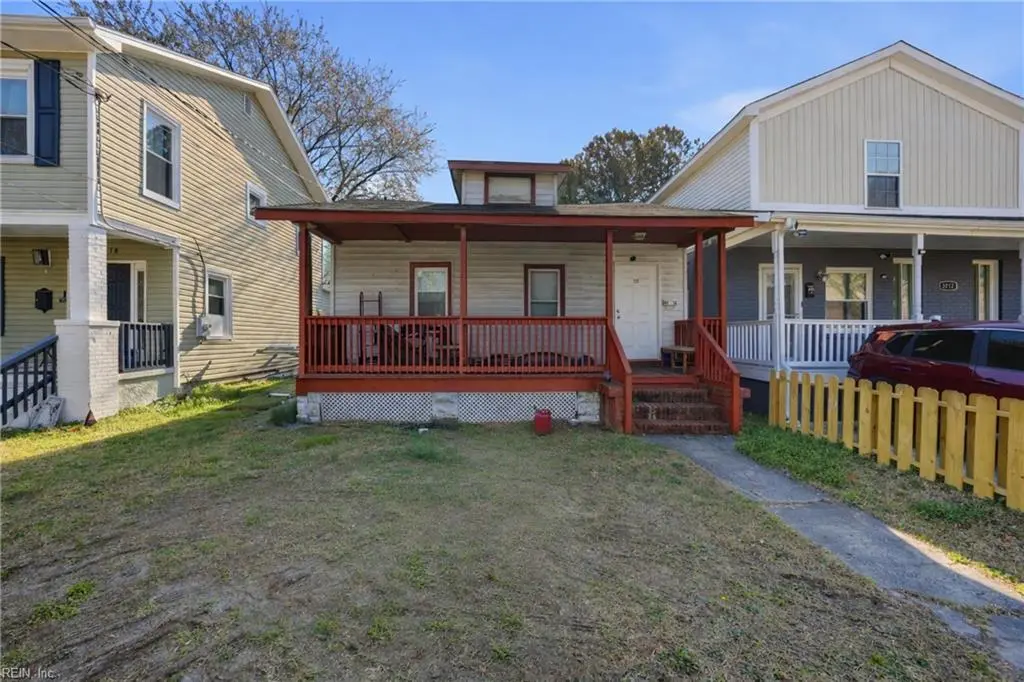
3214 Lens Ave · Norfolk, VA
Flood risk 4/10 · Minor
- FEMA flood zone
- X (unshaded)
- Chance of flooding over 30 yrs
- 0.13%
- Est. flood insurance / yr
- $507 – $1,088
Fire risk 1/10 · Minimal
- Est. fire insurance / yr
- $666 – $1,236
Heat risk 9/10 · Severe
- Hot days now (above 105°F)
- 7 days/yr
- Hot days in 30 yrs
- 16 days/yr
Wind risk 8/10 · Major
- Chance of severe wind over 30 yrs
- 80.0%
Air-quality risk 3/10 · Minor
- Unhealthy air days now
- 2 days/yr
- Unhealthy air days in 30 yrs
- 5 days/yr
Risk factors via First Street. Map © Google.
Why this score? — see what drove the C- grade
The composite is a weighted blend of 9 inputs, each scored 0–100. Each bar is that input's sub-score; the figure is the points it added to the 100-point composite (weight × sub-score).
- Cash flow +15.4/30.0
- ARV discount +11.9/15.0
- Rent growth +5.0/5.0
- DSCR +4.7/10.0
- Livability +4.2/5.0
- 1% rule +3.7/10.0
- Schools +3.5/10.0
- Appreciation +2.9/10.0
- Condition / age +2.5/5.0
$230,000
🖨 Deal sheet 📄 Offer letter ✓ Due diligence
Key facts
- 3,049 sq ft lot
- Built 1912
- Listed 87 days
Neighborhood map
What this means for you Summary
Snapshot
- This is a 3-bed/2.0-bath single-family listed at $230k.
Deal economics
- At list price, monthly cash flow is $89 ($1k/yr) — positive.
- The deal already cash-flows at list — no discount required.
- To meet the 1% rule (rent ≥ 1% of price), the offer needs to be $200k (13.0% below list).
- Recommended offer: $200k (13.0% below list) — sets the bar for 1% rule.
- Cap rate 6.8% vs local median 4.0% in Norfolk — top-decile yield for the area; either an underpriced asset or a hidden risk that comps aren't pricing in. Stress-test before assuming the spread holds.
Location & tenants
- Location reads 83/100 on livability (#43 in VA, #1,026 nationally) — a professional / high-income tenant draw. Strengths: amenities A+, commute A+, health & safety A+; Watch: employment C-, crime F.
- Norfolk City Public School District (urban): math 27% / reading 56% proficiency, ranked #118 of 131 in VA (top 90%) — families likely to look elsewhere, expect single-tenant / working-renter base with shorter leases.
- Market conditions: Rents rising fast (+14.0%/yr); 77 active listings in the ZIP; 40 comparable units currently listed for rent nearby; rentals at typical pace (median 24d on market — plan ~3-4 weeks tenant-placement turnaround); 45% of comp listings sitting > 30 days — soft ceiling on asking rent; 438 units permitted in Norfolk city in 2024 (273 in 5+ unit buildings).
- This rent runs 33% of the median local income ($73k/yr) — at the standard rent-burdened threshold; future hikes will face affordability resistance.
Forward outlook
- Local home prices are declining (-3.0%/yr); year-one equity from $2k of loan paydown is wiped out by about $7k of value loss. Plan a longer hold.
Negotiation context
- It's been on market 87 days — a 6% lower offer ($216k) is reasonable based on typical stale-listing flexibility.
- 3 sale attempts since 8y ago with the ask held roughly flat each time — persistent listings suggest the price (not the market) is what's stuck; bring a comps-based counter.
- Current owner paid $175k; 31% above their basis — modest negotiation headroom, anchor on the comps not their cost.
Risks & watch-outs
- Watch-outs: built in 1912 — expect roof / HVAC / electrical / plumbing capex.
- Climate carrying-cost: severe wind risk, 80% chance of damaging wind over 30y; extreme-heat days projected 7→16/yr by 2055 (HVAC capex compounding) — expect insurance premiums to compound above CPI over the hold.
Questions for the listing agent
- It's been on market 87 days. Have you received any prior offers? Is the seller open to a 13% concession, seller financing, or rate buy-down credit?
- Built in 1912 — when were the roof, HVAC, electrical panel, plumbing, and water heater last replaced?
- Why hasn't it sold? Are there any deal-killer items the seller is aware of (foundation, flood, title, zoning, code violations)?
- Is there a deadline driving the sale (1031 exchange, divorce, estate, relocation)? That informs how much negotiation room exists.
- Schools are A-rated — typically a magnet for longer-tenancy family renters. What's the average tenant stay here, and is there a school-zone premium baked into asking?
- Crime grade is F in this area — have there been break-ins, vandalism, or insurance claims at this property in the last 3 years? What carrier currently insures it and at what premium?
- What's the average days-on-market for RENTAL listings here right now (not sales)? A rising rental-DOM trend means longer vacancies and softer asking-rent achievability than the comps imply.
- What's the recent tenant-quality profile in this submarket — average credit score on applications, eviction rate, late-payment / NSF rate, and stable-employment percentage? A property-management company in the area should have these aggregated.
- How much new for-sale + rental construction is in the pipeline within 1–3 miles? Heavy new supply typically softens prices + rents 12–24 months out; constrained supply supports both.
Investment metrics
- 1% rule
- 0.87% ✗
- Cap rate
- 6.76%
- Cash-on-cash
- 1.67%
- DSCR
- 1.07
- GRM
- 9.6
CMA / ARV
- ARV (median comp)
- $255,145
- List price
- $230,000
- Delta
- -9.86%
- Verdict
- FAIR
- Comps
- 20 within 1.0 mi
Show comp detail 12 sales within ~0.75 mi
| Address | Dist | Beds/Ba | Sqft | Sold | Price | $/sf | Match |
|---|---|---|---|---|---|---|---|
| 2946 Argonne Ave | 0.24mi | 3/1.5 | 1,080 (-2%) | 3mo | $265,000 | $245 | 81 |
| 3220 Lens Ave | 0.01mi | 3/1.0 | 1,254 (+14%) | 0mo | $257,000 | $205 | 72 |
| 3105 Marne Ave | 0.17mi | 3/1.0 | 1,218 (+11%) | 2mo | $270,000 | $222 | 68 |
| 2719 Overbrook Ave | 0.69mi | 3/2.0 | 1,100 (+0%) | 2mo | $290,000 | $264 | 66 |
| 2949 Verdun Ave | 0.23mi | 3/2.0 | 950 (-14%) | 4mo | $230,500 | $243 | 64 |
| 3317 Vimy Ridge Ave | 0.37mi | 3/1.0 | 1,000 (-9%) | 2mo | $250,000 | $250 | 62 |
| 2541 Grandy Ave | 0.70mi | 2/1.5 (-1) | 1,077 (-2%) | 3mo | $247,000 | $229 | 54 |
| 2814 Glen Ave | 0.72mi | 3/1.0 | 1,056 (-4%) | 4mo | $196,000 | $186 | 53 |
| 2609 Harrell Ave | 0.62mi | 3/1.5 | 1,194 (+9%) | 3mo | $269,900 | $226 | 52 |
| 2211 Abbey Rd | 0.47mi | 3/1.0 | 1,223 (+11%) | 3mo | $200,000 | $164 | 52 |
| 2534 Keller Ave | 0.69mi | 3/2.0 | 1,200 (+9%) | 1mo | $290,000 | $242 | 52 |
| 3305 Dunkirk Ave | 0.30mi | 2/1.0 (-1) | 937 (-15%) | 2mo | $165,000 | $176 | 51 |
Match score weights: distance 35% · size 25% · config 20% · recency 20%. Top-matched comps best support the ARV.
Projected returns pro-forma
-3.0% appreciation · 8.0% rent growth · sell at horizon
- IRR
- -8.5%
- Equity multiple
- 0.67×
- Total profit
- $-21,028
- Equity at exit
- $34,294
- IRR
- 6.4%
- Equity multiple
- 1.58×
- Total profit
- $37,046
- Equity at exit
- $19,886
Cash invested: $64,400 (down + closing). Projections, not guarantees.
Landlord ↔ Tenant lean methodology
- Overall (STATE)
- 55 Moderately Landlord-Leaning
- State Virginia
- 55 Moderately Landlord-Leaning · D+2
- County
- — inherits STATE
- City
- — inherits STATE
ZIP-level market 23509
- Home prices YoY
- -1.3%
- Rents YoY
- 14.0%
- Active inventory
- 77
- Price-to-rent
- 9.6×
Monthly cashflow live
- Estimated rent
- $2,002 high interval (Pro) →
- Mortgage (P&I)
- −$1,206
- Tax from tax record
- −$190 /mo · $2,279/yr
- Insurance
- −$96
- HOA
- −$0
- Vacancy / Maint / Mgmt
- −$420
- Net cashflow
- $89
Break-even live
UW: 25.0% down · 7.5% · 30yr · 1.5% tax · 5.0% vac · 8.0% maint · 8.0% mgmt
Financing live
Cash to close
- Down payment
- $57,500
- Closing costs
- $6,900
- Reserves months
- —
- Total cash needed
- —
Loan-product check · same deal, 3 products live
Conventional
25% down · 7.5% · 30yr
- Down + closing
- —
- Monthly P&I
- —
- Monthly cashflow
- —
- DSCR
- —
- Eligible?
- —
Personal DTI + credit; lowest rate.
DSCR
20% down · 8.5% · 30yr
- Down + closing
- —
- Monthly P&I
- —
- Monthly cashflow
- —
- DSCR
- —
- Eligible?
- —
No personal income docs; deal must DSCR.
Hard money
10% down · 12.0% · 12mo
- Down + closing
- —
- Monthly P&I
- —
- Monthly cashflow
- —
- DSCR
- —
- Eligible?
- —
Short-term bridge; refi at stabilization.
Rent comps 40 comps
| Address | Beds | Baths | Sqft | Rent | $/sqft | DOM | Units | Dist |
|---|---|---|---|---|---|---|---|---|
| 2405 Lafayette Blvd Unit A Norfolk, VA | 3.0 | 2.0 | 1000 | $2,200 | $2.20 | 14d | 1 | 0.18mi |
| 2949 Verdun Ave Norfolk, VA | 3.0 | 2.0 | 950 | $3,000 | $3.16 | 44d | 1 | 0.26mi |
| 2201 Pershing Ave Norfolk, VA | 3.0 | 2.5 | 1455 | $2,250 | $1.55 | 4d | 1 | 0.26mi |
| 3301 Vimy Ridge Ave Norfolk, VA | 4.0 | 2.0 | 1300 | $2,150 | $1.65 | 4d | 1 | 0.33mi |
| 2111 Bellevue Ave Unit 1 Norfolk, VA | 2.0 | 1.0 | 950 | $1,300 | $1.37 | 44d | 1 | 0.34mi |
| 3400 Lafayette Blvd #2 Norfolk, VA | 2.0 | 1.0 | 800 | $1,350 | $1.69 | 3d | 1 | 0.34mi |
| 3521 Brest Ave Norfolk, VA | 3.0 | 2.0 | 1234 | $2,300 | $1.86 | 44d | 1 | 0.34mi |
| 2815 Keller Ave Norfolk, VA | 3.0 | 2.0 | 1210 | $2,250 | $1.86 | 4d | 1 | 0.38mi |
| 2900 Verdun Ave Norfolk, VA | 3.0 | 1.0 | 867 | $1,800 | $2.08 | 44d | 1 | 0.39mi |
| 3640 Robin Hood Rd Norfolk, VA | 4.0 | 2.5 | 1400 | $2,999 | $2.14 | 17d | 1 | 0.47mi |
| 1801 Lasalle Ave Norfolk, VA | 3.0 | 1.0 | 1102 | $1,880 | $1.71 | 44d | 1 | 0.47mi |
| 2928 Tidewater Dr Norfolk, VA | 2.0 | 1.0 | 740 | $1,350 | $1.82 | 23d | 1 | 0.50mi |
| 1822 Saint Denis Ave Apt 4 Norfolk, VA | 2.0 | 1.0 | 750 | $995 | $1.33 | 44d | 1 | 0.50mi |
| 2721 Grandy Ave Norfolk, VA | 2.0 | 1.0 | 900 | $1,150 | $1.28 | 23d | 1 | 0.51mi |
| 1751 Fontainebleau Cres Norfolk, VA | 3.0 | 2.0 | 1231 | $2,350 | $1.91 | 44d | 1 | 0.53mi |
| 1714 Bellevue Ave Norfolk, VA | 3.0 | 1.5 | 1500 | $1,799 | $1.20 | 44d | 1 | 0.53mi |
| 1801 Saint Denis Ave Unit 3 Norfolk, VA | 4.0 | 2.0 | 1500 | $2,400 | $1.60 | 23d | 1 | 0.57mi |
| 1607 Lasalle Ave Unit 3 Norfolk, VA | 2.0 | 1.0 | 816 | $1,400 | $1.72 | 44d | 1 | 0.65mi |
| 5404 Douglas St Norfolk, VA | 3.0 | 1.0 | 981 | $1,950 | $1.99 | 44d | 1 | 0.65mi |
| 2660 Chesapeake Blvd Norfolk, VA | 3.0 | 2.0 | 1375 | $2,100 | $1.53 | 17d | 1 | 0.65mi |
| 1439 Moultrie Ave #3 Norfolk, VA | 2.0 | 1.0 | 1300 | $1,900 | $1.46 | 7d | 1 | 0.66mi |
| 3801 Chatham Cir Unit 2 Norfolk, VA | 2.0 | 1.0 | 1100 | $1,350 | $1.23 | 7d | 1 | 0.79mi |
| 3477 E Bonner Dr Norfolk, VA | 3.0 | 1.0 | 1304 | $2,000 | $1.53 | 23d | 1 | 0.80mi |
| 3872 Wake Cir Unit A Norfolk, VA | 2.0 | 1.0 | 750 | $1,395 | $1.86 | 44d | 1 | 0.88mi |
| 3872 Wake Cir Unit A Norfolk, VA | 2.0 | 1.0 | 750 | $1,395 | $1.86 | 3d | 1 | 0.88mi |
| 2421 Arkansas Ave Unit A Norfolk, VA | 2.0 | 1.0 | 870 | $1,225 | $1.41 | 14d | 1 | 0.91mi |
| 4566 Hampshire Ave Unit A Norfolk, VA | 2.0 | 1.0 | 870 | $1,350 | $1.55 | 44d | 1 | 0.92mi |
| 2400 Ballentine Blvd Unit A Norfolk, VA | 2.0 | 1.0 | 879 | $1,550 | $1.76 | 44d | 1 | 0.93mi |
| 2421 Bolton St Unit F Norfolk, VA | 2.0 | 1.0 | 725 | $1,275 | $1.76 | 44d | 1 | 1.03mi |
| 3507 Cape Henry Ave Unit A Norfolk, VA | 2.0 | 1.0 | 755 | $1,200 | $1.59 | 21d | 1 | 1.05mi |
| 3819 Pamlico Cir Norfolk, VA | 3.0 | 1.0 | 1250 | $2,000 | $1.60 | 12d | 1 | 1.05mi |
| 6115 Tidewater Dr Norfolk, VA | 1.0–2.0 | 1.0–2.0 | 956 | $2,274 | $2.38 | 2d | 8 | 1.10mi |
| 3820 Essex Cir Unit A Norfolk, VA | 2.0 | 1.0 | 1000 | $2,200 | $2.20 | 21d | 1 | 1.11mi |
| 3820 Essex Cir #1 Norfolk, VA | 2.0 | 1.0 | 1000 | $2,250 | $2.25 | 17d | 1 | 1.11mi |
| 3820 Essex Cir Unit B 1 Norfolk, VA | 2.0 | 1.0 | 900 | $1,700 | $1.89 | 21d | 1 | 1.11mi |
| 2315 Bolton St Norfolk, VA | 3.0 | 1.0 | 1000 | $1,800 | $1.80 | 44d | 1 | 1.12mi |
| 1525 Nevada Ave Unit B Norfolk, VA | 2.0 | 1.5 | 1134 | $1,445 | $1.27 | 44d | 1 | 1.13mi |
| 2804 Waverly Way Norfolk, VA | 2.0 | 1.0 | 850 | $1,270 | $1.49 | 44d | 5 | 1.14mi |
| 2401 Ruffin St Norfolk, VA | 2.0 | 1.0 | 900 | $1,350 | $1.50 | 44d | 1 | 1.14mi |
| 912 Druid Cir Unit B Norfolk, VA | 2.0 | 1.0 | 960 | $1,535 | $1.60 | 23d | 1 | 1.16mi |
Listing history 22 events
-
2026-06-18days on market $230,000 Active 87 DOM
-
2026-06-17days on market $230,000 Active 86 DOM
-
2026-06-16days on market $230,000 Active 85 DOM
-
2026-06-15days on market $230,000 Active 84 DOM
-
2026-06-13days on market $230,000 Active 82 DOM
-
2026-06-09days on market $230,000 Active 78 DOM
-
2026-06-08days on market $230,000 Active 77 DOM
-
2026-06-07days on market $230,000 Active 76 DOM
-
2026-06-03days on market $230,000 Active 72 DOM
-
2026-06-02days on market $230,000 Active 71 DOM
-
2026-06-01days on market $230,000 Active 70 DOM
-
2026-05-31days on market $230,000 Active 69 DOM
-
2026-03-23$230,000 Active
-
2022-12-28soldstatus $175,000
-
2022-12-09status Under Contract
-
2022-11-28$175,000 Active
-
2018-12-31status Under Contract
-
2018-12-21price $55,000
-
2018-12-04price $62,900
-
2018-11-20price $69,300
-
2018-10-31$79,500 Active
-
2003-07-24soldstatus $48,000
ⓘ Source: listings_history table (triggers on properties + properties_extension) + one-shot
backfill from property_details.listing_events for pre-trigger history.
Tax reassessment forecast VA · Resets to sale price
- Current annual tax
- $2,279 · $190/mo
- Projected year-2 tax
- $2,279 · $190/mo
- Expected delta
- $0/yr ($0/mo · 0.0%)
ⓘ Screening estimate from a state-policy table — verify with the county assessor before closing.
Climate risk First Street
- Flood 4/10 Moderate FEMA zone X (unshaded) · 13% chance over 30 yrs
- Wildfire 1/10 Low
- Heat 9/10 Extreme 7 d/yr ≥105°F today · 16 d/yr by 30 yrs out
- Wind 8/10 Severe 80% chance of damaging wind over 30 yrs
- Air quality 3/10 Moderate 2 unhealthy d/yr today · 5 by 30 yrs out
Nearby sold comps map
Loading sold comps map…
Walkable amenities ~0.75 mi
Loading nearby amenities…
Taxation est. · year 1
- Rental income
- $24,020
- − Mortgage interest
- −$12,884
- − Property taxes
- −$2,279
- − Insurance
- −$1,150
- − Repairs & maintenance
- −$1,922
- − Management
- −$1,922
- − Depreciation
- −$6,691
- Taxable loss
- −$2,827
- Est. tax savings @ 24.0%
- +$678
- After-tax cash flow
- $1,751/yr
For passive investors: Depreciation is non-cash, so a rental often shows a tax loss while cash-flowing — sheltering income. Rental losses are passive: they offset passive income freely, and up to $25,000/yr can offset ordinary (W-2) income if you actively participate and your MAGI is under $100k (phasing out to $0 by $150k); unused losses carry forward. On sale, claimed depreciation is recaptured at up to 25%, and gains may owe capital-gains tax (a 1031 exchange can defer both). Figures are a year-1 estimate at your 24.0% rate — not tax advice; consult a CPA.
Schools (NCES district)
- District
- Norfolk City Public School District
- NCES district ID
- 5102670
- Math proficiency
- 27% ▼ -44.00%
- Reading proficiency
- 56% ▼ -10.00%
- Median HH income
- $44,358
- Composite
- 35.08/100
- National rank
- #5026
- State rank
- #118 of 131 in VA
Livability — Norfolk
- Score
- 83/100
- State rank
- #43
- US rank
- #1026
Category grades
Schools grade is shown separately in the Schools card above.
Census & demographics
- Census place
- Norfolk, VA
- County
- Norfolk City · 214,042 people
- City population
- 214,042
- Metro
- Virginia Beach-Norfolk-Newport News, VA-NC
- Population (ZIP)
- 13,105
- Household income
- $72,816
- Rent vs Own
- Severe rent burden
- 575.0
Population outlook (Norfolk County) Hauer SSP2
- Today (2025)
- 249,032 people
- By 2030
- 252,347 · +1.3%
- By 2040
- 253,644 · +1.9%
- By 2050
- 251,913 · +1.2%
- By 2075
- 245,281 · -1.5%
- By 2100
- 219,548 · -11.8%
Race, ethnicity, and origin ACS 2023
- Neighborhood character
- Diverse neighborhood (Simpson 0.64)
- Race & ethnicity
- White 44% Black 39% Hispanic / Latino 9% Two or more races 8% Asian 2%
- Hispanic origin (detail)
- Mexican 2% Puerto Rican 2%
- Common ancestry
- Italian 4% Serbian 2% Romanian 1%
- Foreign-born
- 6% · Canada, China
- Languages at home
- 91% English-only · Spanish 5% Other Asian/Pacific 1%
Political lean MEDSL · Norfolk
- 2024 margin
- Solid D (+41.5) · D 70.0% · R 28.5% · Other 1.6%
- 2008→2024 swing
- -1.4pp toward R · 2008: 43.0pp · 2024: 41.5pp
- All cycles
- 2024: D+41.5 2020: D+45.6 2016: D+42.0 2012: D+44.0 2008: D+43.0
Not yet ingested
- Civics
- —
Market trends
- HPI YoY
- ▼ -4.16%
- Current HPI
- 321.56
- Rent YoY
- ▲ 13.99%
- Metro
- Virginia Beach-Norfolk-Newport News, VA-NC
- State GDP YoY
- ▲ 2.40%
- F500 in state
- 50
Industry mix (Fortune 500 HQ in VA)
| Industry | F500 HQs | Revenue |
|---|---|---|
| Aerospace / Defense | 4 | $236B |
|
||
| Technology / Defense | 3 | $32B |
|
||
| Financial Services | 2 | $176B |
|
||
| Utilities | 2 | $27B |
|
||
| Insurance | 2 | $25B |
|
||
| Technology | 2 | $15B |
|
||
Price history
+379.2% since first listed10 events — show timeline
- 2026-03-23 Listed $230,000 REINMLS
- 2022-12-28 Sold (Public Records) $175,000 Public Records
- 2022-12-09 Pending — REINMLS
- 2022-11-28 Listed $175,000 REINMLS
- 2018-12-31 Pending — REINMLS
- 2018-12-21 Price Changed $55,000 REINMLS
- 2018-12-04 Price Changed $62,900 REINMLS
- 2018-11-20 Price Changed $69,300 REINMLS
- 2018-10-31 Listed $79,500 REINMLS
- 2003-07-24 Sold (Public Records) $48,000 Public Records
Property tax history
+7.2%/yrLatest (2025): $2,279 · +0.4% YoY. Source: county tax records.
Cash-flow waterfall
monthlySold comps — $/sqft
last 12 mo · ≤1 miLoading sold comps…