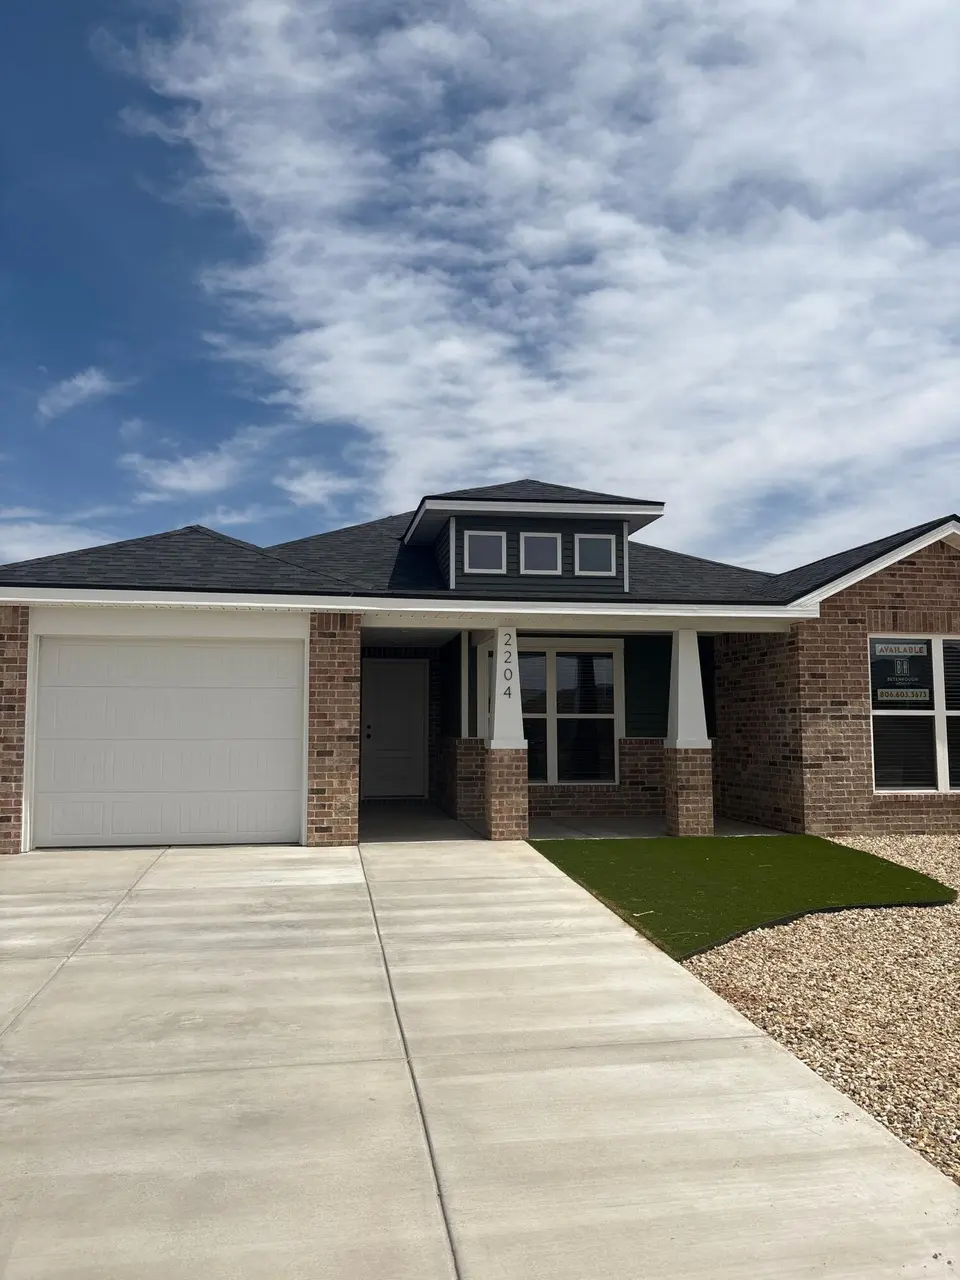
 🏗️ New Construction
5703 Colgate St · Lubbock, TX
Flood risk 1/10 · Minimal
- FEMA flood zone
- X (unshaded)
- Chance of flooding over 30 yrs
- 0.0%
- Est. flood insurance / yr
- $507 – $1,088
Fire risk 2/10 · Minimal
- Est. fire insurance / yr
- $1,222 – $2,270
Heat risk 5/10 · Moderate
- Hot days now (above 99°F)
- 7 days/yr
- Hot days in 30 yrs
- 21 days/yr
Wind risk 2/10 · Minimal
- Chance of severe wind over 30 yrs
- —
Air-quality risk 2/10 · Minimal
- Unhealthy air days now
- 1 days/yr
- Unhealthy air days in 30 yrs
- 1 days/yr
Risk factors via First Street. Map © Google.
Why this score? — see what drove the C+ grade
The composite is a weighted blend of 9 inputs, each scored 0–100. Each bar is that input's sub-score; the figure is the points it added to the 100-point composite (weight × sub-score).
- Cash flow +26.4/30.0
- DSCR +9.0/10.0
- ARV discount +7.5/15.0
- 1% rule +7.1/10.0
- Condition / age +4.8/5.0
- Livability +4.0/5.0
- Rent growth +3.1/5.0
- Schools +3.1/10.0
- Appreciation +0.0/10.0
$224,990
🖨 Deal sheet 📄 Offer letter ✓ Due diligence
Multi-family units
County records classify this as Multi-Family (5+ Unit). Listing-text estimate: 1 unit. estimate disagrees with records
5+ unit building — per-unit beds/baths from public records are typically unavailable; the breakdown below (if shown) is an estimate from the listing text.
Listing remarks
Be the first to call this brand new 3 bedroom, 2 bathroom home with a 1 car garage your own. Featuring charming modern construction and a thoughtfully designed open-concept layout, this home offers a bright and inviting space for everyday living and entertaining. Located in a growing area just minutes from Texas Tech, the medical district, shopping, and dining, you'll enjoy both convenience and a fresh, new neighborhood feel. Secure your spot early and be among the first to experience everything Havenbrook has to offer!
Key facts
- 6,325 sq ft lot
- Garage
- Built 2026
Neighborhood map
What this means for you Summary
Snapshot
- This is a 3-bed/2.0-bath multifamily listed at $225k. Condition is rated excellent.
Deal economics
- At list price, monthly cash flow is $588 ($7k/yr) — positive.
- The deal already cash-flows at list — no discount required.
- Meets the 1% rule at list price ($3k rent vs $225k).
Location & tenants
- Location reads 80/100 on livability (#37 in TX, #1,749 nationally) — a professional / high-income tenant draw. Strengths: commute A+, cost of living A+, housing A+; Watch: employment C-, schools D+, crime F.
- Lubbock ISD (urban): math 36% / reading 39% proficiency, ranked #481 of 826 in TX (top 58%) — families likely to look elsewhere, expect single-tenant / working-renter base with shorter leases; 60% free/reduced lunch — lower-income household profile, screen leases tightly.
- Market conditions: Rents rising (+2.2%/yr); 464 active listings in the ZIP; 40 comparable units currently listed for rent nearby; rentals lingering (median 44d on market — plan ~5-8 weeks vacancy on turnover, expect pricing pressure); 78% of comp listings sitting > 30 days — soft ceiling on asking rent; 2,219 units permitted in Lubbock County in 2024 (252 in 5+ unit buildings).
- At $2,713/mo this rent would consume 51% of the median local household income ($64k/yr) (locally 2214% of renters already pay >50% of income on rent) — very limited rent-growth headroom before tenants either downsize or default.
Forward outlook
- Local home prices are declining (-3.0%/yr); year-one equity from $2k of loan paydown is wiped out by about $7k of value loss. Plan a longer hold.
- Lubbock County population projected at +39% by 2050 — long-run rental-demand tailwind backs the buy-and-hold thesis.
Negotiation context
- Only 0 days on market — expect competitive offers; lowballing is unlikely to land.
- 2 sale attempts with the ask held roughly flat each time — persistent listings suggest the price (not the market) is what's stuck; bring a comps-based counter.
Risks & watch-outs
- Climate carrying-cost: extreme-heat days projected 7→21/yr by 2055 (HVAC capex compounding) — expect insurance premiums to compound above CPI over the hold.
Questions for the listing agent
- Is there a deadline driving the sale (1031 exchange, divorce, estate, relocation)? That informs how much negotiation room exists.
- Schools are D-rated, which usually means shorter tenancies and higher turnover. Who's the typical renter profile here, and what's been the actual vacancy rate?
- Crime grade is F in this area — have there been break-ins, vandalism, or insurance claims at this property in the last 3 years? What carrier currently insures it and at what premium?
- What's the average days-on-market for RENTAL listings here right now (not sales)? A rising rental-DOM trend means longer vacancies and softer asking-rent achievability than the comps imply.
- What's the recent tenant-quality profile in this submarket — average credit score on applications, eviction rate, late-payment / NSF rate, and stable-employment percentage? A property-management company in the area should have these aggregated.
- How much new apartment / multifamily construction is in the pipeline within 1–3 miles? Heavy new supply (>2% of stock underway) typically softens rents 12–24 months out; light construction supports rent growth.
Investment metrics
- 1% rule
- 1.21% ✓
- Cap rate
- 9.43%
- Cash-on-cash
- 11.21%
- DSCR
- 1.50
- GRM
- 6.9
CMA / ARV
No comps found within radius.
Projected returns pro-forma
-3.0% appreciation · 2.21% rent growth · sell at horizon
- IRR
- -0.5%
- Equity multiple
- 0.98×
- Total profit
- $-1,080
- Equity at exit
- $33,547
- IRR
- 8.4%
- Equity multiple
- 1.62×
- Total profit
- $38,841
- Equity at exit
- $19,453
Cash invested: $62,997 (down + closing). Projections, not guarantees.
Landlord ↔ Tenant lean methodology
- Overall (STATE)
- 87 Strongly Landlord-Friendly
- State Texas
- 87 Strongly Landlord-Friendly · R+5
- County
- — inherits STATE
- City
- — inherits STATE
ZIP-level market 79416
- Home prices YoY
- -20.0%
- Rents YoY
- 2.2%
- Active inventory
- 464
- Price-to-rent
- 13.8×
Monthly cashflow live
- Estimated rent
- $2,713 medium interval (Pro) →
- Mortgage (P&I)
- −$1,180
- Tax est. 1.5%
- −$281 /mo · $3,375/yr
- Insurance
- −$94
- HOA
- −$0
- Vacancy / Maint / Mgmt
- −$570
- Net cashflow
- $588
Break-even live
2-unit breakdown (identical units grouped — click to expand)
| Units | Beds | Baths | Est. rent |
|---|---|---|---|
| 2× units | 3 | 2 | $2,714 |
| #1 | 3 | 2 | $1,357 |
| #2 | 3 | 2 | $1,357 |
| Total (2 units) | $2,713 | ||
UW: 25.0% down · 7.5% · 30yr · 1.5% tax · 5.0% vac · 8.0% maint · 8.0% mgmt
Financing live
Cash to close
- Down payment
- $56,248
- Closing costs
- $6,750
- Reserves months
- —
- Total cash needed
- —
Loan-product check · same deal, 3 products live
Conventional
25% down · 7.5% · 30yr
- Down + closing
- —
- Monthly P&I
- —
- Monthly cashflow
- —
- DSCR
- —
- Eligible?
- —
Personal DTI + credit; lowest rate.
DSCR
20% down · 8.5% · 30yr
- Down + closing
- —
- Monthly P&I
- —
- Monthly cashflow
- —
- DSCR
- —
- Eligible?
- —
No personal income docs; deal must DSCR.
Hard money
10% down · 12.0% · 12mo
- Down + closing
- —
- Monthly P&I
- —
- Monthly cashflow
- —
- DSCR
- —
- Eligible?
- —
Short-term bridge; refi at stabilization.
Rent comps 40 comps
| Address | Beds | Baths | Sqft | Rent | $/sqft | DOM | Units | Dist |
|---|---|---|---|---|---|---|---|---|
| 5539 Auburn St Lubbock, TX | 3.0 | 2.0 | 1107 | $1,325 | $1.20 | 43d | 1 | 0.19mi |
| 5741 Duke St Lubbock, TX | 4.0 | 2.0 | 1693 | $1,699 | $1.00 | 43d | 1 | 0.21mi |
| 307 N Clinton Ave Lubbock, TX | 3.0 | 3.0 | 1435 | $1,225 | $0.85 | 43d | 1 | 0.23mi |
| 5713 1st St Lubbock, TX | 3.0 | 2.0 | 1501 | $1,600 | $1.07 | 13d | 1 | 0.26mi |
| 511 N Clinton Ave Unit A Lubbock, TX | 3.0 | 2.0 | 1400 | $1,250 | $0.89 | 43d | 1 | 0.29mi |
| 305 N Chicago Ave Unit B Lubbock, TX | 3.0 | 3.0 | 1294 | $1,200 | $0.93 | 43d | 1 | 0.29mi |
| 505 N Chicago Ave Unit B Lubbock, TX | 3.0 | 3.0 | 1435 | $1,325 | $0.92 | 43d | 1 | 0.31mi |
| 505 N Chicago Ave Lubbock, TX | 3.0 | 3.0 | 1435 | $1,425 | $0.99 | 43d | 1 | 0.31mi |
| 523 N Clinton Ave Unit Clinton Side A Lubbock, TX | 3.0 | 3.0 | 1435 | $1,295 | $0.90 | 21d | 1 | 0.34mi |
| 503 N Brentwood Ave Unit B Lubbock, TX | 3.0 | 3.0 | 1370 | $1,200 | $0.88 | 43d | 1 | 0.36mi |
| 516 N Chicago Ave Unit B Lubbock, TX | 3.0 | 3.0 | 1370 | $1,200 | $0.88 | 43d | 1 | 0.37mi |
| 310 N Brentwood Ave Unit B Lubbock, TX | 3.0 | 3.0 | 1400 | $1,250 | $0.89 | 43d | 1 | 0.39mi |
| 522 N Chicago Ave Unit B Lubbock, TX | 3.0 | 3.0 | 1370 | $1,200 | $0.88 | 43d | 1 | 0.39mi |
| 533 N Clinton Ave Unit B Lubbock, TX | 3.0 | 3.0 | 1340 | $1,300 | $0.97 | 43d | 1 | 0.39mi |
| 610 N Elkhart Ave Unit B Lubbock, TX | 2.0 | 1.0 | 1070 | $875 | $0.82 | 43d | 1 | 0.40mi |
| 702 N Englewood Ave Unit B Lubbock, TX | 3.0 | 3.0 | 1317 | $1,195 | $0.91 | 43d | 1 | 0.43mi |
| 204 Genoa Ave Lubbock, TX | 3.0 | 2.0 | 1400 | $1,400 | $1.00 | 13d | 1 | 0.47mi |
| 623 N Elkhart Ave Unit A Lubbock, TX | 3.0 | 2.0 | 1340 | $1,600 | $1.19 | 13d | 1 | 0.48mi |
| 602 N Belmont Ave Lubbock, TX | 3.0 | 3.0 | 1370 | $1,325 | $0.97 | 13d | 3 | 0.58mi |
| 5549 Itasca St Unit B Lubbock, TX | 3.0 | 3.0 | 1600 | $1,400 | $0.88 | 43d | 1 | 0.59mi |
| 5537 Itasca St Unit B Lubbock, TX | 3.0 | 3.0 | 1527 | $1,500 | $0.98 | 43d | 1 | 0.59mi |
| 5531 Itasca St Unit A Lubbock, TX | 3.0 | 3.0 | 1527 | $1,500 | $0.98 | 43d | 1 | 0.59mi |
| 5508 Itasca St Unit A Lubbock, TX | 3.0 | 3.0 | 1445 | $1,500 | $1.04 | 43d | 1 | 0.60mi |
| 5914 Erskine St Lubbock, TX | 2.0 | 2.0 | 1200 | $1,250 | $1.04 | 43d | 1 | 0.61mi |
| 5534 Itasca St Unit B Lubbock, TX | 3.0 | 3.0 | 1540 | $1,500 | $0.97 | 43d | 1 | 0.62mi |
| 5526 Itasca St Unit A Lubbock, TX | 3.0 | 3.0 | 1527 | $1,500 | $0.98 | 43d | 1 | 0.62mi |
| 5524 Itasca St Lubbock, TX | 3.0 | 3.0 | 1360 | $1,500 | $1.10 | 21d | 1 | 0.62mi |
| 5524 Itasca St Lubbock, TX | 3.0 | 3.0 | 1527 | $1,500 | $0.98 | 43d | 1 | 0.62mi |
| 5513 Itasca St Lubbock, TX | 3.0 | 3.0 | 1368 | $1,500 | $1.10 | 43d | 1 | 0.62mi |
| 5511 Itasca St Lubbock, TX | 4.0 | 4.0 | 1348 | $2,000 | $1.48 | 13d | 1 | 0.63mi |
| 5516 Itasca St Lubbock, TX | 3.0 | 3.0 | 1360 | $1,500 | $1.10 | 43d | 1 | 0.63mi |
| 5703 Kemper St Unit 2 Lubbock, TX | 3.0 | 3.0 | 1527 | $1,550 | $1.02 | 43d | 1 | 0.63mi |
| 5609 Jarvis St Unit B Lubbock, TX | 3.0 | 2.0 | 1515 | $1,500 | $0.99 | 43d | 1 | 0.64mi |
| 5609 Jarvis St Unit B Lubbock, TX | 3.0 | 2.0 | 1515 | $1,500 | $0.99 | 13d | 1 | 0.64mi |
| 5705 Kemper St Unit B Lubbock, TX | 3.0 | 3.0 | 1527 | $1,500 | $0.98 | 43d | 1 | 0.64mi |
| 5707 Kemper St Unit A Lubbock, TX | 3.0 | 3.0 | 1527 | $1,500 | $0.98 | 43d | 1 | 0.65mi |
| 5506 Itasca St Unit A Lubbock, TX | 3.0 | 3.0 | 1445 | $1,500 | $1.04 | 43d | 1 | 0.66mi |
| 221 Grover Ave Lubbock, TX | 3.0 | 2.0 | 1184 | $1,295 | $1.09 | 13d | 1 | 0.66mi |
| 5504 Itasca St Unit B Lubbock, TX | 3.0 | 3.0 | 1445 | $1,500 | $1.04 | 43d | 1 | 0.67mi |
| 5711 Kemper St Unit B Lubbock, TX | 3.0 | 3.0 | 1527 | $1,500 | $0.98 | 43d | 1 | 0.67mi |
Listing history 4 events
-
2026-05-23historical $1,599
-
2026-05-22$224,990
-
2026-05-22historical
-
2026-04-30$1,599
ⓘ Source: listings_history table (triggers on properties + properties_extension) + one-shot
backfill from property_details.listing_events for pre-trigger history.
Climate risk First Street
- Flood 1/10 Low FEMA zone X (unshaded) · 0% chance over 30 yrs
- Wildfire 2/10 Low
- Heat 5/10 Major 7 d/yr ≥99°F today · 21 d/yr by 30 yrs out
- Wind 2/10 Low
- Air quality 2/10 Low 1 unhealthy d/yr today · 1 by 30 yrs out
Nearby sold comps map
Loading sold comps map…
Walkable amenities ~0.75 mi
Loading nearby amenities…
Taxation est. · year 1
- Rental income
- $32,556
- − Mortgage interest
- −$12,603
- − Property taxes
- −$3,375
- − Insurance
- −$1,125
- − Repairs & maintenance
- −$2,604
- − Management
- −$2,604
- − Depreciation
- −$6,545
- Taxable income
- $3,699
- Est. tax owed @ 24.0%
- −$888
- After-tax cash flow
- $6,173/yr
For passive investors: Depreciation is non-cash, so a rental often shows a tax loss while cash-flowing — sheltering income. Rental losses are passive: they offset passive income freely, and up to $25,000/yr can offset ordinary (W-2) income if you actively participate and your MAGI is under $100k (phasing out to $0 by $150k); unused losses carry forward. On sale, claimed depreciation is recaptured at up to 25%, and gains may owe capital-gains tax (a 1031 exchange can defer both). Figures are a year-1 estimate at your 24.0% rate — not tax advice; consult a CPA.
Condition & rehab AI · 12 photos
This brand new 3-bedroom, 2-bathroom home is in excellent condition with modern finishes and a well-maintained exterior. It offers a great opportunity for both resale and rental due to its prime location and thoughtfully designed layout.
Value-add opportunities
- Both Painting the exterior and interior walls — Fresh paint can enhance curb appeal and interior aesthetics.
- Both Landscaping improvements — Enhanced landscaping can improve curb appeal and attract potential buyers/tenants.
- Both Adding smart home features — Smart home features can increase convenience and appeal to tech-savvy buyers/tenants.
- Both Upgrading appliances — Modern appliances can make the home more attractive and functional for potential buyers/tenants.
Renovation cost estimate screening
Value-add ROI direction
- Both Painting the exterior and interior walls — Fresh paint can enhance curb appeal and interior aesthetics. ↑
- Both Landscaping improvements — Enhanced landscaping can improve curb appeal and attract potential buyers/tenants. ↑
- Both Adding smart home features — Smart home features can increase convenience and appeal to tech-savvy buyers/tenants. ↑
- Both Upgrading appliances — Modern appliances can make the home more attractive and functional for potential buyers/tenants. ↑
ⓘ Cost ranges are severity-bucket heuristics (US national rule-of-thumb). Get contractor quotes + a written scope before underwriting a rehab budget.
Schools (NCES district)
- District
- Lubbock ISD
- NCES district ID
- 4828500
- Math proficiency
- 36% ▼ -8.00%
- Reading proficiency
- 39% ▼ -1.00%
- Median HH income
- $39,820
- Composite
- 31.44/100
- National rank
- #5984
- State rank
- #481 of 826 in TX
Livability — Lubbock
- Score
- 80/100
- State rank
- #37
- US rank
- #1749
Category grades
Schools grade is shown separately in the Schools card above.
Census & demographics
- Census place
- Lubbock, TX
- County
- Lubbock County · 293,542 people
- City population
- 283,030
- Metro
- Lubbock, TX
- Population (ZIP)
- 36,442
- Household income
- $63,896
- Rent vs Own
- Severe rent burden
- 2214.0
Population outlook (Lubbock County) Hauer SSP2
- Today (2025)
- 345,960 people
- By 2030
- 371,449 · +7.4%
- By 2040
- 424,539 · +22.7%
- By 2050
- 481,150 · +39.1%
- By 2075
- 633,467 · +83.1%
- By 2100
- 746,853 · +115.9%
Race, ethnicity, and origin ACS 2023
- Neighborhood character
- Diverse neighborhood (Simpson 0.62)
- Race & ethnicity
- White 49% Hispanic / Latino 35% Two or more races 14% Black 9% Asian 3%
- Hispanic origin (detail)
- Mexican 28%
- Common ancestry
- Slovak 3% Italian 1% Serbian 1%
- Foreign-born
- 7% · Canada, China, South Korea
- Languages at home
- 81% English-only · Spanish 13% Chinese 1% Tagalog/Filipino 1%
Political lean MEDSL · Lubbock
- 2024 margin
- Solid R (+39.5) · D 29.7% · R 69.2% · Other 1.0%
- 2008→2024 swing
- -2.8pp toward R · 2008: -36.7pp · 2024: -39.5pp
- All cycles
- 2024: R+39.5 2020: R+32.2 2016: R+38.4 2012: R+40.9 2008: R+36.7
Not yet ingested
- Civics
- —
Market trends
- HPI YoY
- ▼ -56.94%
- Current HPI
- 227.7841
- Rent YoY
- ▲ 2.21%
- Metro
- Lubbock, TX
- State GDP YoY
- ▲ 3.95%
- F500 in state
- 110
Industry mix (Fortune 500 HQ in TX)
| Industry | F500 HQs | Revenue |
|---|---|---|
| Energy | 16 | $1,198B |
|
||
| Technology | 5 | $198B |
|
||
| Engineering / Construction | 4 | $72B |
|
||
| Energy Services | 3 | $60B |
|
||
| Utilities | 3 | $41B |
|
||
| Healthcare | 2 | $330B |
|
||
Price history
+0.0% since first listed4 events — show timeline
- 2026-05-23 Rental Removed $1,599 LARMLS
- 2026-05-22 Delisted — LARMLS
- 2026-05-22 Listed $224,990 LARMLS
- 2026-04-30 Listed for Rent $1,599 LARMLS
Cash-flow waterfall
monthlySold comps — $/sqft
last 12 mo · ≤1 miLoading sold comps…