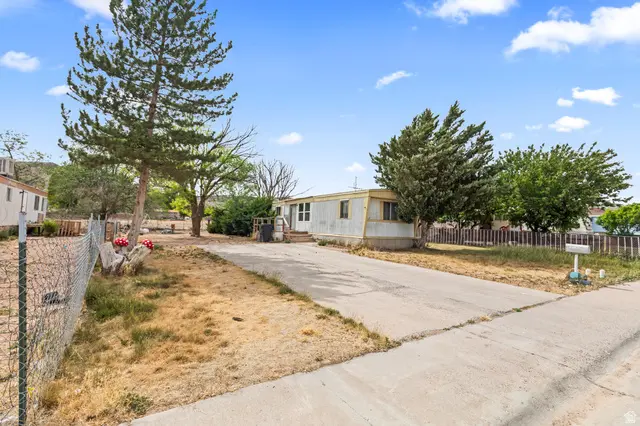
834 S 800 W #75 · Richfield, UT
Flood risk No data
- FEMA flood zone
- —
- Chance of flooding over 30 yrs
- —
- Est. flood insurance / yr
- —
Fire risk No data
- Est. fire insurance / yr
- —
Heat risk No data
- Hot days now (above threshold)
- —
- Hot days in 30 yrs
- —
Wind risk No data
- Chance of severe wind over 30 yrs
- —
Air-quality risk No data
- Unhealthy air days now
- —
- Unhealthy air days in 30 yrs
- —
Risk factors via First Street. Map © Google.
Why this score? — see what drove the D+ grade
The composite is a weighted blend of 9 inputs, each scored 0–100. Each bar is that input's sub-score; the figure is the points it added to the 100-point composite (weight × sub-score).
- Cash flow +18.6/30.0
- ARV discount +7.5/15.0
- DSCR +5.9/10.0
- 1% rule +5.0/10.0
- Schools +3.8/10.0
- Livability +3.6/5.0
- Rent growth +2.5/5.0
- Condition / age +2.2/5.0
- Appreciation +0.0/10.0
$100,000
🖨 Deal sheet 📄 Offer letter ✓ Due diligence
Listing remarks
Looking for an affordable investment property with potential? This 3-bedroom, 2-bath mobile home offers a great opportunity for investors, flippers, or buyers seeking a project property. The home features a functional floor plan with spacious living areas and plenty of room to add value through updates and improvements. Situated on a generous lot, the property has ample outdoor space, though the yard is in need of landscaping and cleanup. With some vision and work, the exterior could be transformed into an attractive outdoor living area. Cash sale only. No financing is available, making this an excellent option for cash buyers looking to expand their investment portfolio or purchase a prope
Key facts
- Generous lot
- Investment property
- Outdoor space
Tags
Property features AI
Finance
- HOA & community: Located in the Mountain View Estates subdivision
Exterior
- Parking: Uncovered/open parking
- Utilities: Natural gas connected; Electricity connected; Sewer connected; Water connected (culinary)
- Home design: Mobile home; Single family use; Faces south; Above-grade finished area reported
- Construction: Aluminum construction materials; Aluminum roof; Built and standing
- Exterior features: Open porch; Paved roads and sidewalks; Mountain view; Mature trees; Flat terrain
Interior
- Kitchen: Refrigerator included
- Bedrooms: Three bedrooms on the main level; Primary bedroom on the 1st floor
- Flooring: Carpet; Laminate; Vinyl
- Bathrooms: One full bathroom; One three-quarter bathroom
- Heating & cooling: Forced air heating (gas central); Natural ventilation for cooling; Has heating and cooling
- Interior features: Primary bathroom; Single-level living; Total of 8 rooms; No basement
Neighborhood map
What this means for you Summary
Snapshot
- This is a 3-bed/2.0-bath single-family listed at $100k. Condition is rated fair.
Deal economics
- At list price, monthly cash flow is $97 ($1k/yr) — positive.
- The deal already cash-flows at list — no discount required.
- To meet the 1% rule (rent ≥ 1% of price), the offer needs to be $100k (0.2% below list).
- Recommended offer: $100k (0.2% below list) — sets the bar for 1% rule.
Location & tenants
- Location reads 72/100 on livability (#81 in UT) — a middle-class / working-renter tenant base. Strengths: cost of living A+, housing A+, health & safety A-; Watch: amenities F, commute F, employment D-.
- Sevier District (rural): math 46% / reading 44% proficiency, ranked #32 of 80 in UT (top 40%) — families likely to look elsewhere, expect single-tenant / working-renter base with shorter leases.
- Zoned schools: Ashman School (508 students, 53% FRL); Red Hills Middle (math 38% / reading 43%, grade F, #69 of 138 statewide, top 51%, 561 students, 38% FRL); Richfield High (math 32% / reading 37%, grade F, #95 of 171 statewide, top 61%, 739 students, 41% FRL) — zoned schools at 44% FRL track the district average.
- Market conditions: 95 active listings in the ZIP; 109 units permitted in Sevier County in 2024 (0 in 5+ unit buildings).
Forward outlook
- Local home prices are declining (-3.0%/yr); year-one equity from $691 of loan paydown is wiped out by about $3k of value loss. Plan a longer hold.
- Sevier County population projected to shrink 6% by 2050 — rents likely to lag national; underwrite the cash flow, not the appreciation.
Negotiation context
- Only 9 days on market — expect competitive offers; lowballing is unlikely to land.
Questions for the listing agent
- Have any recent inspections been done? Can we get a copy of the seller's disclosures and any deferred-maintenance estimates?
- Is there a deadline driving the sale (1031 exchange, divorce, estate, relocation)? That informs how much negotiation room exists.
- Schools are B-rated — typically a magnet for longer-tenancy family renters. What's the average tenant stay here, and is there a school-zone premium baked into asking?
- The area grade is low — what's the realistic commute time and amenity access for the typical tenant pool here? Any planned neighborhood developments (good or bad) we should know about?
- What's the average days-on-market for RENTAL listings here right now (not sales)? A rising rental-DOM trend means longer vacancies and softer asking-rent achievability than the comps imply.
- What's the recent tenant-quality profile in this submarket — average credit score on applications, eviction rate, late-payment / NSF rate, and stable-employment percentage? A property-management company in the area should have these aggregated.
- How much new for-sale + rental construction is in the pipeline within 1–3 miles? Heavy new supply typically softens prices + rents 12–24 months out; constrained supply supports both.
Investment metrics
- 1% rule
- 1.00% ✗
- Cap rate
- 7.46%
- Cash-on-cash
- 4.17%
- DSCR
- 1.19
- GRM
- 8.4
CMA / ARV
No comps found within radius.
Projected returns pro-forma
-3.0% appreciation · 3.0% rent growth · sell at horizon
- IRR
- -9.8%
- Equity multiple
- 0.64×
- Total profit
- $-9,999
- Equity at exit
- $14,910
- IRR
- -0.3%
- Equity multiple
- 0.98×
- Total profit
- $-675
- Equity at exit
- $8,646
Cash invested: $28,000 (down + closing). Projections, not guarantees.
Landlord ↔ Tenant lean methodology
- Overall (STATE)
- 86 Strongly Landlord-Friendly
- State Utah
- 86 Strongly Landlord-Friendly · R+15
- County
- — inherits STATE
- City
- — inherits STATE
ZIP-level market 84701
- Home prices YoY
- -25.5%
- Active inventory
- 95
- Price-to-rent
- 8.4×
Monthly cashflow live
- Estimated rent
- $998 medium interval (Pro) →
- Mortgage (P&I)
- −$524
- Tax est. 1.5%
- −$125 /mo · $1,500/yr
- Insurance
- −$42
- HOA
- −$0
- Vacancy / Maint / Mgmt
- −$210
- Net cashflow
- $97
Break-even live
UW: 25.0% down · 7.5% · 30yr · 1.5% tax · 5.0% vac · 8.0% maint · 8.0% mgmt
Financing live
Cash to close
- Down payment
- $25,000
- Closing costs
- $3,000
- Reserves months
- —
- Total cash needed
- —
Loan-product check · same deal, 3 products live
Conventional
25% down · 7.5% · 30yr
- Down + closing
- —
- Monthly P&I
- —
- Monthly cashflow
- —
- DSCR
- —
- Eligible?
- —
Personal DTI + credit; lowest rate.
DSCR
20% down · 8.5% · 30yr
- Down + closing
- —
- Monthly P&I
- —
- Monthly cashflow
- —
- DSCR
- —
- Eligible?
- —
No personal income docs; deal must DSCR.
Hard money
10% down · 12.0% · 12mo
- Down + closing
- —
- Monthly P&I
- —
- Monthly cashflow
- —
- DSCR
- —
- Eligible?
- —
Short-term bridge; refi at stabilization.
Listing history 9 events
-
2026-06-18days on market $100,000 Active 9 DOM
-
2026-06-17days on market $100,000 Active 8 DOM
-
2026-06-17price $100,000 Active 7 DOM
-
2026-06-16days on market $110,000 Active 7 DOM
-
2026-06-15days on market $110,000 Active 6 DOM
-
2026-06-15days on market $110,000 Active 5 DOM
-
2026-06-13days on market $110,000 Active 4 DOM
-
2026-06-12remarks 699-char remark
-
2026-06-12$110,000 Active 3 DOM
ⓘ Source: listings_history table (triggers on properties + properties_extension) + one-shot
backfill from property_details.listing_events for pre-trigger history.
Nearby sold comps map
Loading sold comps map…
Walkable amenities ~0.75 mi
Loading nearby amenities…
Taxation est. · year 1
- Rental income
- $11,974
- − Mortgage interest
- −$5,602
- − Property taxes
- −$1,500
- − Insurance
- −$500
- − Repairs & maintenance
- −$958
- − Management
- −$958
- − Depreciation
- −$2,909
- Taxable loss
- −$453
- Est. tax savings @ 24.0%
- +$109
- After-tax cash flow
- $1,275/yr
For passive investors: Depreciation is non-cash, so a rental often shows a tax loss while cash-flowing — sheltering income. Rental losses are passive: they offset passive income freely, and up to $25,000/yr can offset ordinary (W-2) income if you actively participate and your MAGI is under $100k (phasing out to $0 by $150k); unused losses carry forward. On sale, claimed depreciation is recaptured at up to 25%, and gains may owe capital-gains tax (a 1031 exchange can defer both). Figures are a year-1 estimate at your 24.0% rate — not tax advice; consult a CPA.
Condition & rehab AI · 2 photos
This mobile home requires significant repairs and updates, including a new roof, exterior siding and paint, flooring, and interior walls. Landscaping and curb appeal improvements can significantly increase its value for resale or rental.
Repairs flagged
- Major roof — The satellite image suggests potential roof damage.
- Major exterior siding — The siding is peeling and the paint is faded.
- Major flooring — The flooring appears worn and possibly damaged.
- Major interior walls/paint — The walls and paint show signs of wear and tear.
- Major landscaping — The yard is in need of landscaping and cleanup, as shown in the satellite image and listing photos.
Value-add opportunities
- Both landscaping and curb appeal — A well-maintained yard and curb appeal can significantly increase both resale and rental value.
- Both roof repair — A new roof can greatly enhance the home's value and appeal to potential buyers or renters.
- Both exterior siding and paint — Updating the exterior siding and paint can improve the home's curb appeal and increase its value.
- Both flooring and interior walls — Repairing and updating the flooring and interior walls can improve the home's condition and increase its value for resale or rental.
Renovation cost estimate screening
| Repair item | Severity | Est. cost |
|---|---|---|
| roof · The satellite image suggests potential roof damage. | Major | $15,000–50,000 |
| exterior siding · The siding is peeling and the paint is faded. | Major | $15,000–50,000 |
| flooring · The flooring appears worn and possibly damaged. | Major | $15,000–50,000 |
| interior walls/paint · The walls and paint show signs of wear and tear. | Major | $15,000–50,000 |
| landscaping · The yard is in need of landscaping and cleanup, as shown in the satellite image and listing photos. | Major | $15,000–50,000 |
| Total estimated repair cost · 5 items | $75,000–250,000 |
Value-add ROI direction
- Both landscaping and curb appeal — A well-maintained yard and curb appeal can significantly increase both resale and rental value. ↑
- Both roof repair — A new roof can greatly enhance the home's value and appeal to potential buyers or renters. ↑
- Both exterior siding and paint — Updating the exterior siding and paint can improve the home's curb appeal and increase its value. ↑
- Both flooring and interior walls — Repairing and updating the flooring and interior walls can improve the home's condition and increase its value for resale or rental. ↑
ⓘ Cost ranges are severity-bucket heuristics (US national rule-of-thumb). Get contractor quotes + a written scope before underwriting a rehab budget.
Schools (NCES district)
- District
- Sevier District
- NCES district ID
- 4900930
- Math proficiency
- 46% ▼ -4.00%
- Reading proficiency
- 44% ▼ -2.00%
- Median HH income
- $46,822
- Composite
- 38.35/100
- National rank
- #4217
- State rank
- #32 of 80 in UT
Livability — Richfield
- Score
- 72/100
- State rank
- #81
- US rank
- #6339
Category grades
Schools grade is shown separately in the Schools card above.
Census & demographics
- Census place
- Richfield, UT
- Population (ZIP)
- 8,756
Population outlook (Sevier County) Hauer SSP2
- Today (2025)
- 21,291 people
- By 2030
- 21,136 · -0.7%
- By 2040
- 20,677 · -2.9%
- By 2050
- 19,930 · -6.4%
- By 2075
- 16,807 · -21.1%
- By 2100
- 12,711 · -40.3%
Race, ethnicity, and origin ACS 2023
- Neighborhood character
- Predominantly White (92%)
- Race & ethnicity
- White 92% Hispanic / Latino 5% Two or more races 4%
- Hispanic origin (detail)
- Mexican 3%
- Common ancestry
- Slovak 4% Portuguese 3% Italian 2%
- Foreign-born
- 1% · Canada
- Languages at home
- 98% English-only · Spanish 1%
Political lean MEDSL · Sevier
- 2024 margin
- Solid R (+75.9) · D 11.3% · R 87.2% · Other 1.5%
- 2008→2024 swing
- -13.0pp toward R · 2008: -62.9pp · 2024: -75.9pp
- All cycles
- 2024: R+75.9 2020: R+76.9 2016: R+69.6 2012: R+80.5 2008: R+62.9
Not yet ingested
- Civics
- —
Market trends
- HPI YoY
- ▼ -92.04%
- Current HPI
- 268.7359
- Rent YoY
- —
- Metro
- —
- State GDP YoY
- ▲ 3.54%
- F500 in state
- 2
Industry mix (Fortune 500 HQ in UT)
| Industry | F500 HQs | Revenue |
|---|---|---|
| Financial Services | 1 | $3B |
|
||
Price history
1 event — show timeline
- 2026-06-09 Listed $110,000 WFRMLS
Cash-flow waterfall
monthlySold comps — $/sqft
last 12 mo · ≤1 miLoading sold comps…