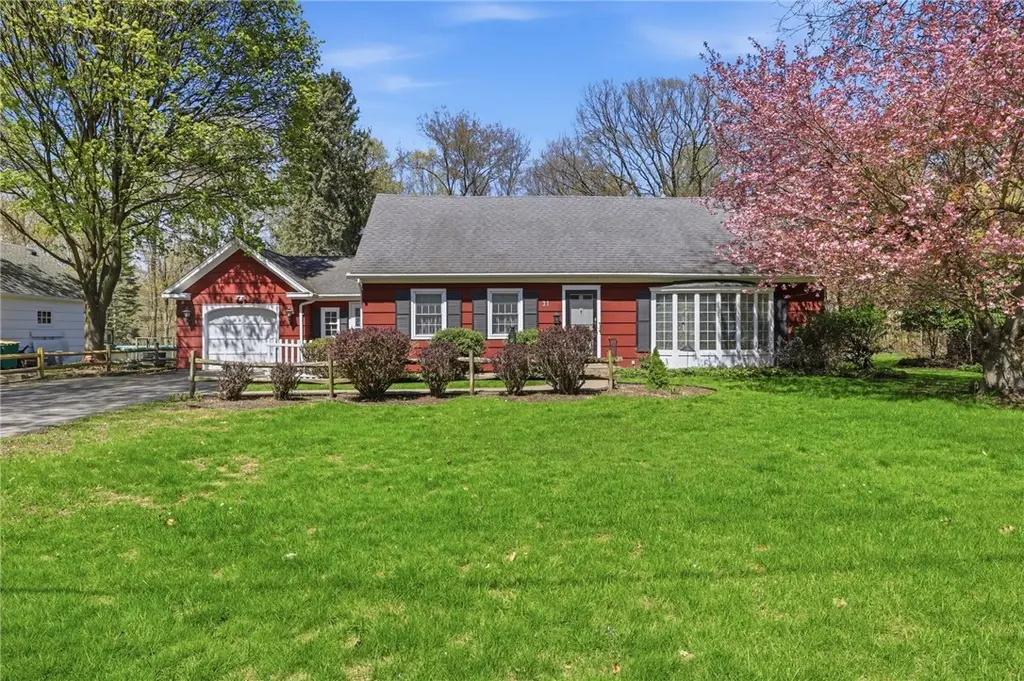
31 Cobbles Dr · East Rochester, NY
Flood risk 1/10 · Minimal
- FEMA flood zone
- X (unshaded)
- Chance of flooding over 30 yrs
- 0.0%
- Est. flood insurance / yr
- $473 – $860
Fire risk 3/10 · Minor
- Est. fire insurance / yr
- $691 – $1,283
Heat risk 2/10 · Minimal
- Hot days now (above 95°F)
- 7 days/yr
- Hot days in 30 yrs
- 15 days/yr
Wind risk 1/10 · Minimal
- Chance of severe wind over 30 yrs
- —
Air-quality risk 2/10 · Minimal
- Unhealthy air days now
- 1 days/yr
- Unhealthy air days in 30 yrs
- 2 days/yr
Risk factors via First Street. Map © Google.
Why this score? — see what drove the D grade
The composite is a weighted blend of 9 inputs, each scored 0–100. Each bar is that input's sub-score; the figure is the points it added to the 100-point composite (weight × sub-score).
- ARV discount +15.0/15.0
- Schools +6.8/10.0
- Cash flow +6.7/30.0
- Livability +3.9/5.0
- 1% rule +2.7/10.0
- Rent growth +2.5/5.0
- Condition / age +2.5/5.0
- DSCR +1.0/10.0
- Appreciation +0.0/10.0
$299,900
🖨 Deal sheet 📄 Offer letter ✓ Due diligence
Listing remarks
Come see this amazing Cape Cod home in the highly desirable Penfield Central School District, conveniently located within walking distance to Penfield High School and Cobbles Elementary School!This home offers a flexible living layout with a huge first-floor bedroom and full bath—perfect for easy main-level living or guest space. Upstairs, you’ll find 3 additional bedrooms and another full bath, providing plenty of room for family or visitors. The eat-in kitchen features painted white cabinets, Corian countertops, and great everyday functionality, while the formal dining room is perfect for hosting gatherings. Enjoy both a front living room with a cozy fireplace and a massive ba
Key facts
- First-floor bedroom
- Cape cod home
- Corian countertops
Tags
Property features AI
Exterior
- Parking: Attached garage with electricity (1 car)
- Utilities: Electricity connected (circuit breakers); Public water connected; Sewer available / septic tank; Cable available; High-speed internet available
- Home design: Two-story home; Resale property; Asphalt roof; Wood siding; Main entrance facing city street
- Construction: Built as existing structure; Copper plumbing; Block foundation
- Exterior features: Blacktop driveway; Patio; Shed(s) and storage; Walk-out basement access
Interior
- Kitchen: Dishwasher; Free-standing range; Microwave; Oven; Refrigerator; Disposal; Gas water heater
- Bedrooms: One main-level bedroom
- Flooring: Carpet; Hardwood; Tile; Varied flooring
- Bathrooms: Two full bathrooms; One main-level bathroom
- Heating & cooling: Gas forced-air heating; Central air; Wall air conditioning units
- Interior features: Ceiling fans; Separate/formal dining room; Eat-in kitchen; Separate/formal living room; Sliding glass doors; Window treatments; Main-level primary bedroom; Programmable thermostat; Thermal windows; Drapes; Sliding doors
- Laundry & utility: Washer; Dryer; Laundry in basement; Sump pump
Neighborhood map
What this means for you Summary
Snapshot
- This is a 4-bed/2.0-bath single-family listed at $300k.
Deal economics
- At list price, monthly cash flow is $-475 ($-6k/yr) — negative.
- To cash-flow at today's rent, offer at most $216k (28.0% below list).
- To meet the 1% rule (rent ≥ 1% of price), the offer needs to be $230k (23.3% below list).
- Recommended offer: $216k (28.0% below list) — sets the bar for cash-flow.
Location & tenants
- Location reads 78/100 on livability (#155 in NY, #2,400 nationally) — a middle-class / working-renter tenant base. Strengths: amenities A+, cost of living A+, housing A+; Watch: employment D+, crime D.
- Penfield Central School District (suburban): math 77% / reading 79% proficiency, ranked #67 of 590 in NY (top 11%) — strong family-tenant draw, lease renewals of 3-5y typical; only 11% free/reduced lunch — higher-income household profile.
- Market conditions: 113 active listings in the ZIP; high-income renter base; 1,169 units permitted in Monroe County in 2024 (591 in 5+ unit buildings).
Forward outlook
- Local home prices are declining (-3.0%/yr); year-one equity from $2k of loan paydown is wiped out by about $9k of value loss. Plan a longer hold.
- Monroe County population projected to shrink 6% by 2050 — rents likely to lag national; underwrite the cash flow, not the appreciation.
Negotiation context
- Only 7 days on market — expect competitive offers; lowballing is unlikely to land.
Risks & watch-outs
- Watch-outs: built in 1957 — expect roof / HVAC / electrical / plumbing capex.
Questions for the listing agent
- What do current leases actually rent for vs. the listed asking? Can we see a recent rent roll and the last 12 months of T-12 income?
- Built in 1957 — when were the roof, HVAC, electrical panel, plumbing, and water heater last replaced?
- Is there a deadline driving the sale (1031 exchange, divorce, estate, relocation)? That informs how much negotiation room exists.
- Schools are A-rated — typically a magnet for longer-tenancy family renters. What's the average tenant stay here, and is there a school-zone premium baked into asking?
- Crime grade is D in this area — have there been break-ins, vandalism, or insurance claims at this property in the last 3 years? What carrier currently insures it and at what premium?
- The area grade is low — what's the realistic commute time and amenity access for the typical tenant pool here? Any planned neighborhood developments (good or bad) we should know about?
- What's the average days-on-market for RENTAL listings here right now (not sales)? A rising rental-DOM trend means longer vacancies and softer asking-rent achievability than the comps imply.
- What's the recent tenant-quality profile in this submarket — average credit score on applications, eviction rate, late-payment / NSF rate, and stable-employment percentage? A property-management company in the area should have these aggregated.
- How much new for-sale + rental construction is in the pipeline within 1–3 miles? Heavy new supply typically softens prices + rents 12–24 months out; constrained supply supports both.
Investment metrics
- 1% rule
- 0.77% ✗
- Cap rate
- 4.39%
- Cash-on-cash
- -6.79%
- DSCR
- 0.70
- GRM
- 10.9
CMA / ARV
- ARV (median comp)
- $445,258
- List price
- $299,900
- Delta
- -32.65%
- Verdict
- UNDERPRICED
- Comps
- 20 within 1.0 mi
Show comp detail 6 sales within ~0.75 mi
| Address | Dist | Beds/Ba | Sqft | Sold | Price | $/sf | Match |
|---|---|---|---|---|---|---|---|
| 55 Cobbles Dr | 0.06mi | 4/2.5 | 2,496 (+2%) | 10mo | $450,000 | $180 | 83 |
| 4 Mountain Rd | 0.27mi | 4/2.5 | 2,484 (+2%) | 12mo | $500,000 | $201 | 72 |
| 1 Mountain Rd | 0.24mi | 4/2.5 | 2,407 (-1%) | 24mo | $455,000 | $189 | 65 |
| 121 Gebhardt Rd | 0.35mi | 4/2.5 | 2,231 (-8%) | 7mo | $350,000 | $157 | 62 |
| 5 Cobblestone Xing | 0.49mi | 4/2.5 | 2,152 (-12%) | 1mo | $575,000 | $267 | 55 |
| 39 Wedgewood Dr | 0.44mi | 3/2.0 (-1) | 2,135 (-12%) | 12mo | $430,000 | $201 | 44 |
Match score weights: distance 35% · size 25% · config 20% · recency 20%. Top-matched comps best support the ARV.
Projected returns pro-forma
-3.0% appreciation · 3.0% rent growth · sell at horizon
- IRR
- -28.0%
- Equity multiple
- 0.06×
- Total profit
- $-78,674
- Equity at exit
- $44,716
- IRR
- -26.4%
- Equity multiple
- -0.27×
- Total profit
- $-106,765
- Equity at exit
- $25,930
Cash invested: $83,972 (down + closing). Projections, not guarantees.
Landlord ↔ Tenant lean methodology
- Overall (STATE)
- 15 Strongly Tenant-Friendly
- State New York
- 15 Strongly Tenant-Friendly · D+10
- County
- — inherits STATE
- City
- — inherits STATE
ZIP-level market 14526
- Active inventory
- 113
- Price-to-rent
- 10.9×
Monthly cashflow live
- Estimated rent
- $2,301 medium interval (Pro) →
- Mortgage (P&I)
- −$1,573
- Tax from tax record
- −$595 /mo · $7,141/yr
- Insurance
- −$125
- HOA
- −$0
- Vacancy / Maint / Mgmt
- −$483
- Net cashflow
- $-475
Break-even live
UW: 25.0% down · 7.5% · 30yr · 1.5% tax · 5.0% vac · 8.0% maint · 8.0% mgmt
Financing live
Cash to close
- Down payment
- $74,975
- Closing costs
- $8,997
- Reserves months
- —
- Total cash needed
- —
Loan-product check · same deal, 3 products live
Conventional
25% down · 7.5% · 30yr
- Down + closing
- —
- Monthly P&I
- —
- Monthly cashflow
- —
- DSCR
- —
- Eligible?
- —
Personal DTI + credit; lowest rate.
DSCR
20% down · 8.5% · 30yr
- Down + closing
- —
- Monthly P&I
- —
- Monthly cashflow
- —
- DSCR
- —
- Eligible?
- —
No personal income docs; deal must DSCR.
Hard money
10% down · 12.0% · 12mo
- Down + closing
- —
- Monthly P&I
- —
- Monthly cashflow
- —
- DSCR
- —
- Eligible?
- —
Short-term bridge; refi at stabilization.
Listing history 2 events
-
2026-05-07status Pending 1210-char remark
-
2026-04-30$299,900 Active 1210-char remark
ⓘ Source: listings_history table (triggers on properties + properties_extension) + one-shot
backfill from property_details.listing_events for pre-trigger history.
Tax reassessment forecast NY · Partial reset (capped growth)
- Current annual tax
- $7,141 · $595/mo
- Projected year-2 tax
- $7,141 · $595/mo
- Expected delta
- $0/yr ($0/mo · 0.0%)
ⓘ Screening estimate from a state-policy table — verify with the county assessor before closing.
Climate risk First Street
- Flood 1/10 Low FEMA zone X (unshaded) · 0% chance over 30 yrs
- Wildfire 3/10 Moderate
- Heat 2/10 Low 7 d/yr ≥95°F today · 15 d/yr by 30 yrs out
- Wind 1/10 Low
- Air quality 2/10 Low 1 unhealthy d/yr today · 2 by 30 yrs out
Nearby sold comps map
Loading sold comps map…
Walkable amenities ~0.75 mi
Loading nearby amenities…
Taxation est. · year 1
- Rental income
- $27,613
- − Mortgage interest
- −$16,799
- − Property taxes
- −$7,141
- − Insurance
- −$1,500
- − Repairs & maintenance
- −$2,209
- − Management
- −$2,209
- − Depreciation
- −$8,724
- Taxable loss
- −$10,969
- Est. tax savings @ 24.0%
- +$2,633
- After-tax cash flow
- $-3,066/yr
For passive investors: Depreciation is non-cash, so a rental often shows a tax loss while cash-flowing — sheltering income. Rental losses are passive: they offset passive income freely, and up to $25,000/yr can offset ordinary (W-2) income if you actively participate and your MAGI is under $100k (phasing out to $0 by $150k); unused losses carry forward. On sale, claimed depreciation is recaptured at up to 25%, and gains may owe capital-gains tax (a 1031 exchange can defer both). Figures are a year-1 estimate at your 24.0% rate — not tax advice; consult a CPA.
Schools (NCES district)
- District
- Penfield Central School District
- NCES district ID
- 3622710
- Math proficiency
- 77% ▼ -3.00%
- Reading proficiency
- 79% ▲ 10.00%
- Median HH income
- $74,802
- Composite
- 68.37/100
- National rank
- #347
- State rank
- #67 of 590 in NY
Livability — East Rochester
- Score
- 78/100
- State rank
- #155
- US rank
- #2400
Category grades
Schools grade is shown separately in the Schools card above.
Census & demographics
- County
- Monroe County · 674,131 people
- City population
- 7,529
- Metro
- Rochester, NY
- Population (ZIP)
- 19,629
- Household income
- $118,777
- Rent vs Own
- Severe rent burden
- 234.0
Population outlook (Monroe County) Hauer SSP2
- Today (2025)
- 759,460 people
- By 2030
- 757,154 · -0.3%
- By 2040
- 740,644 · -2.5%
- By 2050
- 714,443 · -5.9%
- By 2075
- 645,883 · -15.0%
- By 2100
- 547,084 · -28.0%
Race, ethnicity, and origin ACS 2023
- Neighborhood character
- Predominantly White (87%)
- Race & ethnicity
- White 87% Two or more races 7% Hispanic / Latino 5% Asian 2%
- Hispanic origin (detail)
- Puerto Rican 1% Cuban 1%
- Common ancestry
- Romanian 5% Slovak 4% Italian 2%
- Foreign-born
- 8% · Canada, China, Dominican Republic
- Languages at home
- 93% English-only · Other Indo-European 2% Spanish 2% Russian/Polish/Slavic 1%
Political lean MEDSL · Monroe
- 2024 margin
- D (+19.1) · D 59.5% · R 40.5%
- 2008→2024 swing
- +1.4pp toward D · 2008: 17.7pp · 2024: 19.1pp
- All cycles
- 2024: D+19.1 2020: D+21.0 2016: D+14.1 2012: D+17.4 2008: D+17.7
Not yet ingested
- Civics
- —
Market trends
- HPI YoY
- ▼ -149.19%
- Current HPI
- 271.8476
- Rent YoY
- —
- Metro
- Rochester, NY
- State GDP YoY
- ▲ 2.60%
- F500 in state
- 92
Industry mix (Fortune 500 HQ in NY)
| Industry | F500 HQs | Revenue |
|---|---|---|
| Financial Services | 10 | $950B |
|
||
| Consumer Goods | 9 | $162B |
|
||
| Insurance | 4 | $225B |
|
||
| Telecommunications | 2 | $144B |
|
||
| Pharmaceuticals | 2 | $112B |
|
||
| Media / Entertainment | 2 | $69B |
|
||
Price history
2 events — show timeline
- 2026-05-07 Pending — UNYREIS
- 2026-04-30 Listed $299,900 UNYREIS
Property tax history
+1.1%/yrLatest (2025): $7,141 · +37.9% YoY. Source: county tax records.
Cash-flow waterfall
monthlySold comps — $/sqft
last 12 mo · ≤1 miLoading sold comps…