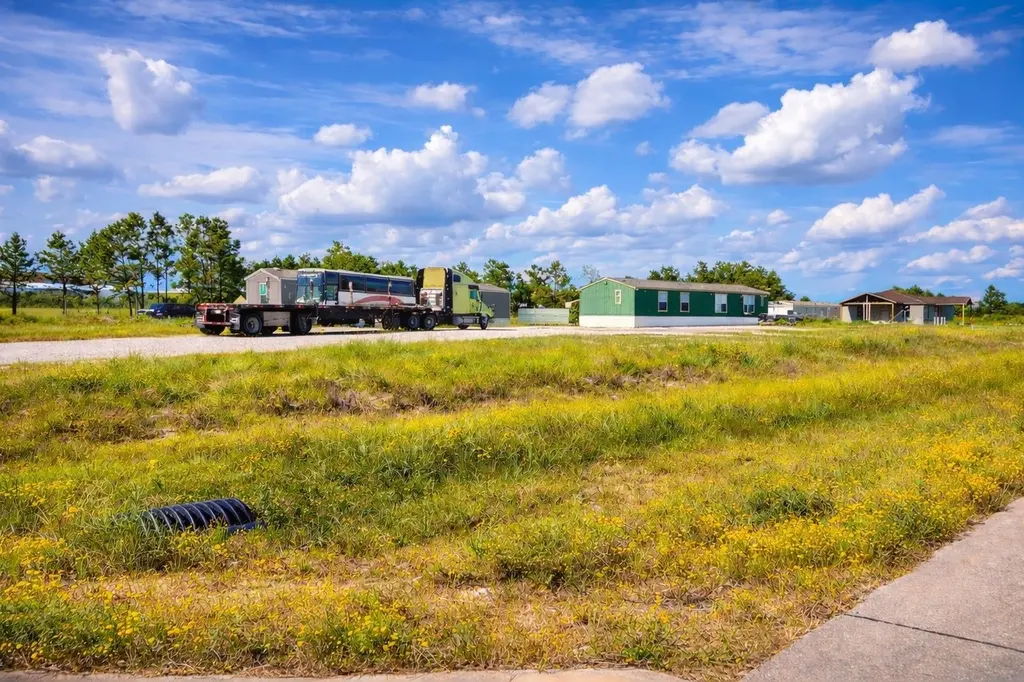
348 Road 5604 · Dayton, TX
Flood risk 3/10 · Minor
- FEMA flood zone
- X (unshaded)
- Chance of flooding over 30 yrs
- 0.1%
- Est. flood insurance / yr
- $507 – $1,088
Fire risk 3/10 · Minor
- Est. fire insurance / yr
- $1,222 – $2,270
Heat risk 8/10 · Major
- Hot days now (above 112°F)
- 7 days/yr
- Hot days in 30 yrs
- 24 days/yr
Wind risk 8/10 · Major
- Chance of severe wind over 30 yrs
- 99.0%
Air-quality risk 2/10 · Minimal
- Unhealthy air days now
- 1 days/yr
- Unhealthy air days in 30 yrs
- 1 days/yr
Risk factors via First Street. Map © Google.
Why this score? — see what drove the D+ grade
The composite is a weighted blend of 9 inputs, each scored 0–100. Each bar is that input's sub-score; the figure is the points it added to the 100-point composite (weight × sub-score).
- Cash flow +24.5/30.0
- DSCR +7.9/10.0
- 1% rule +5.9/10.0
- Rent growth +3.5/5.0
- Livability +3.0/5.0
- Condition / age +2.2/5.0
- Schools +2.1/10.0
- ARV discount +0.0/15.0
- Appreciation +0.0/10.0
$160,000
🖨 Deal sheet 📄 Offer letter ✓ Due diligence
Listing remarks MLS
Welcome to this spacious 3-bedroom, 2-bathroom home situated on a generous corner lot with plenty of outdoor space to enjoy. Featuring an open floor plan, this home offers a seamless flow between the living, dining, and kitchen areas—perfect for entertaining and everyday living. The interior includes a convenient utility room located inside the home, providing added comfort and functionality. With no restrictions, this property offers flexibility for a variety of uses. Located in a desirable area and never flooded, this home combines space, convenience, and peace of mind. Don’t miss this opportunity—schedule your showing today!
Key facts
- 0.57 acre lot
- Built 2022
- Listed 119 days
Neighborhood map
What this means for you Summary
Snapshot
- This is a 3-bed/2.0-bath manufactured listed at $160k. Condition is rated fair.
Deal economics
- At list price, monthly cash flow is $328 ($4k/yr) — positive.
- The deal already cash-flows at list — no discount required.
- Meets the 1% rule at list price ($2k rent vs $160k).
- Recommended offer: $146k (9.0% below list) — sets the bar for market timing.
- Cap rate 8.8% vs local median 3.2% in Dayton — top-decile yield for the area; either an underpriced asset or a hidden risk that comps aren't pricing in. Stress-test before assuming the spread holds.
Location & tenants
- Location reads 60/100 on livability (#1,066 in TX) — a middle-class / working-renter tenant base. Strengths: cost of living A+, housing A+, crime B+; Watch: schools D-, amenities F, commute F.
- Cleveland ISD (town): math 24% / reading 25% proficiency, ranked #723 of 826 in TX (top 88%) — low school quality limits family demand, transient renter base, plan for 1-2y turnover; 71% free/reduced lunch — lower-income household profile, screen leases tightly.
- Market conditions: Rents rising fast (+4.0%/yr); 1574 active listings in the ZIP; 3 comparable units currently listed for rent nearby; rentals leasing fast (median 13d on market — plan ~1-2 weeks tenant-placement turnaround); 1,321 units permitted in Liberty County in 2024 (0 in 5+ unit buildings).
- This rent runs 34% of the median local income ($62k/yr) — at the standard rent-burdened threshold; future hikes will face affordability resistance.
Forward outlook
- Local home prices are declining (-3.0%/yr); year-one equity from $1k of loan paydown is wiped out by about $5k of value loss. Plan a longer hold.
- Liberty County population projected at +24% by 2050 — long-run rental-demand tailwind backs the buy-and-hold thesis.
Negotiation context
- It's been on market 120 days — a 9% lower offer ($146k) is reasonable based on typical stale-listing flexibility.
- 4 sale attempts since 2y ago with the ask held roughly flat each time — persistent listings suggest the price (not the market) is what's stuck; bring a comps-based counter.
Risks & watch-outs
- Climate carrying-cost: severe wind risk, 99% chance of damaging wind over 30y; extreme-heat days projected 7→24/yr by 2055 (HVAC capex compounding) — expect insurance premiums to compound above CPI over the hold.
Questions for the listing agent
- It's been on market 120 days. Have you received any prior offers? Is the seller open to a 9% concession, seller financing, or rate buy-down credit?
- Have any recent inspections been done? Can we get a copy of the seller's disclosures and any deferred-maintenance estimates?
- What does the HOA fee cover, when was the last increase, and are there any pending special assessments or reserve-fund shortfalls?
- Why hasn't it sold? Are there any deal-killer items the seller is aware of (foundation, flood, title, zoning, code violations)?
- Is there a deadline driving the sale (1031 exchange, divorce, estate, relocation)? That informs how much negotiation room exists.
- Schools are D-rated, which usually means shorter tenancies and higher turnover. Who's the typical renter profile here, and what's been the actual vacancy rate?
- The area grade is low — what's the realistic commute time and amenity access for the typical tenant pool here? Any planned neighborhood developments (good or bad) we should know about?
- What's the average days-on-market for RENTAL listings here right now (not sales)? A rising rental-DOM trend means longer vacancies and softer asking-rent achievability than the comps imply.
- What's the recent tenant-quality profile in this submarket — average credit score on applications, eviction rate, late-payment / NSF rate, and stable-employment percentage? A property-management company in the area should have these aggregated.
- How much new for-sale + rental construction is in the pipeline within 1–3 miles? Heavy new supply typically softens prices + rents 12–24 months out; constrained supply supports both.
Investment metrics
- 1% rule
- 1.09% ✓
- Cap rate
- 8.75%
- Cash-on-cash
- 8.79%
- DSCR
- 1.39
- GRM
- 7.7
CMA / ARV
- ARV (median comp)
- $107,900
- List price
- $160,000
- Delta
- 48.29%
- Verdict
- OVERPRICED
- Comps
- 3 within 2.0 mi
Projected returns pro-forma
-3.0% appreciation · 4.0% rent growth · sell at horizon
- IRR
- -1.9%
- Equity multiple
- 0.93×
- Total profit
- $-3,269
- Equity at exit
- $23,857
- IRR
- 8.8%
- Equity multiple
- 1.70×
- Total profit
- $31,428
- Equity at exit
- $13,834
Cash invested: $44,800 (down + closing). Projections, not guarantees.
Landlord ↔ Tenant lean methodology
- Overall (STATE)
- 87 Strongly Landlord-Friendly
- State Texas
- 87 Strongly Landlord-Friendly · R+5
- County
- — inherits STATE
- City
- — inherits STATE
ZIP-level market 77327
- Home prices YoY
- -5.2%
- Rents YoY
- 4.0%
- Active inventory
- 1574
- Price-to-rent
- 7.7×
Monthly cashflow live
- Estimated rent
- $1,740 medium interval (Pro) →
- Mortgage (P&I)
- −$839
- Tax from tax record
- −$131 /mo · $1,568/yr
- Insurance
- −$67
- HOA
- −$10
- Vacancy / Maint / Mgmt
- −$365
- Net cashflow
- $328
Break-even live
UW: 25.0% down · 7.5% · 30yr · 1.5% tax · 5.0% vac · 8.0% maint · 8.0% mgmt
Financing live
Cash to close
- Down payment
- $40,000
- Closing costs
- $4,800
- Reserves months
- —
- Total cash needed
- —
Loan-product check · same deal, 3 products live
Conventional
25% down · 7.5% · 30yr
- Down + closing
- —
- Monthly P&I
- —
- Monthly cashflow
- —
- DSCR
- —
- Eligible?
- —
Personal DTI + credit; lowest rate.
DSCR
20% down · 8.5% · 30yr
- Down + closing
- —
- Monthly P&I
- —
- Monthly cashflow
- —
- DSCR
- —
- Eligible?
- —
No personal income docs; deal must DSCR.
Hard money
10% down · 12.0% · 12mo
- Down + closing
- —
- Monthly P&I
- —
- Monthly cashflow
- —
- DSCR
- —
- Eligible?
- —
Short-term bridge; refi at stabilization.
Rent comps 3 comps
| Address | Beds | Baths | Sqft | Rent | $/sqft | DOM | Units | Dist |
|---|---|---|---|---|---|---|---|---|
| 1192 Road 57071 Cleveland, TX | 2.0 | 2.0 | 1000 | $950 | $0.95 | 1d | 1 | 0.86mi |
| 662 Road 590110 Cleveland, TX | 4.0 | 2.0 | 1600 | $2,200 | $1.38 | 12d | 1 | 0.99mi |
| 203 Road 5248 Cleveland, TX | 3.0 | 2.0 | 910 | $1,680 | $1.85 | 15d | 1 | 1.11mi |
HOA detail
- Monthly dues
- $10 · $120/yr
Listing history 22 events
-
2026-06-18days on market $160,000 Active 120 DOM
-
2026-06-17days on market $160,000 Active 119 DOM
-
2026-06-16days on market $160,000 Active 118 DOM
-
2026-06-15days on market $160,000 Active 117 DOM
-
2026-06-13days on market $160,000 Active 115 DOM
-
2026-06-09days on market $160,000 Active 111 DOM
-
2026-06-08days on market $160,000 Active 110 DOM
-
2026-06-07days on market $160,000 Active 109 DOM
-
2026-06-04days on market $160,000 Active 106 DOM
-
2026-06-03days on market $160,000 Active 105 DOM
-
2026-06-02days on market $160,000 Active 104 DOM
-
2026-06-01days on market $160,000 Active 103 DOM
-
2026-05-31days on market $160,000 Active 102 DOM
-
2026-02-18$160,000 Active 658-char remark
Show marketing remark (658 chars)
Welcome to this spacious 3-bedroom, 2-bathroom home situated on a generous corner lot with plenty of outdoor space to enjoy. Featuring an open floor plan, this home offers a seamless flow between the living, dining, and kitchen areas—perfect for entertaining and everyday living. The interior includes a convenient utility room located inside the home, providing added comfort and functionality. With no restrictions, this property offers flexibility for a variety of uses. Located in a desirable area and never flooded, this home combines space, convenience, and peace of mind. Don’t miss this opportunity—schedule your showing today!
-
2026-01-30historical
-
2025-07-16price $182,000
-
2025-04-07$192,500 Active
-
2025-03-31historical
-
2024-08-21status Active
-
2024-08-17historical
-
2024-08-05$192,500 Active
-
2024-08-04historical
ⓘ Source: listings_history table (triggers on properties + properties_extension) + one-shot
backfill from property_details.listing_events for pre-trigger history.
Tax reassessment forecast TX · Resets to sale price
- Current annual tax
- $1,568 · $131/mo
- Projected year-2 tax
- $2,928 · $244/mo
- Expected delta
- +$1,360/yr (+$113/mo · 86.7%)
ⓘ Screening estimate from a state-policy table — verify with the county assessor before closing.
Climate risk First Street
- Flood 3/10 Moderate FEMA zone X (unshaded) · 10% chance over 30 yrs
- Wildfire 3/10 Moderate
- Heat 8/10 Severe 7 d/yr ≥112°F today · 24 d/yr by 30 yrs out
- Wind 8/10 Severe 99% chance of damaging wind over 30 yrs
- Air quality 2/10 Low 1 unhealthy d/yr today · 1 by 30 yrs out
Nearby sold comps map
Loading sold comps map…
Walkable amenities ~0.75 mi
Loading nearby amenities…
Taxation est. · year 1
- Rental income
- $20,880
- − Mortgage interest
- −$8,962
- − Property taxes
- −$1,568
- − Insurance
- −$800
- − Repairs & maintenance
- −$1,670
- − Management
- −$1,670
- − HOA
- −$120
- − Depreciation
- −$4,655
- Taxable income
- $1,433
- Est. tax owed @ 24.0%
- −$344
- After-tax cash flow
- $3,594/yr
For passive investors: Depreciation is non-cash, so a rental often shows a tax loss while cash-flowing — sheltering income. Rental losses are passive: they offset passive income freely, and up to $25,000/yr can offset ordinary (W-2) income if you actively participate and your MAGI is under $100k (phasing out to $0 by $150k); unused losses carry forward. On sale, claimed depreciation is recaptured at up to 25%, and gains may owe capital-gains tax (a 1031 exchange can defer both). Figures are a year-1 estimate at your 24.0% rate — not tax advice; consult a CPA.
Condition & rehab AI · 12 photos
This manufactured home is in fair condition with cosmetic repairs needed, particularly in landscaping and exterior paint. Landscaping improvements would significantly enhance its curb appeal and overall value.
Repairs flagged
- Major Landscaping — Overgrown grass and weeds need trimming
- Minor Exterior paint — Some wear on exterior walls
Value-add opportunities
- Both Landscaping — Improves curb appeal and property value
- Both Exterior paint — Enhances property appearance and value
Renovation cost estimate screening
| Repair item | Severity | Est. cost |
|---|---|---|
| Landscaping · Overgrown grass and weeds need trimming | Major | $15,000–50,000 |
| Exterior paint · Some wear on exterior walls | Minor | $500–3,000 |
| Total estimated repair cost · 2 items | $15,500–53,000 |
Value-add ROI direction
- Both Landscaping — Improves curb appeal and property value ↑
- Both Exterior paint — Enhances property appearance and value ↑
ⓘ Cost ranges are severity-bucket heuristics (US national rule-of-thumb). Get contractor quotes + a written scope before underwriting a rehab budget.
Schools (NCES district)
- District
- Cleveland ISD
- NCES district ID
- 4814370
- Math proficiency
- 24% ▼ -13.00%
- Reading proficiency
- 25% ▼ -4.00%
- Median HH income
- $39,173
- Composite
- 20.61/100
- National rank
- #8549
- State rank
- #723 of 826 in TX
Livability — Dayton
- Score
- 60/100
- State rank
- #1066
- US rank
- #18940
Category grades
Schools grade is shown separately in the Schools card above.
Census & demographics
- County
- Liberty County · 82,189 people
- City population
- 82,189
- Metro
- Houston-The Woodlands-Sugar Land, TX
- Population (ZIP)
- 42,685
- Household income
- $62,219
- Rent vs Own
- Severe rent burden
- 437.0
Population outlook (Liberty County) Hauer SSP2
- Today (2025)
- 87,956 people
- By 2030
- 92,161 · +4.8%
- By 2040
- 100,784 · +14.6%
- By 2050
- 109,471 · +24.5%
- By 2075
- 133,470 · +51.7%
- By 2100
- 147,372 · +67.6%
Race, ethnicity, and origin ACS 2023
- Neighborhood character
- Diverse neighborhood (Simpson 0.57)
- Race & ethnicity
- Hispanic / Latino 54% White 36% Two or more races 18% Black 8% Native American 2%
- Hispanic origin (detail)
- Mexican 42%
- Common ancestry
- Lithuanian 2% Serbian 1% Slovak 0%
- Foreign-born
- 22% · Canada
- Languages at home
- 51% English-only · Spanish 48%
Political lean MEDSL · Liberty
- 2024 margin
- Solid R (+61.6) · D 19.0% · R 80.6%
- 2008→2024 swing
- -17.9pp toward R · 2008: -43.7pp · 2024: -61.6pp
- All cycles
- 2024: R+61.6 2020: R+59.7 2016: R+58.0 2012: R+53.3 2008: R+43.7
Not yet ingested
- Civics
- —
Market trends
- HPI YoY
- ▼ -12.39%
- Current HPI
- 224.9222
- Rent YoY
- ▲ 4.00%
- Metro
- Houston-The Woodlands-Sugar Land, TX
- State GDP YoY
- ▲ 3.95%
- F500 in state
- 110
Industry mix (Fortune 500 HQ in TX)
| Industry | F500 HQs | Revenue |
|---|---|---|
| Energy | 16 | $1,198B |
|
||
| Technology | 5 | $198B |
|
||
| Engineering / Construction | 4 | $72B |
|
||
| Energy Services | 3 | $60B |
|
||
| Utilities | 3 | $41B |
|
||
| Healthcare | 2 | $330B |
|
||
Price history
-16.9% since first listed9 events — show timeline
- 2026-02-18 Listed $160,000 HARMLS
- 2026-01-30 Listing Removed — HARMLS
- 2025-07-16 Price Changed $182,000 HARMLS
- 2025-04-07 Listed $192,500 HARMLS
- 2025-03-31 Listing Removed — HARMLS
- 2024-08-21 Relisted — HARMLS
- 2024-08-17 Listing Removed — HARMLS
- 2024-08-05 Listed $192,500 HARMLS
- 2024-08-04 Coming Soon — HARMLS
Property tax history
+1.9%/yrLatest (2025): $1,568 · +0.5% YoY. Source: county tax records.
Cash-flow waterfall
monthlySold comps — $/sqft
last 12 mo · ≤1 miLoading sold comps…