101 S Sheridan St · Houston, MN
Flood risk 6/10 · Moderate
- FEMA flood zone
- X
- Chance of flooding over 30 yrs
- 0.67%
- Est. flood insurance / yr
- $507 – $1,088
Fire risk 3/10 · Minor
- Est. fire insurance / yr
- $888 – $1,650
Heat risk 3/10 · Minor
- Hot days now (above 100°F)
- 7 days/yr
- Hot days in 30 yrs
- 15 days/yr
Wind risk 2/10 · Minimal
- Chance of severe wind over 30 yrs
- —
Air-quality risk 1/10 · Minimal
- Unhealthy air days now
- 0 days/yr
- Unhealthy air days in 30 yrs
- 0 days/yr
Risk factors via First Street. Map © Google.
Why this score? — see what drove the C+ grade
The composite is a weighted blend of 9 inputs, each scored 0–100. Each bar is that input's sub-score; the figure is the points it added to the 100-point composite (weight × sub-score).
- Cash flow +25.8/30.0
- DSCR +8.6/10.0
- 1% rule +7.0/10.0
- Schools +4.4/10.0
- Livability +3.8/5.0
- Appreciation +2.8/10.0
- ARV discount +2.7/15.0
- Rent growth +2.5/5.0
- Condition / age +2.5/5.0
$115,000
🖨 Deal sheet 📄 Offer letter ✓ Due diligence
Listing remarks MLS
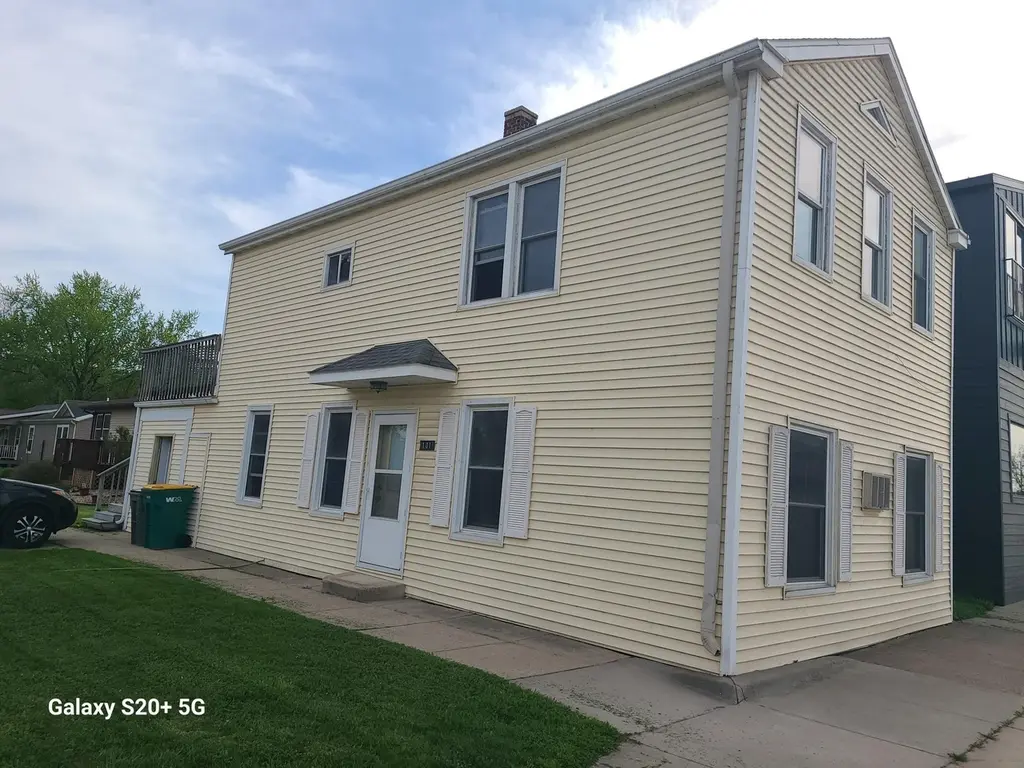
DUPLEX ON CORNER. UPDATED BOTH LEVELS GOOD RENTAL HISTORY UPPER LEVEL HAS WASHER DRYER WINDOW AC. ZIP + 4 TBD.
Key facts
- Functional layout
- 1,742 sq ft lot
- Built 1900
Tags
Property features AI
Finance
- Other: Total living area reported as 1,596 square feet; Below-grade area reported; Main level finished area and unit breakdown available; Total of 2 units (duplex)
- Financial info: Tax information provided but excluded per instructions
- HOA & community: HOA information not provided
Exterior
- Parking: Parking details not provided
- Security: Security details not provided
- Utilities: City water connected; City sewer connected; Natural gas service
- Home design: Residential income property; Duplex up-and-down configuration; Two-story
- Construction: Built details not provided; Stone foundation
- Exterior features: Vinyl exterior
Interior
- Kitchen: Appliances not listed
- Bedrooms: 4 bedrooms total
- Flooring: Flooring details not provided
- Bathrooms: Information not provided
- Heating & cooling: Forced air heating
- Interior features: Partial, unfinished basement; Stone foundation; Two levels
- Laundry & utility: Laundry details not provided
Neighborhood map
What this means for you Summary
Snapshot
- This is a 4-bed/2.0-bath single-family listed at $115k.
Deal economics
- At list price, monthly cash flow is $280 ($3k/yr) — positive.
- The deal already cash-flows at list — no discount required.
- Meets the 1% rule at list price ($1k rent vs $115k).
Location & tenants
- Location reads 75/100 on livability (#177 in MN, #3,824 nationally) — a middle-class / working-renter tenant base. Strengths: crime A+, cost of living A+, housing A+; Watch: employment D, amenities F, commute F.
- Houston Public School District (rural): math 43% / reading 58% proficiency, ranked #111 of 301 in MN (top 37%) — acceptable for families but not a draw, mixed tenant base, ~2y average lease.
- Market conditions: 9 active listings in the ZIP; 48 units permitted in Houston County in 2024 (0 in 5+ unit buildings).
Forward outlook
- Local home prices are declining (-3.0%/yr); year-one equity from $795 of loan paydown is wiped out by about $3k of value loss. Plan a longer hold.
- Houston County population projected at -16% by 2050 — secular population decline; favor cash flow + early exit over multi-decade hold.
Negotiation context
- Only 5 days on market — expect competitive offers; lowballing is unlikely to land.
- 2 sale attempts since 12y ago with the ask held roughly flat each time — persistent listings suggest the price (not the market) is what's stuck; bring a comps-based counter.
Risks & watch-outs
- Watch-outs: built in 1900 — expect roof / HVAC / electrical / plumbing capex.
- Climate carrying-cost: major flood risk — expect insurance premiums to compound above CPI over the hold.
Questions for the listing agent
- Built in 1900 — when were the roof, HVAC, electrical panel, plumbing, and water heater last replaced?
- Is there a deadline driving the sale (1031 exchange, divorce, estate, relocation)? That informs how much negotiation room exists.
- Schools are B-rated — typically a magnet for longer-tenancy family renters. What's the average tenant stay here, and is there a school-zone premium baked into asking?
- What's the average days-on-market for RENTAL listings here right now (not sales)? A rising rental-DOM trend means longer vacancies and softer asking-rent achievability than the comps imply.
- What's the recent tenant-quality profile in this submarket — average credit score on applications, eviction rate, late-payment / NSF rate, and stable-employment percentage? A property-management company in the area should have these aggregated.
- How much new for-sale + rental construction is in the pipeline within 1–3 miles? Heavy new supply typically softens prices + rents 12–24 months out; constrained supply supports both.
Investment metrics
- 1% rule
- 1.20% ✓
- Cap rate
- 9.22%
- Cash-on-cash
- 10.45%
- DSCR
- 1.46
- GRM
- 6.9
CMA / ARV
- ARV (median comp)
- $103,825
- List price
- $115,000
- Delta
- 10.76%
- Verdict
- OVERPRICED
- Comps
- 3 within 1.0 mi
Projected returns pro-forma
-3.0% appreciation · 3.0% rent growth · sell at horizon
- IRR
- -0.6%
- Equity multiple
- 0.98×
- Total profit
- $-744
- Equity at exit
- $17,147
- IRR
- 9.1%
- Equity multiple
- 1.70×
- Total profit
- $22,475
- Equity at exit
- $9,943
Cash invested: $32,200 (down + closing). Projections, not guarantees.
Landlord ↔ Tenant lean methodology
- Overall (STATE)
- 46 Balanced
- State Minnesota
- 46 Balanced · D+2
- County
- — inherits STATE
- City
- — inherits STATE
ZIP-level market 55943
- Home prices YoY
- -1.9%
- Active inventory
- 9
- Price-to-rent
- 6.9×
Monthly cashflow live
- Estimated rent
- $1,382 medium interval (Pro) →
- Mortgage (P&I)
- −$603
- Tax from tax record
- −$160 /mo · $1,926/yr
- Insurance
- −$48
- HOA
- −$0
- Vacancy / Maint / Mgmt
- −$290
- Net cashflow
- $280
Break-even live
UW: 25.0% down · 7.5% · 30yr · 1.5% tax · 5.0% vac · 8.0% maint · 8.0% mgmt
Financing live
Cash to close
- Down payment
- $28,750
- Closing costs
- $3,450
- Reserves months
- —
- Total cash needed
- —
Loan-product check · same deal, 3 products live
Conventional
25% down · 7.5% · 30yr
- Down + closing
- —
- Monthly P&I
- —
- Monthly cashflow
- —
- DSCR
- —
- Eligible?
- —
Personal DTI + credit; lowest rate.
DSCR
20% down · 8.5% · 30yr
- Down + closing
- —
- Monthly P&I
- —
- Monthly cashflow
- —
- DSCR
- —
- Eligible?
- —
No personal income docs; deal must DSCR.
Hard money
10% down · 12.0% · 12mo
- Down + closing
- —
- Monthly P&I
- —
- Monthly cashflow
- —
- DSCR
- —
- Eligible?
- —
Short-term bridge; refi at stabilization.
Listing history 6 events
-
2026-05-12status Pending 455-char remark
-
2026-05-07$115,000 Active 455-char remark
-
2015-04-02soldstatus $50,000
-
2015-03-31soldstatus $50,000 Sold 110-char remark
Show marketing remark (110 chars)
DUPLEX ON CORNER. UPDATED BOTH LEVELS GOOD RENTAL HISTORY UPPER LEVEL HAS WASHER DRYER WINDOW AC. ZIP + 4 TBD.
-
2014-12-01$51,900 Active 110-char remark
Show marketing remark (110 chars)
DUPLEX ON CORNER. UPDATED BOTH LEVELS GOOD RENTAL HISTORY UPPER LEVEL HAS WASHER DRYER WINDOW AC. ZIP + 4 TBD.
-
2004-02-24soldstatus $32,000
ⓘ Source: listings_history table (triggers on properties + properties_extension) + one-shot
backfill from property_details.listing_events for pre-trigger history.
Tax reassessment forecast MN · Partial reset (capped growth)
- Current annual tax
- $1,926 · $160/mo
- Projected year-2 tax
- $1,926 · $160/mo
- Expected delta
- $0/yr ($0/mo · 0.0%)
ⓘ Screening estimate from a state-policy table — verify with the county assessor before closing.
Climate risk First Street
- Flood 6/10 Major FEMA zone X · 67% chance over 30 yrs
- Wildfire 3/10 Moderate
- Heat 3/10 Moderate 7 d/yr ≥100°F today · 15 d/yr by 30 yrs out
- Wind 2/10 Low
- Air quality 1/10 Low 0 unhealthy d/yr today · 0 by 30 yrs out
Nearby sold comps map
Loading sold comps map…
Walkable amenities ~0.75 mi
Loading nearby amenities…
Taxation est. · year 1
- Rental income
- $16,586
- − Mortgage interest
- −$6,442
- − Property taxes
- −$1,926
- − Insurance
- −$575
- − Repairs & maintenance
- −$1,327
- − Management
- −$1,327
- − Depreciation
- −$3,345
- Taxable income
- $1,644
- Est. tax owed @ 24.0%
- −$395
- After-tax cash flow
- $2,970/yr
For passive investors: Depreciation is non-cash, so a rental often shows a tax loss while cash-flowing — sheltering income. Rental losses are passive: they offset passive income freely, and up to $25,000/yr can offset ordinary (W-2) income if you actively participate and your MAGI is under $100k (phasing out to $0 by $150k); unused losses carry forward. On sale, claimed depreciation is recaptured at up to 25%, and gains may owe capital-gains tax (a 1031 exchange can defer both). Figures are a year-1 estimate at your 24.0% rate — not tax advice; consult a CPA.
Schools (NCES district)
- District
- Houston Public School District
- NCES district ID
- 2714280
- Math proficiency
- 43% ▲ 2.00%
- Reading proficiency
- 58% ▬ 0.00%
- Median HH income
- $54,790
- Composite
- 43.6/100
- National rank
- #2970
- State rank
- #111 of 301 in MN
Livability — Houston
- Score
- 75/100
- State rank
- #177
- US rank
- #3824
Category grades
Schools grade is shown separately in the Schools card above.
Census & demographics
- Census place
- Houston, MN
- Population (ZIP)
- 3,070
Population outlook (Houston County) Hauer SSP2
- Today (2025)
- 18,304 people
- By 2030
- 17,878 · -2.3%
- By 2040
- 16,673 · -8.9%
- By 2050
- 15,378 · -16.0%
- By 2075
- 13,146 · -28.2%
- By 2100
- 11,117 · -39.3%
Race, ethnicity, and origin ACS 2023
- Neighborhood character
- Predominantly White (96%)
- Race & ethnicity
- White 96% Two or more races 2% Black 1% Hispanic / Latino 1%
- Common ancestry
- Portuguese 26% Lithuanian 6% Romanian 3%
- Foreign-born
- 1%
- Languages at home
- 98% English-only · Spanish 1% German/W. Germanic 1%
Political lean MEDSL · Houston
- 2024 margin
- R (+16.5) · D 41.0% · R 57.5% · Other 1.6%
- 2008→2024 swing
- -27.2pp toward R · 2008: 10.7pp · 2024: -16.5pp
- All cycles
- 2024: R+16.5 2020: R+12.9 2016: R+14.0 2012: D+3.2 2008: D+10.7
Not yet ingested
- Civics
- —
Market trends
- HPI YoY
- ▼ -4.47%
- Current HPI
- 230.1932
- Rent YoY
- —
- Metro
- —
- State GDP YoY
- ▲ 2.41%
- F500 in state
- 34
Industry mix (Fortune 500 HQ in MN)
| Industry | F500 HQs | Revenue |
|---|---|---|
| Healthcare | 2 | $407B |
|
||
| Retail | 2 | $150B |
|
||
| Consumer Goods | 2 | $32B |
|
||
| Industrial Machinery | 2 | $6B |
|
||
| Agriculture | 1 | $40B |
|
||
| Healthcare / Medical Devices | 1 | $32B |
|
||
Price history
+259.4% since first listed7 events — show timeline
- 2026-06-03 Sold (MLS) $115,000 NORTHSTARMLS as Distributed by MLS Grid
- 2026-05-12 Pending — NORTHSTARMLS as Distributed by MLS Grid
- 2026-05-07 Listed $115,000 NORTHSTARMLS as Distributed by MLS Grid
- 2015-04-02 Sold (Public Records) $50,000 Public Records
- 2015-03-31 Sold (MLS) $50,000 METROMLS
- 2014-12-01 Listed $51,900 METROMLS
- 2004-02-24 Sold (Public Records) $32,000 Public Records
Property tax history
+4.0%/yrLatest (2025): $1,926 · -2.1% YoY. Source: county tax records.
Cash-flow waterfall
monthlySold comps — $/sqft
last 12 mo · ≤1 miLoading sold comps…