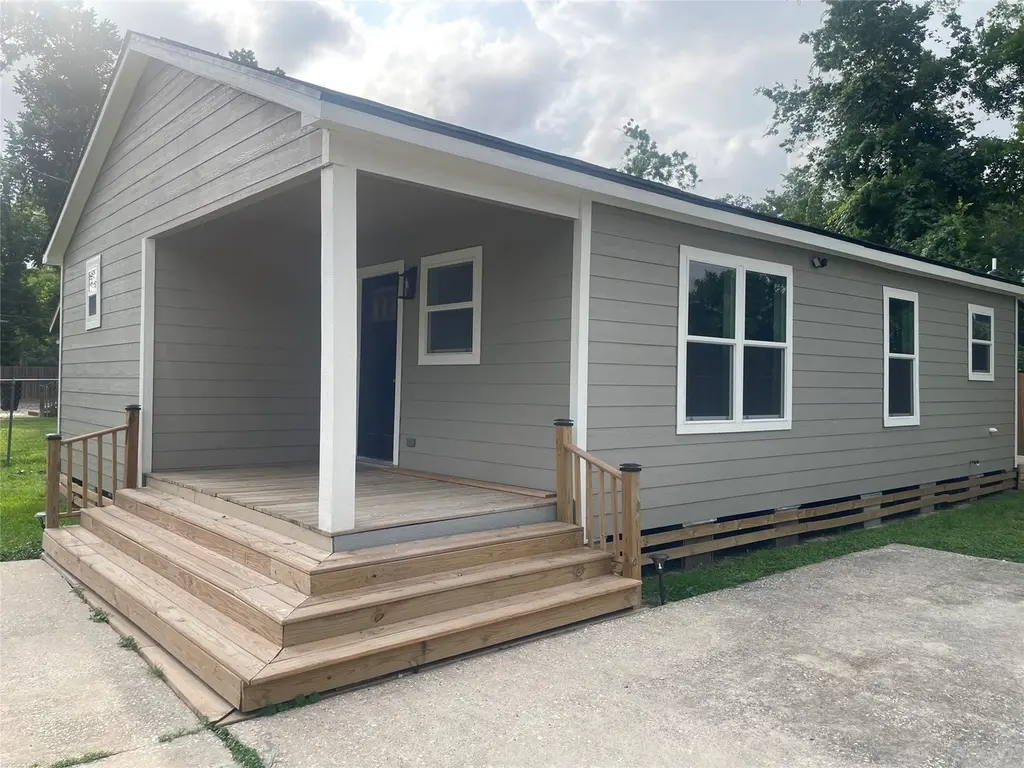
1072 Conklin St · Houston, TX
Flood risk 1/10 · Minimal
- FEMA flood zone
- X (unshaded)
- Chance of flooding over 30 yrs
- 0.0%
- Est. flood insurance / yr
- $507 – $1,088
Fire risk 1/10 · Minimal
- Est. fire insurance / yr
- $1,222 – $2,270
Heat risk 9/10 · Severe
- Hot days now (above 109°F)
- 7 days/yr
- Hot days in 30 yrs
- 22 days/yr
Wind risk 9/10 · Severe
- Chance of severe wind over 30 yrs
- 99.0%
Air-quality risk 3/10 · Minor
- Unhealthy air days now
- 3 days/yr
- Unhealthy air days in 30 yrs
- 4 days/yr
Risk factors via First Street. Map © Google.
Why this score? — see what drove the D+ grade
The composite is a weighted blend of 9 inputs, each scored 0–100. Each bar is that input's sub-score; the figure is the points it added to the 100-point composite (weight × sub-score).
- Cash flow +23.9/30.0
- DSCR +7.7/10.0
- 1% rule +5.7/10.0
- Livability +3.7/5.0
- Schools +2.7/10.0
- Condition / age +2.5/5.0
- Rent growth +2.2/5.0
- ARV discount +0.0/15.0
- Appreciation +0.0/10.0
$195,000
🖨 Deal sheet 📄 Offer letter ✓ Due diligence
Listing remarks
Welcome to this newly renovated 3-bedroom, 2-bathroom home. This property has been completely updated from the foundation to the new insulated sheetrock walls. The home features an awesome front porch that leads you into a spacious living area with upgraded flooring, bright recessed lighting, and a ceiling fan. The kitchen is equipped with ample cabinet space, quartz countertops, and a breakfast bar. The primary bedroom includes recessed lighting, a ceiling fan, and a beautifully tiled walk-in shower. Additional upgrades to the property include a recent roof, siding, updated wiring with a upgraded breaker box, double-paned windows, and more.
Key facts
- Quartz countertops
- Tiled walk-in shower
- New front porch
Tags
Property features AI
Exterior
- Utilities: Public water; Public sewer
- Home design: Residential property; Single-story entry (first-floor living areas)
- Construction: Built in 1960; Pillar/post/pier foundation; Composition roof
- Exterior features: Fully fenced yard; Lot described as 'Other'
Interior
- Kitchen: Disposal
- Bedrooms: Primary bedroom on the first floor (approx. 11 x 10); Bedroom on the first floor (approx. 10 x 10); Bedroom on the first floor (approx. 10 x 10)
- Flooring: Laminate; Tile
- Bathrooms: 2 full bathrooms
- Interior features: Breakfast bar; Soaking tub; Living/dining room
- Laundry & utility: Washer hookup; Electric dryer hookup
Neighborhood map
What this means for you Summary
Snapshot
- This is a 3-bed/2.0-bath single-family listed at $195k.
Deal economics
- At list price, monthly cash flow is $377 ($5k/yr) — positive.
- The deal already cash-flows at list — no discount required.
- Meets the 1% rule at list price ($2k rent vs $195k).
- Recommended offer: $192k (1.5% below list) — sets the bar for market timing.
- Cap rate 8.6% vs local median 3.2% in Houston — top-decile yield for the area; either an underpriced asset or a hidden risk that comps aren't pricing in. Stress-test before assuming the spread holds.
Location & tenants
- Location reads 74/100 on livability (#184 in TX, #4,771 nationally) — a middle-class / working-renter tenant base. Strengths: amenities A+, cost of living A+, housing A+; Watch: crime F.
- Houston ISD (urban): math 27% / reading 35% proficiency, ranked #593 of 826 in TX (top 72%) — families likely to look elsewhere, expect single-tenant / working-renter base with shorter leases; 71% free/reduced lunch — lower-income household profile, screen leases tightly.
- Zoned schools: Williams Middle (math 9% / reading 15%, grade F, #1,623 of 1,662 statewide, top 98%, 411 students, 98% FRL); Washington B T H S (math 27% / reading 25%, grade F, #1,234 of 1,632 statewide, top 76%, 878 students, 96% FRL) — zoned schools average 97% FRL vs 71% district-wide (26 pts higher); higher-poverty schools than district average — tighter screening recommended.
- Zoned-school proficiency averages 19% at this address vs 31% district-wide (-12 pts) — the specific schools serving this property underperform the Houston ISD average; the district grade overstates school quality for this exact location.
- Market conditions: Rents soft (-1.0%/yr); 468 active listings in the ZIP; 4 comparable units currently listed for rent nearby; rentals lingering (median 44d on market — plan ~5-8 weeks vacancy on turnover, expect pricing pressure); 50% of comp listings sitting > 30 days — soft ceiling on asking rent; 29,883 units permitted in Harris County in 2024 (8,621 in 5+ unit buildings).
- At $2,094/mo this rent would consume 46% of the median local household income ($54k/yr) (locally 2294% of renters already pay >50% of income on rent) — very limited rent-growth headroom before tenants either downsize or default.
Forward outlook
- Local home prices are declining (-3.0%/yr); year-one equity from $1k of loan paydown is wiped out by about $6k of value loss. Plan a longer hold.
- Harris County population projected at +47% by 2050 — long-run rental-demand tailwind backs the buy-and-hold thesis.
Negotiation context
- It's been on market 28 days — a 2% lower offer ($192k) is reasonable based on typical stale-listing flexibility.
Risks & watch-outs
- Climate carrying-cost: severe wind risk, 99% chance of damaging wind over 30y; extreme-heat days projected 7→22/yr by 2055 (HVAC capex compounding) — expect insurance premiums to compound above CPI over the hold.
Questions for the listing agent
- Built in 1960 — when were the roof, HVAC, electrical panel, plumbing, and water heater last replaced?
- Is there a deadline driving the sale (1031 exchange, divorce, estate, relocation)? That informs how much negotiation room exists.
- Schools are D-rated, which usually means shorter tenancies and higher turnover. Who's the typical renter profile here, and what's been the actual vacancy rate?
- Crime grade is F in this area — have there been break-ins, vandalism, or insurance claims at this property in the last 3 years? What carrier currently insures it and at what premium?
- The area grade is low — what's the realistic commute time and amenity access for the typical tenant pool here? Any planned neighborhood developments (good or bad) we should know about?
- What's the average days-on-market for RENTAL listings here right now (not sales)? A rising rental-DOM trend means longer vacancies and softer asking-rent achievability than the comps imply.
- What's the recent tenant-quality profile in this submarket — average credit score on applications, eviction rate, late-payment / NSF rate, and stable-employment percentage? A property-management company in the area should have these aggregated.
- How much new for-sale + rental construction is in the pipeline within 1–3 miles? Heavy new supply typically softens prices + rents 12–24 months out; constrained supply supports both.
Investment metrics
- 1% rule
- 1.07% ✓
- Cap rate
- 8.61%
- Cash-on-cash
- 8.29%
- DSCR
- 1.37
- GRM
- 7.8
CMA / ARV
- ARV (on-the-fly)
- $153,120
- Comps found
- 12
Show comp detail 12 sales within ~0.75 mi
| Address | Dist | Beds/Ba | Sqft | Sold | Price | $/sf | Match |
|---|---|---|---|---|---|---|---|
| 958 Conklin St | 0.30mi | 3/2.0 | 1,020 (+7%) | 3mo | $215,000 | $211 | 72 |
| 1028 N Victory Dr | 0.56mi | 3/2.0 | 960 (+0%) | 12mo | $200,000 | $208 | 63 |
| 8839 Glenhouse Dr | 0.69mi | 3/1.5 | 935 (-2%) | 1mo | $129,000 | $138 | 61 |
| 8914 De Priest St | 0.52mi | 3/2.0 | 1,020 (+7%) | 8mo | $150,000 | $147 | 58 |
| 1314 Tarberry Rd | 0.63mi | 3/1.5 | 1,022 (+7%) | 5mo | $143,999 | $141 | 53 |
| 1811 W Gulf Bank Rd | 0.47mi | 3/1.5 | 1,021 (+7%) | 15mo | $170,000 | $167 | 52 |
| 8811 Cottage Gate Ln | 0.66mi | 3/1.5 | 989 (+3%) | 11mo | $208,000 | $210 | 52 |
| 8602 De Priest St | 0.49mi | 3/2.0 | 1,080 (+13%) | 6mo | $115,000 | $106 | 51 |
| 955 Lucky St | 0.68mi | 3/2.0 | 1,064 (+11%) | 1mo | $110,000 | $103 | 49 |
| 1042 Saint Clair St | 0.52mi | 2/1.0 (-1) | 912 (-5%) | 13mo | $128,000 | $140 | 48 |
| 8323 Ponnel Ln | 0.53mi | 2/1.0 (-1) | 877 (-8%) | 11mo | $140,000 | $160 | 44 |
| 9526 Tower St | 0.59mi | 2/1.0 (-1) | 840 (-12%) | 4mo | $250,000 | $298 | 40 |
Match score weights: distance 35% · size 25% · config 20% · recency 20%. Top-matched comps best support the ARV.
Projected returns pro-forma
-3.0% appreciation · 0.0% rent growth · sell at horizon
- IRR
- -7.0%
- Equity multiple
- 0.75×
- Total profit
- $-13,729
- Equity at exit
- $29,075
- IRR
- -1.5%
- Equity multiple
- 0.91×
- Total profit
- $-4,790
- Equity at exit
- $16,860
Cash invested: $54,600 (down + closing). Projections, not guarantees.
Landlord ↔ Tenant lean methodology
- Overall (STATE)
- 87 Strongly Landlord-Friendly
- State Texas
- 87 Strongly Landlord-Friendly · R+5
- County
- — inherits STATE
- City
- — inherits STATE
ZIP-level market 77088
- Home prices YoY
- -23.2%
- Rents YoY
- -1.0%
- Active inventory
- 468
- Price-to-rent
- 7.8×
Monthly cashflow live
- Estimated rent
- $2,094 medium interval (Pro) →
- Mortgage (P&I)
- −$1,023
- Tax from tax record
- −$173 /mo · $2,078/yr
- Insurance
- −$81
- HOA
- −$0
- Vacancy / Maint / Mgmt
- −$440
- Net cashflow
- $377
Break-even live
UW: 25.0% down · 7.5% · 30yr · 1.5% tax · 5.0% vac · 8.0% maint · 8.0% mgmt
Financing live
Cash to close
- Down payment
- $48,750
- Closing costs
- $5,850
- Reserves months
- —
- Total cash needed
- —
Loan-product check · same deal, 3 products live
Conventional
25% down · 7.5% · 30yr
- Down + closing
- —
- Monthly P&I
- —
- Monthly cashflow
- —
- DSCR
- —
- Eligible?
- —
Personal DTI + credit; lowest rate.
DSCR
20% down · 8.5% · 30yr
- Down + closing
- —
- Monthly P&I
- —
- Monthly cashflow
- —
- DSCR
- —
- Eligible?
- —
No personal income docs; deal must DSCR.
Hard money
10% down · 12.0% · 12mo
- Down + closing
- —
- Monthly P&I
- —
- Monthly cashflow
- —
- DSCR
- —
- Eligible?
- —
Short-term bridge; refi at stabilization.
Rent comps 4 comps
| Address | Beds | Baths | Sqft | Rent | $/sqft | DOM | Units | Dist |
|---|---|---|---|---|---|---|---|---|
| 1464 Ferguson Way Houston, TX | 2.0 | 3.0 | 850 | $1,850 | $2.18 | 43d | 1 | 0.37mi |
| 1010 Junell St Unit A Houston, TX | 3.0 | 2.0 | 1040 | $1,550 | $1.49 | 24d | 1 | 0.42mi |
| 929 Marjorie St Unit 1060806P Houston, TX | 3.0 | 2.0 | 1076 | $3,091 | $2.87 | 7d | 1 | 0.43mi |
| 1825 W Little York Rd Houston, TX | 2.0 | 1.0 | 787 | $880 | $1.12 | 43d | 1 | 1.27mi |
Listing history 17 events
-
2026-06-18days on market $195,000 Active 28 DOM
-
2026-06-17days on market $195,000 Active 27 DOM
-
2026-06-16days on market $195,000 Active 26 DOM
-
2026-06-15days on market $195,000 Active 25 DOM
-
2026-06-13days on market $195,000 Active 23 DOM
-
2026-06-13days on market $195,000 Active 22 DOM
-
2026-06-09days on market $195,000 Active 19 DOM
-
2026-06-08days on market $195,000 Active 18 DOM
-
2026-06-07days on market $195,000 Active 17 DOM
-
2026-06-04days on market $195,000 Active 14 DOM
-
2026-06-03days on market $195,000 Active 13 DOM
-
2026-06-02days on market $195,000 Active 12 DOM
-
2026-06-01days on market $195,000 Active 11 DOM
-
2026-05-31days on market $195,000 Active 10 DOM
-
2026-05-21$195,000 Active
-
2007-11-12soldstatus
-
1999-01-13soldstatus
ⓘ Source: listings_history table (triggers on properties + properties_extension) + one-shot
backfill from property_details.listing_events for pre-trigger history.
Tax reassessment forecast TX · Resets to sale price
- Current annual tax
- $2,078 · $173/mo
- Projected year-2 tax
- $3,568 · $297/mo
- Expected delta
- +$1,490/yr (+$124/mo · 71.7%)
ⓘ Screening estimate from a state-policy table — verify with the county assessor before closing.
Climate risk First Street
- Flood 1/10 Low FEMA zone X (unshaded) · 0% chance over 30 yrs
- Wildfire 1/10 Low
- Heat 9/10 Extreme 7 d/yr ≥109°F today · 22 d/yr by 30 yrs out
- Wind 9/10 Extreme 99% chance of damaging wind over 30 yrs
- Air quality 3/10 Moderate 3 unhealthy d/yr today · 4 by 30 yrs out
Nearby sold comps map
Loading sold comps map…
Walkable amenities ~0.75 mi
Loading nearby amenities…
Taxation est. · year 1
- Rental income
- $25,126
- − Mortgage interest
- −$10,923
- − Property taxes
- −$2,078
- − Insurance
- −$975
- − Repairs & maintenance
- −$2,010
- − Management
- −$2,010
- − Depreciation
- −$5,673
- Taxable income
- $1,457
- Est. tax owed @ 24.0%
- −$350
- After-tax cash flow
- $4,176/yr
For passive investors: Depreciation is non-cash, so a rental often shows a tax loss while cash-flowing — sheltering income. Rental losses are passive: they offset passive income freely, and up to $25,000/yr can offset ordinary (W-2) income if you actively participate and your MAGI is under $100k (phasing out to $0 by $150k); unused losses carry forward. On sale, claimed depreciation is recaptured at up to 25%, and gains may owe capital-gains tax (a 1031 exchange can defer both). Figures are a year-1 estimate at your 24.0% rate — not tax advice; consult a CPA.
Schools (NCES district)
- District
- Houston ISD
- NCES district ID
- 4823640
- Math proficiency
- 27% ▼ -18.00%
- Reading proficiency
- 35% ▼ -6.00%
- Median HH income
- $46,054
- Composite
- 26.63/100
- National rank
- #7173
- State rank
- #593 of 826 in TX
Livability — Houston
- Score
- 74/100
- State rank
- #184
- US rank
- #4771
Category grades
Schools grade is shown separately in the Schools card above.
Census & demographics
- Census place
- Houston, TX
- County
- Harris County · 4,702,590 people
- City population
- 3,226,434
- Metro
- Houston-The Woodlands-Sugar Land, TX
- Population (ZIP)
- 57,047
- Household income
- $54,411
- Rent vs Own
- Severe rent burden
- 2294.0
Population outlook (Harris County) Hauer SSP2
- Today (2025)
- 5,571,493 people
- By 2030
- 6,089,821 · +9.3%
- By 2040
- 7,142,806 · +28.2%
- By 2050
- 8,185,864 · +46.9%
- By 2075
- 10,574,329 · +89.8%
- By 2100
- 12,109,958 · +117.4%
Race, ethnicity, and origin ACS 2023
- Neighborhood character
- Diverse neighborhood (Simpson 0.59)
- Race & ethnicity
- Hispanic / Latino 52% Black 37% Two or more races 18% White 6% Asian 4%
- Hispanic origin (detail)
- Mexican 36%
- Common ancestry
- Lithuanian 1%
- Foreign-born
- 25% · Canada, Vietnam, China
- Languages at home
- 49% English-only · Spanish 47% Vietnamese 3%
Political lean MEDSL · Harris
- 2024 margin
- Lean D (+5.5) · D 52.0% · R 46.4% · Other 1.6%
- 2008→2024 swing
- +3.9pp toward D · 2008: 1.6pp · 2024: 5.5pp
- All cycles
- 2024: D+5.5 2020: D+13.3 2016: D+12.4 2012: D+0.1 2008: D+1.6
Not yet ingested
- Civics
- —
Market trends
- HPI YoY
- ▼ -98.37%
- Current HPI
- 325.0499
- Rent YoY
- ▼ -1.01%
- Metro
- Houston-The Woodlands-Sugar Land, TX
- State GDP YoY
- ▲ 3.95%
- F500 in state
- 110
Industry mix (Fortune 500 HQ in TX)
| Industry | F500 HQs | Revenue |
|---|---|---|
| Energy | 16 | $1,198B |
|
||
| Technology | 5 | $198B |
|
||
| Engineering / Construction | 4 | $72B |
|
||
| Energy Services | 3 | $60B |
|
||
| Utilities | 3 | $41B |
|
||
| Healthcare | 2 | $330B |
|
||
Price history
3 events — show timeline
- 2026-05-21 Listed $195,000 HARMLS
- 2007-11-12 Sold (Public Records) — Public Records
- 1999-01-13 Sold (Public Records) — Public Records
Property tax history
+5.5%/yrLatest (2025): $2,078 · +1.2% YoY. Source: county tax records.
Cash-flow waterfall
monthlySold comps — $/sqft
last 12 mo · ≤1 miLoading sold comps…