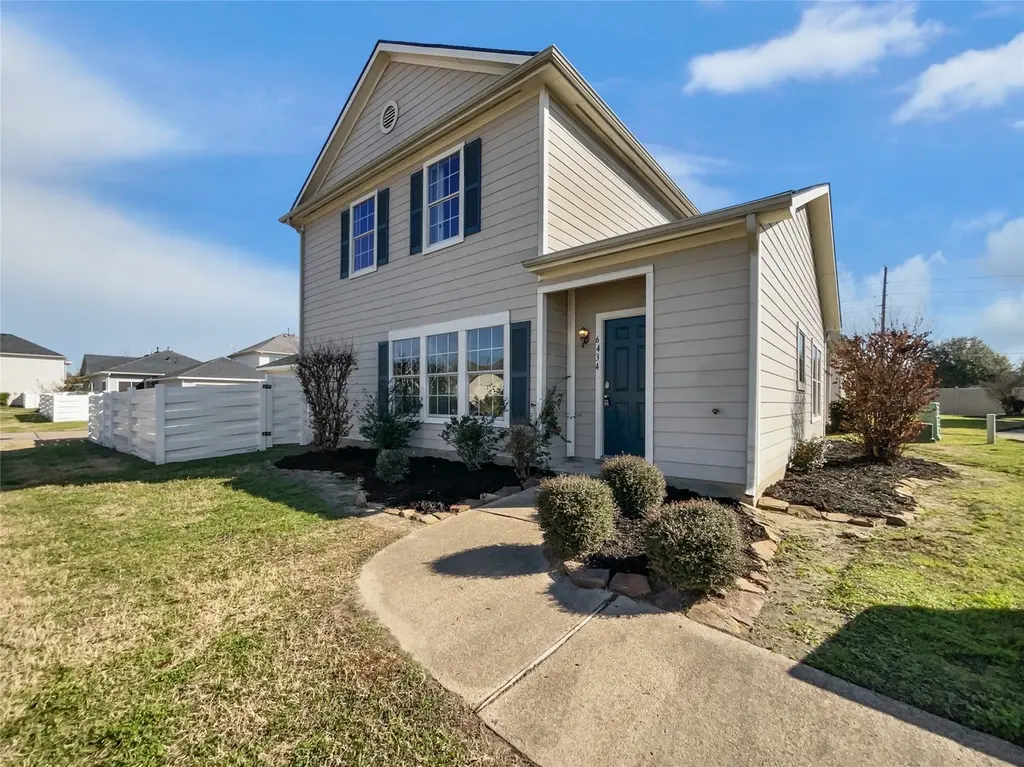
6434 Provident Green Dr · Houston, TX
Flood risk 5/10 · Moderate
- FEMA flood zone
- X (unshaded)
- Chance of flooding over 30 yrs
- 0.65%
- Est. flood insurance / yr
- $507 – $1,088
Fire risk 3/10 · Minor
- Est. fire insurance / yr
- $1,222 – $2,270
Heat risk 9/10 · Severe
- Hot days now (above 110°F)
- 7 days/yr
- Hot days in 30 yrs
- 23 days/yr
Wind risk 8/10 · Major
- Chance of severe wind over 30 yrs
- 99.0%
Air-quality risk 2/10 · Minimal
- Unhealthy air days now
- 2 days/yr
- Unhealthy air days in 30 yrs
- 2 days/yr
Risk factors via First Street. Map © Google.
Why this score? — see what drove the D grade
The composite is a weighted blend of 9 inputs, each scored 0–100. Each bar is that input's sub-score; the figure is the points it added to the 100-point composite (weight × sub-score).
- Cash flow +9.6/30.0
- ARV discount +7.7/15.0
- Appreciation +4.4/10.0
- Schools +4.4/10.0
- 1% rule +4.2/10.0
- Livability +3.7/5.0
- DSCR +2.7/10.0
- Condition / age +2.5/5.0
- Rent growth +1.8/5.0
$226,000
🖨 Deal sheet (PDF) 📄 Offer letter ✓ Due diligence
Listing remarks MLS
Welcome to 6434 Provident Green Dr, a home that exudes modern elegance. The kitchen is a chef's dream, boasting stainless steel appliances that are brand new and ready for use. The primary bedroom is a sanctuary, complete with a spacious walk-in closet for all your storage needs. The fenced-in backyard provides a private outdoor space, perfect for relaxation or entertaining. The interior of the home has been refreshed with a fresh coat of paint, giving it a clean and contemporary feel. Additionally, partial flooring replacement has been done, enhancing the overall aesthetic of the home. This property is a perfect blend of style and comfort, waiting for you to make it your own. Included 100-Day Home Warranty with buyer activation
Key facts
- Walk-in closet
- Fenced-in backyard
- 2,975 sq ft lot
Tags
Neighborhood map
What this means for you Summary
Snapshot
- This is a 4-bed/2.5-bath single-family listed at $226k.
Deal economics
- At list price, monthly cash flow is $-155 ($-2k/yr) — negative.
- To cash-flow at today's rent, offer at most $199k (12.1% below list).
- To meet the 1% rule (rent ≥ 1% of price), the offer needs to be $209k (7.6% below list).
- Recommended offer: $199k (12.1% below list) — sets the bar for cash-flow.
- Cap rate 5.5% vs local median 3.2% in Houston — top-decile yield for the area; either an underpriced asset or a hidden risk that comps aren't pricing in. Stress-test before assuming the spread holds.
Location & tenants
- Location reads 74/100 on livability (#184 in TX, #4,771 nationally) — a middle-class / working-renter tenant base. Strengths: amenities A+, cost of living A+, housing A+; Watch: crime F.
- Cypress-Fairbanks ISD (suburban): math 45% / reading 52% proficiency, ranked #161 of 826 in TX (top 20%) — families likely to look elsewhere, expect single-tenant / working-renter base with shorter leases.
- Zoned schools: Hemmenway El (math 29% / reading 40%, grade F, #1,995 of 4,322 statewide, top 50%, 1,151 students, 82% FRL); Hopper Middle (math 24% / reading 34%, grade F, #1,103 of 1,662 statewide, top 67%, 930 students, 80% FRL); Cypress-Fairbanks J J A E P (12 students, 0% FRL).
- Zoned-school proficiency averages 32% at this address vs 48% district-wide (-17 pts) — the specific schools serving this property underperform the Cypress-Fairbanks ISD average; the district grade overstates school quality for this exact location.
- Market conditions: Rents soft (-2.9%/yr); 763 active listings in the ZIP; 40 comparable units currently listed for rent nearby; rentals at typical pace (median 20d on market — plan ~3-4 weeks tenant-placement turnaround); solid renter incomes; 29,883 units permitted in Harris County in 2024 (8,621 in 5+ unit buildings).
Forward outlook
- Local home prices are declining (-1.3%/yr); year-one equity from $2k of loan paydown is wiped out by about $3k of value loss. Plan a longer hold.
- Harris County population projected at +47% by 2050 — long-run rental-demand tailwind backs the buy-and-hold thesis.
Negotiation context
- It's been on market 135 days — a 12% lower offer ($199k) is reasonable based on typical stale-listing flexibility.
Risks & watch-outs
- Climate carrying-cost: moderate flood risk; severe wind risk, 99% chance of damaging wind over 30y; extreme-heat days projected 7→23/yr by 2055 (HVAC capex compounding) — expect insurance premiums to compound above CPI over the hold.
Questions for the listing agent
- What do current leases actually rent for vs. the listed asking? Can we see a recent rent roll and the last 12 months of T-12 income?
- It's been on market 135 days. Have you received any prior offers? Is the seller open to a 12% concession, seller financing, or rate buy-down credit?
- What does the HOA fee cover, when was the last increase, and are there any pending special assessments or reserve-fund shortfalls?
- Why hasn't it sold? Are there any deal-killer items the seller is aware of (foundation, flood, title, zoning, code violations)?
- Is there a deadline driving the sale (1031 exchange, divorce, estate, relocation)? That informs how much negotiation room exists.
- Schools are D-rated, which usually means shorter tenancies and higher turnover. Who's the typical renter profile here, and what's been the actual vacancy rate?
- Crime grade is F in this area — have there been break-ins, vandalism, or insurance claims at this property in the last 3 years? What carrier currently insures it and at what premium?
- The area grade is low — what's the realistic commute time and amenity access for the typical tenant pool here? Any planned neighborhood developments (good or bad) we should know about?
- What's the average days-on-market for RENTAL listings here right now (not sales)? A rising rental-DOM trend means longer vacancies and softer asking-rent achievability than the comps imply.
- What's the recent tenant-quality profile in this submarket — average credit score on applications, eviction rate, late-payment / NSF rate, and stable-employment percentage? A property-management company in the area should have these aggregated.
- How much new for-sale + rental construction is in the pipeline within 1–3 miles? Heavy new supply typically softens prices + rents 12–24 months out; constrained supply supports both.
Investment metrics
- 1% rule
- 0.92% ✗
- Cap rate
- 5.47%
- Cash-on-cash
- -2.94%
- DSCR
- 0.87
- GRM
- 9.0
CMA / ARV
- ARV (median comp)
- $227,117
- List price
- $226,000
- Delta
- -0.49%
- Verdict
- FAIR
- Comps
- 20 within 1.0 mi
Show comp detail 12 sales within ~0.75 mi
| Address | Dist | Beds/Ba | Sqft | Sold | Price | $/sf | Match |
|---|---|---|---|---|---|---|---|
| 6114 Elton Knolls St | 0.29mi | 4/2.5 | 1,596 (0%) | 6mo | $225,000 | $141 | 81 |
| 6618 Portlick Dr | 0.18mi | 3/2.0 (-1) | 1,613 (+1%) | 2mo | $245,000 | $152 | 81 |
| 19518 Kadabra Dr | 0.34mi | 4/2.0 | 1,698 (+6%) | 2mo | $230,000 | $135 | 70 |
| 20019 Mason Creek Dr | 0.28mi | 3/2.0 (-1) | 1,731 (+8%) | 3mo | $259,000 | $150 | 63 |
| 6342 Torrance Elms Ct | 0.12mi | 3/2.5 (-1) | 1,820 (+14%) | 4mo | $224,000 | $123 | 63 |
| 19538 Billineys Park Dr | 0.36mi | 3/2.0 (-1) | 1,495 (-6%) | 6mo | $214,900 | $144 | 60 |
| 21007 Terrace View Dr | 0.48mi | 3/2.0 (-1) | 1,475 (-8%) | 1mo | $250,000 | $169 | 57 |
| 5914 Laramie River Ct | 0.47mi | 3/2.0 (-1) | 1,490 (-7%) | 6mo | $237,500 | $159 | 55 |
| 6310 Macquarie Dr | 0.54mi | 3/2.0 (-1) | 1,708 (+7%) | 5mo | $275,000 | $161 | 52 |
| 20914 Hall Colony Ct | 0.42mi | 3/2.5 (-1) | 1,820 (+14%) | 4mo | $248,000 | $136 | 49 |
| 6003 Ida Rose Ct | 0.56mi | 3/2.0 (-1) | 1,758 (+10%) | 2mo | $245,000 | $139 | 48 |
| 19440 Tahoka Springs Dr | 0.60mi | 3/2.0 (-1) | 1,468 (-8%) | 6mo | $231,600 | $158 | 46 |
Match score weights: distance 35% · size 25% · config 20% · recency 20%. Top-matched comps best support the ARV.
Projected returns pro-forma
-1.27% appreciation · 0.0% rent growth · sell at horizon
- IRR
- -13.8%
- Equity multiple
- 0.44×
- Total profit
- $-35,571
- Equity at exit
- $51,630
- IRR
- -10.4%
- Equity multiple
- 0.19×
- Total profit
- $-50,983
- Equity at exit
- $51,762
Cash invested: $63,280 (down + closing). Projections, not guarantees.
Landlord ↔ Tenant lean methodology
- Overall (STATE)
- 87 Strongly Landlord-Friendly
- State Texas
- 87 Strongly Landlord-Friendly · R+5
- County
- — inherits STATE
- City
- — inherits STATE
ZIP-level market 77449
- Home prices YoY
- -0.5%
- Rents YoY
- -2.9%
- Active inventory
- 763
- Price-to-rent
- 9.0×
Monthly cashflow live
- Estimated rent
- $2,088 high interval (Pro) →
- Mortgage (P&I)
- −$1,185
- Tax from tax record
- −$461 /mo · $5,531/yr
- Insurance
- −$94
- HOA
- −$64
- Vacancy / Maint / Mgmt
- −$438
- Net cashflow
- $-155
Break-even live
Sensitivity live
| Price | -10% $-27 | -5% $-91 | +0% $-155 | +5% $-219 | +10% $-283 |
|---|---|---|---|---|---|
| Rent | -10% $-320 | -5% $-237 | +0% $-155 | +5% $-72 | +10% $10 |
| Rate | -1.0pp $-41 | -0.5pp $-97 | base $-155 | +0.5pp $-213 | +1.0pp $-273 |
UW: 25.0% down · 7.5% · 30yr · 1.5% tax · 5.0% vac · 8.0% maint · 8.0% mgmt
Financing live
Cash to close
- Down payment
- $56,500
- Closing costs
- $6,780
- Reserves months
- —
- Total cash needed
- —
Loan-product check · same deal, 3 products live
Conventional
25% down · 7.5% · 30yr
- Down + closing
- —
- Monthly P&I
- —
- Monthly cashflow
- —
- DSCR
- —
- Eligible?
- —
Personal DTI + credit; lowest rate.
DSCR
20% down · 8.5% · 30yr
- Down + closing
- —
- Monthly P&I
- —
- Monthly cashflow
- —
- DSCR
- —
- Eligible?
- —
No personal income docs; deal must DSCR.
Hard money
10% down · 12.0% · 12mo
- Down + closing
- —
- Monthly P&I
- —
- Monthly cashflow
- —
- DSCR
- —
- Eligible?
- —
Short-term bridge; refi at stabilization.
Rent comps 40 comps
| Address | Beds | Baths | Sqft | Rent | $/sqft | DOM | Units | Dist |
|---|---|---|---|---|---|---|---|---|
| 6619 Rusty Ridge Ln Katy, TX | 3.0 | 2.5 | 1450 | $1,895 | $1.31 | 6d | 1 | 0.10mi |
| 6642 High Stone Ln Katy, TX | 4.0 | 2.0 | 2091 | $1,999 | $0.96 | 45d | 1 | 0.28mi |
| 6502 Wellington Meadows Dr Katy, TX | 3.0 | 2.0 | 1416 | $1,500 | $1.06 | 14d | 1 | 0.28mi |
| 19638 Billineys Park Dr Katy, TX | 3.0 | 2.5 | 1752 | $1,750 | $1.00 | 21d | 1 | 0.30mi |
| 20507 Barker Bend Ct Katy, TX | 3.0 | 2.0 | 1488 | $1,825 | $1.23 | 45d | 1 | 0.36mi |
| 19607 Buckland Park Dr Katy, TX | 3.0 | 2.0 | 1798 | $1,965 | $1.09 | 4d | 1 | 0.38mi |
| 6810 N Fry Rd Katy, TX | 1.0–3.0 | 1.0–3.0 | 1151 | $2,683 | $2.33 | 1d | 58 | 0.44mi |
| 20967 Young Meadows Way Katy, TX | 3.0 | 2.0 | 1256 | $1,795 | $1.43 | 9d | 1 | 0.50mi |
| 20735 Dewberry Creek Ln Katy, TX | 4.0 | 2.0 | 1609 | $1,756 | $1.09 | 24d | 1 | 0.62mi |
| 6506 Garden Canyon Dr Katy, TX | 3.0 | 2.0 | 1842 | $1,895 | $1.03 | 24d | 1 | 0.67mi |
| 21035 Carmel Valley Dr Katy, TX | 3.0 | 2.0 | 1431 | $1,791 | $1.25 | 26d | 1 | 0.72mi |
| 19802 Plantation Grove Trl Katy, TX | 3.0 | 2.0 | 1607 | $1,745 | $1.09 | 45d | 1 | 0.77mi |
| 6402 Wild River Dr Katy, TX | 3.0 | 2.0 | 1572 | $2,091 | $1.33 | 4d | 1 | 0.77mi |
| 19735 Plantation Grove Trl Katy, TX | 3.0 | 2.0 | 1404 | $1,719 | $1.22 | 4d | 1 | 0.81mi |
| 19730 Cozy Cabbin Dr Katy, TX | 3.0 | 2.0 | 1544 | $1,800 | $1.17 | 24d | 1 | 0.84mi |
| 19434 Glenway Falls Dr Katy, TX | 3.0 | 2.0 | 1326 | $1,800 | $1.36 | 45d | 1 | 0.89mi |
| 19442 Elmtree Estates Dr Katy, TX | 3.0 | 2.0 | 1735 | $1,776 | $1.02 | 14d | 1 | 0.89mi |
| 20123 Braley Ct Cypress, TX | 3.0 | 2.5 | 1726 | $1,976 | $1.14 | 1d | 1 | 0.92mi |
| 19903 Mountain Dale Dr Cypress, TX | 3.0 | 2.0 | 1356 | $1,896 | $1.40 | 1d | 1 | 0.92mi |
| 21054 Breezeway Cove Dr Bridgeland, TX | 3.0–4.0 | 2.5–3.5 | 1784 | $3,258 | $1.83 | 1d | 41 | 1.06mi |
| 6010 Diantha St Katy, TX | 3.0 | 2.0 | 1465 | $1,856 | $1.27 | 45d | 1 | 1.10mi |
| 5706 Fullgarden Ct Katy, TX | 3.0 | 2.0 | 2023 | $1,966 | $0.97 | 1d | 1 | 1.10mi |
| 7310 Coconut Bay Dr Cypress, TX | 4.0 | 2.0 | 1620 | $2,307 | $1.42 | 45d | 1 | 1.12mi |
| 5906 Grand Colony Dr Katy, TX | 2.0–3.0 | 2.0 | 1143 | $1,720 | $1.50 | 1d | 10 | 1.18mi |
| 21038 Bay Village Dr Cypress, TX | 4.0 | 2.5 | 1904 | $2,491 | $1.31 | 45d | 1 | 1.18mi |
| 21034 Shore Oak Dr Cypress, TX | 4.0 | 3.0 | 2110 | $2,950 | $1.40 | 45d | 1 | 1.22mi |
| 5707 Amelia Plantation Dr Katy, TX | 4.0 | 3.0 | 1687 | $2,020 | $1.20 | 45d | 1 | 1.23mi |
| 6747 Scarlet Sagebrush St Katy, TX | 3.0 | 2.0 | 1530 | $2,300 | $1.50 | 45d | 1 | 1.26mi |
| 5523 Dapplewood Ln Katy, TX | 3.0 | 2.0 | 1560 | $1,825 | $1.17 | 1d | 1 | 1.27mi |
| 19715 Swan Valley Dr Cypress, TX | 3.0 | 2.0 | 1380 | $1,886 | $1.37 | 45d | 1 | 1.29mi |
| 5418 Gosforth Dr Katy, TX | 3.0 | 2.5 | 2150 | $2,150 | $1.00 | 45d | 1 | 1.30mi |
| 21235 Catalina Palm Dr Cypress, TX | 4.0 | 2.0 | 1756 | $2,600 | $1.48 | 45d | 1 | 1.31mi |
| 21031 Sandestin Ridge Dr Cypress, TX | 5.0 | 3.5 | 2099 | $2,861 | $1.36 | 45d | 1 | 1.32mi |
| 19218 Sandelford Dr Katy, TX | 3.0 | 2.0 | 1195 | $1,000 | $0.84 | 4d | 1 | 1.32mi |
| 19235 Sandelford Dr Katy, TX | 3.0 | 2.0 | 1330 | $1,000 | $0.75 | 9d | 1 | 1.33mi |
| 19203 Canaras Ct Katy, TX | 3.0 | 2.0 | 1195 | $1,750 | $1.46 | 19d | 1 | 1.34mi |
| 21627 Calico Bush Trl Katy, TX | 3.0 | 2.0 | 1423 | $3,800 | $2.67 | 19d | 1 | 1.36mi |
| 20126 Breezy Oak Ct Cypress, TX | 3.0 | 2.0 | 1667 | $2,100 | $1.26 | 6d | 1 | 1.39mi |
| 6331 Scotchwood Dr Katy, TX | 3.0 | 2.5 | 1610 | $1,681 | $1.04 | 7d | 1 | 1.39mi |
| 21447 FM 529 Rd Cypress, TX | 1.0–3.0 | 1.0–2.0 | 996 | $2,205 | $2.21 | 1d | 28 | 1.41mi |
HOA detail
- Monthly dues
- $64 · $768/yr
Listing history 17 events
-
2026-06-21days on market $226,000 Active 135 DOM
-
2026-06-18days on market $226,000 Active 132 DOM
-
2026-06-17days on market $226,000 Active 131 DOM
-
2026-06-16days on market $226,000 Active 130 DOM
-
2026-06-15days on market $226,000 Active 129 DOM
-
2026-06-13days on market $226,000 Active 127 DOM
-
2026-06-13pricedays on market $226,000 Active 126 DOM
-
2026-06-09days on market $234,000 Active 123 DOM
-
2026-06-08days on market $234,000 Active 122 DOM
-
2026-06-07days on market $234,000 Active 121 DOM
-
2026-06-04days on market $234,000 Active 118 DOM
-
2026-06-03days on market $234,000 Active 117 DOM
-
2026-06-02days on market $234,000 Active 116 DOM
-
2026-06-02days on market $234,000 Active 115 DOM
-
2026-05-31days on market $234,000 Active 114 DOM
-
2026-02-06$234,000 Active 738-char remark
Show marketing remark (738 chars)
Welcome to 6434 Provident Green Dr, a home that exudes modern elegance. The kitchen is a chef's dream, boasting stainless steel appliances that are brand new and ready for use. The primary bedroom is a sanctuary, complete with a spacious walk-in closet for all your storage needs. The fenced-in backyard provides a private outdoor space, perfect for relaxation or entertaining. The interior of the home has been refreshed with a fresh coat of paint, giving it a clean and contemporary feel. Additionally, partial flooring replacement has been done, enhancing the overall aesthetic of the home. This property is a perfect blend of style and comfort, waiting for you to make it your own. Included 100-Day Home Warranty with buyer activation
-
2026-01-07soldstatus
ⓘ Source: listings_history table (triggers on properties + properties_extension) + one-shot
backfill from property_details.listing_events for pre-trigger history.
Tax reassessment forecast TX · Resets to sale price
- Current annual tax
- $5,531 · $461/mo
- Projected year-2 tax
- $5,531 · $461/mo
- Expected delta
- $0/yr ($0/mo · 0.0%)
ⓘ Screening estimate from a state-policy table — verify with the county assessor before closing.
Climate risk First Street
- Flood 5/10 Major FEMA zone X (unshaded) · 65% chance over 30 yrs
- Wildfire 3/10 Moderate
- Heat 9/10 Extreme 7 d/yr ≥110°F today · 23 d/yr by 30 yrs out
- Wind 8/10 Severe 99% chance of damaging wind over 30 yrs
- Air quality 2/10 Low 2 unhealthy d/yr today · 2 by 30 yrs out
Nearby sold comps map
Loading sold comps map…
Walkable amenities ~0.75 mi
Loading nearby amenities…
Taxation est. · year 1
- Rental income
- $25,053
- − Mortgage interest
- −$12,660
- − Property taxes
- −$5,531
- − Insurance
- −$1,130
- − Repairs & maintenance
- −$2,004
- − Management
- −$2,004
- − HOA
- −$768
- − Depreciation
- −$6,575
- Taxable loss
- −$5,619
- Est. tax savings @ 24.0%
- +$1,348
- After-tax cash flow
- $-511/yr
For passive investors: Depreciation is non-cash, so a rental often shows a tax loss while cash-flowing — sheltering income. Rental losses are passive: they offset passive income freely, and up to $25,000/yr can offset ordinary (W-2) income if you actively participate and your MAGI is under $100k (phasing out to $0 by $150k); unused losses carry forward. On sale, claimed depreciation is recaptured at up to 25%, and gains may owe capital-gains tax (a 1031 exchange can defer both). Figures are a year-1 estimate at your 24.0% rate — not tax advice; consult a CPA.
Schools (NCES district)
- District
- Cypress-Fairbanks ISD
- NCES district ID
- 4816110
- Math proficiency
- 45% ▼ -12.00%
- Reading proficiency
- 52% ▼ -2.00%
- Median HH income
- $72,025
- Composite
- 43.63/100
- National rank
- #2968
- State rank
- #161 of 826 in TX
Livability — Houston
- Score
- 74/100
- State rank
- #184
- US rank
- #4771
Category grades
Schools grade is shown separately in the Schools card above.
Census & demographics
- County
- Harris County · 4,702,590 people
- City population
- 3,226,434
- Metro
- Houston-The Woodlands-Sugar Land, TX
- Population (ZIP)
- 130,028
- Household income
- $87,808
- Rent vs Own
- Severe rent burden
- 3088.0
Population outlook (Harris County) Hauer SSP2
- Today (2025)
- 5,571,493 people
- By 2030
- 6,089,821 · +9.3%
- By 2040
- 7,142,806 · +28.2%
- By 2050
- 8,185,864 · +46.9%
- By 2075
- 10,574,329 · +89.8%
- By 2100
- 12,109,958 · +117.4%
Race, ethnicity, and origin ACS 2023
- Neighborhood character
- Diverse neighborhood (Simpson 0.68)
- Race & ethnicity
- Hispanic / Latino 49% Two or more races 22% Black 20% White 19% Asian 6%
- Hispanic origin (detail)
- Mexican 26% Puerto Rican 1% Cuban 4%
- Common ancestry
- Lithuanian 1% Italian 1%
- Foreign-born
- 32% · Canada, Jamaica, Vietnam
- Languages at home
- 48% English-only · Spanish 40% Other Indo-European 3% Vietnamese 1%
Political lean MEDSL · Harris
- 2024 margin
- Lean D (+5.5) · D 52.0% · R 46.4% · Other 1.6%
- 2008→2024 swing
- +3.9pp toward D · 2008: 1.6pp · 2024: 5.5pp
- All cycles
- 2024: D+5.5 2020: D+13.3 2016: D+12.4 2012: D+0.1 2008: D+1.6
Not yet ingested
- Civics
- —
Market trends
- HPI YoY
- ▼ -1.27%
- Current HPI
- 254.6622
- Rent YoY
- ▼ -2.86%
- Metro
- Houston-The Woodlands-Sugar Land, TX
- State GDP YoY
- ▲ 3.95%
- F500 in state
- 110
Industry mix (Fortune 500 HQ in TX)
| Industry | F500 HQs | Revenue |
|---|---|---|
| Energy | 16 | $1,198B |
|
||
| Technology | 5 | $198B |
|
||
| Engineering / Construction | 4 | $72B |
|
||
| Energy Services | 3 | $60B |
|
||
| Utilities | 3 | $41B |
|
||
| Healthcare | 2 | $330B |
|
||
Price history
2 events — show timeline
- 2026-02-06 Listed $234,000 HARMLS
- 2026-01-07 Sold (Public Records) — Public Records
Property tax history
+4.4%/yrLatest (2025): $5,531 · +2.9% YoY. Source: county tax records.
Cash-flow waterfall
monthlySold comps — $/sqft
last 12 mo · ≤1 miLoading sold comps…