 8-Plex
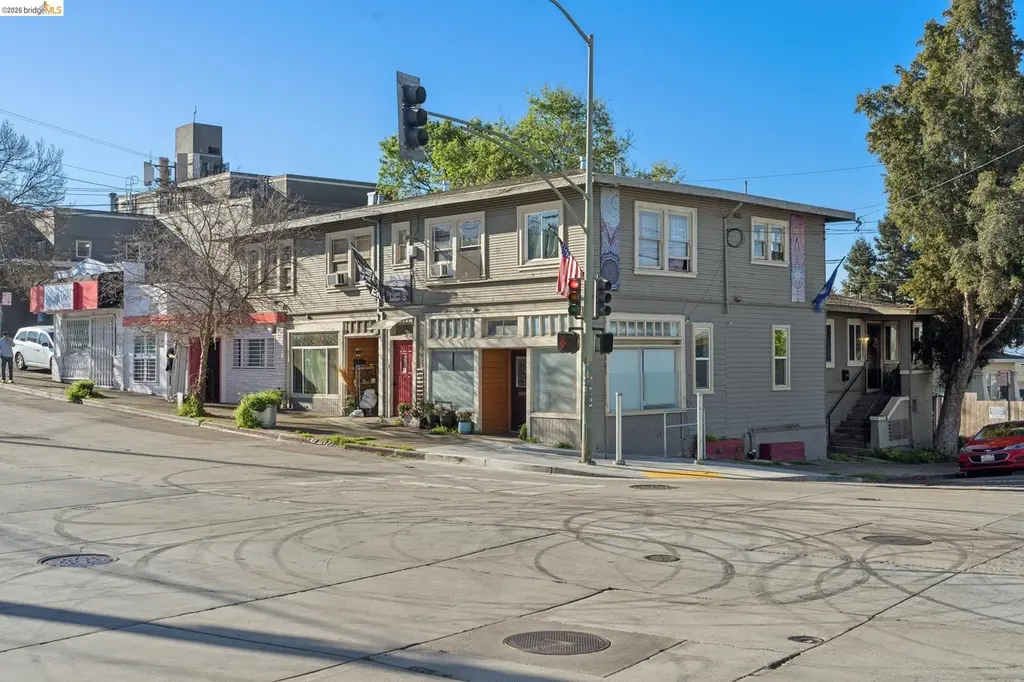
3558 Maple Ave · Oakland, CA
Flood risk No data
- FEMA flood zone
- —
- Chance of flooding over 30 yrs
- —
- Est. flood insurance / yr
- —
Fire risk No data
- Est. fire insurance / yr
- —
Heat risk No data
- Hot days now (above threshold)
- —
- Hot days in 30 yrs
- —
Wind risk No data
- Chance of severe wind over 30 yrs
- —
Air-quality risk No data
- Unhealthy air days now
- —
- Unhealthy air days in 30 yrs
- —
Risk factors via First Street. Map © Google.
Why this score? — see what drove the C- grade
The composite is a weighted blend of 9 inputs, each scored 0–100. Each bar is that input's sub-score; the figure is the points it added to the 100-point composite (weight × sub-score).
- Cash flow +25.2/30.0
- DSCR +8.3/10.0
- 1% rule +6.6/10.0
- Rent growth +3.9/5.0
- Livability +3.6/5.0
- Schools +3.0/10.0
- Condition / age +2.2/5.0
- ARV discount +0.0/15.0
- Appreciation +0.0/10.0
$1,499,000
🖨 Deal sheet (PDF) 📄 Offer letter ✓ Due diligence
Multi-family units
County records classify this as Multi-Family (5+ Unit). Listing-text estimate: 8 units. confirmed
5+ unit building — per-unit beds/baths from public records are typically unavailable; the breakdown below (if shown) is an estimate from the listing text.
Listing remarks MLS
Prime mixed-use investment opportunity in the heart of the Dimond District of Oakland. This well-positioned 8-unit property generates approximately $115,000 in annual income and offers a diverse unit mix, including three studio apartments, two 2 bed/1 bath units, one 3 bed/1 bath apartment, a detached 3 bed/1 bath house, and a restaurant space providing strong commercial exposure. Situated in a vibrant, high-traffic corridor, the property benefits from steady residential demand and established local businesses. The varied unit mix creates multiple income streams and long-term upside potential through rental growth and potential repositioning. Ideal for investors seeking a stable asset in a sought-after neighborhood with a strong community feel, walkability, and convenient access to shops, dining, and transportation. A rare opportunity to own a versatile, income-producing asset in one of Oakland’s most desirable districts.
Key facts
- 7,112 sq ft lot
- Built 1919
- Listed 86 days
Neighborhood map
What this means for you Summary
Snapshot
- This is a 3×1bd/1ba + 2×2bd/1ba + 2×3bd/1ba units multifamily listed at $1.50M. Condition is rated fair.
Deal economics
- At list price, monthly cash flow is $3k ($40k/yr) — positive. Per door: $420/mo.
- The deal already cash-flows at list — no discount required.
- Meets the 1% rule at list price ($17k rent vs $1.50M).
- Recommended offer: $1.41M (6.0% below list) — sets the bar for market timing.
- Cap rate 9.0% vs local median 2.4% in Oakland — top-decile yield for the area; either an underpriced asset or a hidden risk that comps aren't pricing in. Stress-test before assuming the spread holds.
Location & tenants
- Location reads 71/100 on livability (#224 in CA) — a middle-class / working-renter tenant base. Strengths: amenities A+, commute A+, employment A+; Watch: schools C-, crime F, cost of living F.
- Oakland Unified (urban): math 27% / reading 33% proficiency, ranked #1,007 of 1,400 in CA (top 72%) — families likely to look elsewhere, expect single-tenant / working-renter base with shorter leases; 68% free/reduced lunch — lower-income household profile, screen leases tightly.
- Market conditions: Rents rising fast (+5.5%/yr); 111 active listings in the ZIP; high-income renter base; 1,742 units permitted in Alameda County in 2024 (856 in 5+ unit buildings).
- At $17,364/mo this rent would consume 170% of the median local household income ($122k/yr) (locally 1018% of renters already pay >50% of income on rent) — very limited rent-growth headroom before tenants either downsize or default.
Forward outlook
- Local home prices are declining (-3.0%/yr); year-one equity from $10k of loan paydown is wiped out by about $45k of value loss. Plan a longer hold.
- Alameda County population projected at +34% by 2050 — long-run rental-demand tailwind backs the buy-and-hold thesis.
- At projected returns (-3.0% appreciation + 5.5% rent growth), your $420k cash investment doubles in ~9 years — after that, you're playing with house money.
Negotiation context
- It's been on market 86 days — a 6% lower offer ($1.41M) is reasonable based on typical stale-listing flexibility.
Risks & watch-outs
- Watch-outs: built in 1919 — expect roof / HVAC / electrical / plumbing capex.
Questions for the listing agent
- It's been on market 86 days. Have you received any prior offers? Is the seller open to a 6% concession, seller financing, or rate buy-down credit?
- Can we see the unit-by-unit rent roll, current vacancy, and any below-market leases? What's the average tenancy length?
- What capital expenditures (roof, boiler, parking lot, exteriors) have been made in the last 5 years, and what's planned in the next 2?
- Have any recent inspections been done? Can we get a copy of the seller's disclosures and any deferred-maintenance estimates?
- Built in 1919 — when were the roof, HVAC, electrical panel, plumbing, and water heater last replaced?
- Why hasn't it sold? Are there any deal-killer items the seller is aware of (foundation, flood, title, zoning, code violations)?
- Is there a deadline driving the sale (1031 exchange, divorce, estate, relocation)? That informs how much negotiation room exists.
- Crime grade is F in this area — have there been break-ins, vandalism, or insurance claims at this property in the last 3 years? What carrier currently insures it and at what premium?
- What's the average days-on-market for RENTAL listings here right now (not sales)? A rising rental-DOM trend means longer vacancies and softer asking-rent achievability than the comps imply.
- What's the recent tenant-quality profile in this submarket — average credit score on applications, eviction rate, late-payment / NSF rate, and stable-employment percentage? A property-management company in the area should have these aggregated.
- How much new apartment / multifamily construction is in the pipeline within 1–3 miles? Heavy new supply (>2% of stock underway) typically softens rents 12–24 months out; light construction supports rent growth.
Investment metrics
- 1% rule
- 1.16% ✓
- Cap rate
- 8.98%
- Cash-on-cash
- 9.60%
- DSCR
- 1.43
- GRM
- 7.2
CMA / ARV
- ARV (median comp)
- $1,042,595
- List price
- $1,499,000
- Delta
- 43.78%
- Verdict
- OVERPRICED
- Comps
- 20 within 1.0 mi
Show comp detail 5 sales within ~0.75 mi
| Address | Dist | Beds/Ba | Sqft | Sold | Price | $/sf | Match |
|---|---|---|---|---|---|---|---|
| 2849 Delaware St | 0.22mi | 8/5.0 | 4,506 (-12%) | 14mo | $1,005,000 | $223 | 58 |
| 3300 Brookdale Ave | 0.58mi | 9/— | 5,453 (+6%) | 6mo | $1,025,000 | $188 | 57 |
| 3700 Lincoln Ave | 0.48mi | 31/16.0 | 5,610 (+9%) | 11mo | $985,000 | $176 | 52 |
| 2924 Carmel St | 0.33mi | 9/5.0 | 4,530 (-12%) | 16mo | $1,775,000 | $392 | 52 |
| 3675 39th Ave | 0.65mi | —/— | 5,340 (+4%) | 15mo | $1,250,000 | $234 | 50 |
Match score weights: distance 35% · size 25% · config 20% · recency 20%. Top-matched comps best support the ARV.
Projected returns pro-forma
-3.0% appreciation · 5.5% rent growth · sell at horizon
- IRR
- 1.0%
- Equity multiple
- 1.04×
- Total profit
- $16,019
- Equity at exit
- $223,506
- IRR
- 13.0%
- Equity multiple
- 2.15×
- Total profit
- $483,796
- Equity at exit
- $129,606
Cash invested: $419,720 (down + closing). Projections, not guarantees.
Landlord ↔ Tenant lean methodology
- Overall (CITY)
- 0 Strongly Tenant-Friendly
- State California
- 18 Strongly Tenant-Friendly · D+13
- County
- — inherits STATE
- City Oakland
- 0 Strongly Tenant-Friendly · D+62
ZIP-level market 94602
- Rents YoY
- 5.5%
- Active inventory
- 111
- Price-to-rent
- 60.5×
Monthly cashflow live
- Estimated rent
- $17,364 high interval (Pro) →
- Mortgage (P&I)
- −$7,861
- Tax est. 1.5%
- −$1,874 /mo · $22,485/yr
- Insurance
- −$625
- HOA
- −$0
- Vacancy / Maint / Mgmt
- −$3,646
- Net cashflow
- $3,358
Break-even live
Sensitivity live
| Price | -10% $4,394 | -5% $3,876 | +0% $3,358 | +5% $2,840 | +10% $2,322 |
|---|---|---|---|---|---|
| Rent | -10% $1,987 | -5% $2,672 | +0% $3,358 | +5% $4,044 | +10% $4,730 |
| Rate | -1.0pp $4,113 | -0.5pp $3,740 | base $3,358 | +0.5pp $2,970 | +1.0pp $2,575 |
8-unit breakdown (identical units grouped — click to expand)
| Units | Beds | Baths | Est. rent |
|---|---|---|---|
| 3× units | 1 | 1 | $6,195 |
| #1 | 1 | 1 | $2,065 |
| #2 | 1 | 1 | $2,065 |
| #3 | 1 | 1 | $2,065 |
| 2× units | 2 | 1 | $4,346 |
| #4 | 2 | 1 | $2,173 |
| #5 | 2 | 1 | $2,173 |
| 2× units | 3 | 1 | $4,798 |
| #6 | 3 | 1 | $2,399 |
| #7 | 3 | 1 | $2,399 |
| 1× unit | 0 | 0 | $2,024 |
| Total (8 units) | $17,364 | ||
UW: 25.0% down · 7.5% · 30yr · 1.5% tax · 5.0% vac · 8.0% maint · 8.0% mgmt
Financing live
Cash to close
- Down payment
- $374,750
- Closing costs
- $44,970
- Reserves months
- —
- Total cash needed
- —
Loan-product check · same deal, 3 products live
Conventional
25% down · 7.5% · 30yr
- Down + closing
- —
- Monthly P&I
- —
- Monthly cashflow
- —
- DSCR
- —
- Eligible?
- —
Personal DTI + credit; lowest rate.
DSCR
20% down · 8.5% · 30yr
- Down + closing
- —
- Monthly P&I
- —
- Monthly cashflow
- —
- DSCR
- —
- Eligible?
- —
No personal income docs; deal must DSCR.
Hard money
10% down · 12.0% · 12mo
- Down + closing
- —
- Monthly P&I
- —
- Monthly cashflow
- —
- DSCR
- —
- Eligible?
- —
Short-term bridge; refi at stabilization.
Listing history 16 events
-
2026-06-18days on market $1,499,000 Active 86 DOM
-
2026-06-17days on market $1,499,000 Active 85 DOM
-
2026-06-16days on market $1,499,000 Active 84 DOM
-
2026-06-15days on market $1,499,000 Active 83 DOM
-
2026-06-13days on market $1,499,000 Active 81 DOM
-
2026-06-13days on market $1,499,000 Active 80 DOM
-
2026-06-09days on market $1,499,000 Active 77 DOM
-
2026-06-08days on market $1,499,000 Active 76 DOM
-
2026-06-07days on market $1,499,000 Active 75 DOM
-
2026-06-04days on market $1,499,000 Active 72 DOM
-
2026-06-03days on market $1,499,000 Active 71 DOM
-
2026-06-02days on market $1,499,000 Active 70 DOM
-
2026-06-01days on market $1,499,000 Active 69 DOM
-
2026-05-31days on market $1,499,000 Active 68 DOM
-
2026-05-13price $1,499,000 943-char remark
Show marketing remark (943 chars)
Prime mixed-use investment opportunity in the heart of the Dimond District of Oakland. This well-positioned 8-unit property generates approximately $115,000 in annual income and offers a diverse unit mix, including three studio apartments, two 2 bed/1 bath units, one 3 bed/1 bath apartment, a detached 3 bed/1 bath house, and a restaurant space providing strong commercial exposure. Situated in a vibrant, high-traffic corridor, the property benefits from steady residential demand and established local businesses. The varied unit mix creates multiple income streams and long-term upside potential through rental growth and potential repositioning. Ideal for investors seeking a stable asset in a sought-after neighborhood with a strong community feel, walkability, and convenient access to shops, dining, and transportation. A rare opportunity to own a versatile, income-producing asset in one of Oakland’s most desirable districts.
-
2026-03-24$1,598,000 Active 943-char remark
Show marketing remark (943 chars)
Prime mixed-use investment opportunity in the heart of the Dimond District of Oakland. This well-positioned 8-unit property generates approximately $115,000 in annual income and offers a diverse unit mix, including three studio apartments, two 2 bed/1 bath units, one 3 bed/1 bath apartment, a detached 3 bed/1 bath house, and a restaurant space providing strong commercial exposure. Situated in a vibrant, high-traffic corridor, the property benefits from steady residential demand and established local businesses. The varied unit mix creates multiple income streams and long-term upside potential through rental growth and potential repositioning. Ideal for investors seeking a stable asset in a sought-after neighborhood with a strong community feel, walkability, and convenient access to shops, dining, and transportation. A rare opportunity to own a versatile, income-producing asset in one of Oakland’s most desirable districts.
ⓘ Source: listings_history table (triggers on properties + properties_extension) + one-shot
backfill from property_details.listing_events for pre-trigger history.
Nearby sold comps map
Loading sold comps map…
Walkable amenities ~0.75 mi
Loading nearby amenities…
Taxation est. · year 1
- Rental income
- $208,368
- − Mortgage interest
- −$83,967
- − Property taxes
- −$22,485
- − Insurance
- −$7,495
- − Repairs & maintenance
- −$16,669
- − Management
- −$16,669
- − Depreciation
- −$43,607
- Taxable income
- $17,475
- Est. tax owed @ 24.0%
- −$4,194
- After-tax cash flow
- $36,106/yr
For passive investors: Depreciation is non-cash, so a rental often shows a tax loss while cash-flowing — sheltering income. Rental losses are passive: they offset passive income freely, and up to $25,000/yr can offset ordinary (W-2) income if you actively participate and your MAGI is under $100k (phasing out to $0 by $150k); unused losses carry forward. On sale, claimed depreciation is recaptured at up to 25%, and gains may owe capital-gains tax (a 1031 exchange can defer both). Figures are a year-1 estimate at your 24.0% rate — not tax advice; consult a CPA.
Condition & rehab AI · 12 photos
This multi-family property requires moderate repairs and maintenance to improve its condition and value. Key areas for improvement include painting, updating interior walls, and replacing worn carpet. The property has a diverse unit mix and generates steady income, making it a solid investment opportunity.
Repairs flagged
- Minor Kitchen cabinets — Cabinets appear slightly worn
- Minor Bathroom fixtures — Fixtures appear slightly worn
- Moderate Exterior siding — Siding appears weathered
- Moderate Carpeted stairs — Carpet appears worn
- Moderate Paint — Paint appears chipped and worn
Value-add opportunities
- Both Paint and update interior walls — Fresh paint and updated walls can improve both resale and rental value
- Both Replace worn carpet — New carpet can improve both resale and rental value
- Both Clean and organize kitchen and bathrooms — A clean and organized space can improve both resale and rental value
Renovation cost estimate screening
| Repair item | Severity | Est. cost |
|---|---|---|
| Kitchen cabinets · Cabinets appear slightly worn | Minor | $500–3,000 |
| Bathroom fixtures · Fixtures appear slightly worn | Minor | $500–3,000 |
| Exterior siding · Siding appears weathered | Moderate | $3,000–15,000 |
| Carpeted stairs · Carpet appears worn | Moderate | $3,000–15,000 |
| Paint · Paint appears chipped and worn | Moderate | $3,000–15,000 |
| Total estimated repair cost · 5 items | $10,000–51,000 |
Value-add ROI direction
- Both Paint and update interior walls — Fresh paint and updated walls can improve both resale and rental value ↑
- Both Replace worn carpet — New carpet can improve both resale and rental value ↑
- Both Clean and organize kitchen and bathrooms — A clean and organized space can improve both resale and rental value ↑
ⓘ Cost ranges are severity-bucket heuristics (US national rule-of-thumb). Get contractor quotes + a written scope before underwriting a rehab budget.
Schools (NCES district)
- District
- Oakland Unified
- NCES district ID
- 0628050
- Math proficiency
- 27% ▬ 0.00%
- Reading proficiency
- 33% ▬ 0.00%
- Median HH income
- $55,194
- Composite
- 29.52/100
- National rank
- #11769
- State rank
- #1007 of 1400 in CA
Livability — Oakland
- Score
- 71/100
- State rank
- #224
- US rank
- #7245
Category grades
Schools grade is shown separately in the Schools card above.
Census & demographics
- Census place
- Oakland, CA
- County
- Alameda County · 1,614,355 people
- City population
- 385,993
- Metro
- San Francisco-Oakland-Berkeley, CA
- Population (ZIP)
- 31,759
- Household income
- $122,263
- Rent vs Own
- Severe rent burden
- 1018.0
Population outlook (Alameda County) Hauer SSP2
- Today (2025)
- 1,928,884 people
- By 2030
- 2,069,146 · +7.3%
- By 2040
- 2,338,405 · +21.2%
- By 2050
- 2,586,608 · +34.1%
- By 2075
- 3,061,911 · +58.7%
- By 2100
- 3,234,133 · +67.7%
Race, ethnicity, and origin ACS 2023
- Neighborhood character
- Highly diverse neighborhood (Simpson 0.75)
- Race & ethnicity
- White 41% Hispanic / Latino 20% Asian 16% Black 15% Two or more races 11% Pacific Islander 1%
- Hispanic origin (detail)
- Mexican 11% Puerto Rican 2%
- Common ancestry
- Italian 3% Lithuanian 2% Romanian 1%
- Foreign-born
- 24% · Canada, China, Vietnam
- Languages at home
- 67% English-only · Spanish 14% Chinese 8% Other Asian/Pacific 2%
Political lean MEDSL · Alameda
- 2024 margin
- Solid D (+53.6) · D 74.6% · R 21.0% · Other 4.4%
- 2008→2024 swing
- -5.9pp toward R · 2008: 59.5pp · 2024: 53.6pp
- All cycles
- 2024: D+53.6 2020: D+62.5 2016: D+64.4 2012: D+59.8 2008: D+59.5
Not yet ingested
- Civics
- —
Market trends
- HPI YoY
- ▼ -1108.77%
- Current HPI
- 275.7267
- Rent YoY
- ▲ 5.50%
- Metro
- San Francisco-Oakland-Berkeley, CA
- State GDP YoY
- ▲ 3.21%
- F500 in state
- 116
Industry mix (Fortune 500 HQ in CA)
| Industry | F500 HQs | Revenue |
|---|---|---|
| Technology | 27 | $1,492B |
|
||
| Financial Services | 3 | $174B |
|
||
| Retail | 3 | $44B |
|
||
| Insurance | 3 | $26B |
|
||
| Media / Entertainment | 2 | $115B |
|
||
| Pharmaceuticals / Biotech | 2 | $62B |
|
||
Price history
-6.2% since first listed2 events — show timeline
- 2026-05-13 Price Changed $1,499,000 bridgeMLS, Bay East AOR, or Contra Costa AOR
- 2026-03-24 Listed $1,598,000 bridgeMLS, Bay East AOR, or Contra Costa AOR
Cash-flow waterfall
monthlySold comps — $/sqft
last 12 mo · ≤1 miLoading sold comps…