4742 Legacy Point Von · San Antonio, TX
Flood risk No data
- FEMA flood zone
- —
- Chance of flooding over 30 yrs
- —
- Est. flood insurance / yr
- —
Fire risk No data
- Est. fire insurance / yr
- —
Heat risk No data
- Hot days now (above threshold)
- —
- Hot days in 30 yrs
- —
Wind risk No data
- Chance of severe wind over 30 yrs
- —
Air-quality risk No data
- Unhealthy air days now
- —
- Unhealthy air days in 30 yrs
- —
Risk factors via First Street. Map © Google.
Why this score? — see what drove the C- grade
The composite is a weighted blend of 9 inputs, each scored 0–100. Each bar is that input's sub-score; the figure is the points it added to the 100-point composite (weight × sub-score).
- Cash flow +15.3/30.0
- ARV discount +8.7/15.0
- Appreciation +6.3/10.0
- DSCR +4.7/10.0
- 1% rule +4.2/10.0
- Livability +4.0/5.0
- Condition / age +4.0/5.0
- Rent growth +2.5/5.0
- Schools +2.2/10.0
$183,999
🖨 Deal sheet (PDF) 📄 Offer letter ✓ Due diligence
Listing remarks
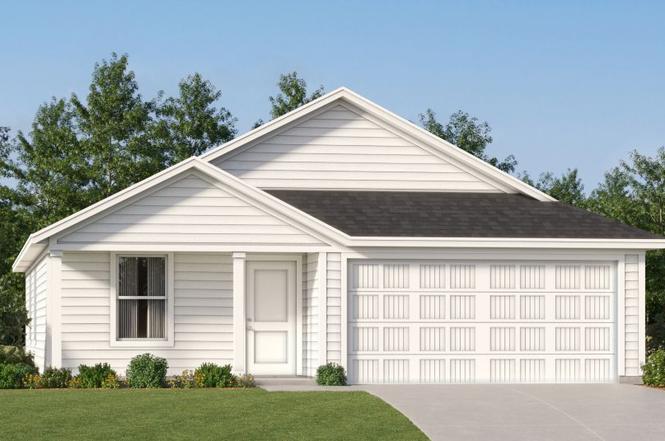
This new home is conveniently laid out on a single floor for maximum comfort and convenience. At its heart stands an open-concept layout connecting a spacious family room, a multi-functional kitchen and lovely dining area. The owner's suite is situated in a private corner and comes complete with an adjoining bathroom, while the two secondary bedrooms are located near the foyer.
Key facts
- Lovely dining area
- Private corner
- Adjoining bathroom
Tags
Property features AI
Finance
- Financial info: List price $182,999
Exterior
- Parking: 2 garage spaces (2 total parking spaces)
- Home design: Single-family specification (spec) home; Beckman floor plan
- Exterior features: Address: 4742 Legacy Point Von, Von Ormy, TX 78073
Interior
- Bedrooms: 3 bedrooms
- Bathrooms: 2 full bathrooms
- Interior features: Spec home, Beckman plan; Living area of 1260
Neighborhood map
What this means for you Summary
Snapshot
- This is a 3-bed/2.0-bath single-family listed at $184k. Condition is rated good.
Deal economics
- At list price, monthly cash flow is $66 ($788/yr) — positive.
- The deal already cash-flows at list — no discount required.
- To meet the 1% rule (rent ≥ 1% of price), the offer needs to be $169k (8.0% below list).
- Recommended offer: $169k (8.0% below list) — sets the bar for 1% rule.
- Cap rate 6.7% vs local median 3.8% in San Antonio — top-decile yield for the area; either an underpriced asset or a hidden risk that comps aren't pricing in. Stress-test before assuming the spread holds.
Location & tenants
- Location reads 80/100 on livability (#31 in TX, #1,616 nationally) — a professional / high-income tenant draw. Strengths: amenities A+, commute A+, cost of living A+; Watch: schools C-, crime F.
- Southwest ISD (rural): math 21% / reading 31% proficiency, ranked #701 of 826 in TX (top 85%) — low school quality limits family demand, transient renter base, plan for 1-2y turnover; 75% free/reduced lunch — lower-income household profile, screen leases tightly.
- Market conditions: 325 active listings in the ZIP; 7 comparable units currently listed for rent nearby; rentals at typical pace (median 25d on market — plan ~3-4 weeks tenant-placement turnaround); 8,308 units permitted in Bexar County in 2024 (2,506 in 5+ unit buildings).
Forward outlook
- In year one you build about $6k of equity ($1k loan paydown + $5k appreciation (2.6% local appreciation)).
- Bexar County population projected at +50% by 2050 — long-run rental-demand tailwind backs the buy-and-hold thesis.
- At projected returns (2.6% appreciation + 3.0% rent growth), your $52k cash investment doubles in ~7 years — after that, you're playing with house money.
- By year 6, paydown + projected appreciation supports a ~$32k cash-out refi (75% LTV) — recoverable capital for the next deal without selling this one.
Negotiation context
- Only 8 days on market — expect competitive offers; lowballing is unlikely to land.
Questions for the listing agent
- Is there a deadline driving the sale (1031 exchange, divorce, estate, relocation)? That informs how much negotiation room exists.
- Crime grade is F in this area — have there been break-ins, vandalism, or insurance claims at this property in the last 3 years? What carrier currently insures it and at what premium?
- What's the average days-on-market for RENTAL listings here right now (not sales)? A rising rental-DOM trend means longer vacancies and softer asking-rent achievability than the comps imply.
- What's the recent tenant-quality profile in this submarket — average credit score on applications, eviction rate, late-payment / NSF rate, and stable-employment percentage? A property-management company in the area should have these aggregated.
- How much new for-sale + rental construction is in the pipeline within 1–3 miles? Heavy new supply typically softens prices + rents 12–24 months out; constrained supply supports both.
Investment metrics
- 1% rule
- 0.92% ✗
- Cap rate
- 6.72%
- Cash-on-cash
- 1.53%
- DSCR
- 1.07
- GRM
- 9.1
CMA / ARV
- ARV (on-the-fly)
- $189,000
- Comps found
- 12
Show comp detail 12 sales within ~0.75 mi
| Address | Dist | Beds/Ba | Sqft | Sold | Price | $/sf | Match |
|---|---|---|---|---|---|---|---|
| 4635 Legacy Trl | 0.15mi | 3/2.0 | 1,260 (0%) | 3mo | $188,999 | $150 | 91 |
| 4702 Legacy Trl | 0.11mi | 3/2.0 | 1,260 (0%) | 5mo | $191,999 | $152 | 91 |
| 4623 Legacy Trl | 0.17mi | 3/2.0 | 1,260 (0%) | 2mo | $180,999 | $144 | 90 |
| 4611 Legacy Trl | 0.20mi | 3/2.0 | 1,260 (0%) | 0mo | $174,999 | $139 | 90 |
| 4614 Legacy Trl | 0.18mi | 3/2.0 | 1,260 (0%) | 2mo | $179,999 | $143 | 90 |
| 4630 Legacy Trl | 0.15mi | 3/2.0 | 1,260 (0%) | 5mo | $204,999 | $163 | 89 |
| 4603 Legacy Pt | 0.19mi | 3/2.0 | 1,260 (0%) | 4mo | $208,999 | $166 | 87 |
| 12926 Bone Dry Ln | 0.31mi | 3/2.0 | 1,245 (-1%) | 2mo | $182,931 | $147 | 82 |
| 12914 Bone Dry Ln | 0.32mi | 3/2.0 | 1,245 (-1%) | 6mo | $193,727 | $156 | 78 |
| 12931 Bone Dry Ln | 0.40mi | 3/2.0 | 1,242 (-1%) | 6mo | $216,009 | $174 | 74 |
| 12930 Bone Dry Ln | 0.32mi | 3/2.5 | 1,389 (+10%) | 5mo | $197,125 | $142 | 62 |
| 12907 Jeopardy Ave | 0.36mi | 2/2.5 (-1) | 1,389 (+10%) | 4mo | $203,898 | $147 | 56 |
Match score weights: distance 35% · size 25% · config 20% · recency 20%. Top-matched comps best support the ARV.
Projected returns pro-forma
2.6% appreciation · 3.0% rent growth · sell at horizon
- IRR
- 7.8%
- Equity multiple
- 1.44×
- Total profit
- $22,519
- Equity at exit
- $78,632
- IRR
- 10.7%
- Equity multiple
- 2.54×
- Total profit
- $79,238
- Equity at exit
- $118,084
Cash invested: $51,520 (down + closing). Projections, not guarantees.
Landlord ↔ Tenant lean methodology
- Overall (STATE)
- 87 Strongly Landlord-Friendly
- State Texas
- 87 Strongly Landlord-Friendly · R+5
- County
- — inherits STATE
- City
- — inherits STATE
ZIP-level market 78073
- Home prices YoY
- 0.9%
- Active inventory
- 325
- Price-to-rent
- 9.1×
Monthly cashflow live
- Estimated rent
- $1,693 high interval (Pro) →
- Mortgage (P&I)
- −$965
- Tax est. 1.5%
- −$230 /mo · $2,760/yr
- Insurance
- −$77
- HOA
- −$0
- Vacancy / Maint / Mgmt
- −$355
- Net cashflow
- $66
Break-even live
Sensitivity live
| Price | -10% $193 | -5% $129 | +0% $66 | +5% $2 | +10% $-61 |
|---|---|---|---|---|---|
| Rent | -10% $-68 | -5% $-1 | +0% $66 | +5% $133 | +10% $199 |
| Rate | -1.0pp $158 | -0.5pp $112 | base $66 | +0.5pp $18 | +1.0pp $-30 |
UW: 25.0% down · 7.5% · 30yr · 1.5% tax · 5.0% vac · 8.0% maint · 8.0% mgmt
Financing live
Cash to close
- Down payment
- $46,000
- Closing costs
- $5,520
- Reserves months
- —
- Total cash needed
- —
Loan-product check · same deal, 3 products live
Conventional
25% down · 7.5% · 30yr
- Down + closing
- —
- Monthly P&I
- —
- Monthly cashflow
- —
- DSCR
- —
- Eligible?
- —
Personal DTI + credit; lowest rate.
DSCR
20% down · 8.5% · 30yr
- Down + closing
- —
- Monthly P&I
- —
- Monthly cashflow
- —
- DSCR
- —
- Eligible?
- —
No personal income docs; deal must DSCR.
Hard money
10% down · 12.0% · 12mo
- Down + closing
- —
- Monthly P&I
- —
- Monthly cashflow
- —
- DSCR
- —
- Eligible?
- —
Short-term bridge; refi at stabilization.
Rent comps 7 comps
| Address | Beds | Baths | Sqft | Rent | $/sqft | DOM | Units | Dist |
|---|---|---|---|---|---|---|---|---|
| 4839 Legacy Pt Von Ormy, TX | 4.0 | 2.0 | 1668 | $1,795 | $1.08 | 22d | 1 | 0.12mi |
| 4606 Legacy Trl Von Ormy, TX | 4.0 | 2.0 | 1668 | $1,695 | $1.02 | 5d | 1 | 0.18mi |
| 13139 Watson Rd Von Ormy, TX | 1.0–4.0 | 1.0–2.0 | 1017 | $1,617 | $1.59 | 3d | 1 | 0.44mi |
| 12955 Fischer Rd Von Ormy, TX | 1.0–4.0 | 1.0–2.0 | 1056 | $1,357 | $1.28 | 24d | 1 | 0.62mi |
| 11835 Adoring Way Von Ormy, TX | 4.0 | 2.0 | 1600 | $1,800 | $1.12 | 44d | 1 | 1.25mi |
| 11815 Adoring Way Von Ormy, TX | 4.0 | 2.0 | 1600 | $1,750 | $1.09 | 44d | 1 | 1.28mi |
| 6002 Sliding Way Von Ormy, TX | 3.0 | 2.0 | 1402 | $1,425 | $1.02 | 24d | 1 | 1.31mi |
Listing history 6 events
-
2026-06-18days on market $183,999 Active 8 DOM
-
2026-06-17days on market $183,999 Active 7 DOM
-
2026-06-16days on market $183,999 Active 6 DOM
-
2026-06-15pricedays on market $183,999 Active 5 DOM
-
2026-06-13remarks 380-char remark
-
2026-06-13$182,999 Active 3 DOM
ⓘ Source: listings_history table (triggers on properties + properties_extension) + one-shot
backfill from property_details.listing_events for pre-trigger history.
Nearby sold comps map
Loading sold comps map…
Walkable amenities ~0.75 mi
Loading nearby amenities…
Taxation est. · year 1
- Rental income
- $20,313
- − Mortgage interest
- −$10,307
- − Property taxes
- −$2,760
- − Insurance
- −$920
- − Repairs & maintenance
- −$1,625
- − Management
- −$1,625
- − Depreciation
- −$5,353
- Taxable loss
- −$2,277
- Est. tax savings @ 24.0%
- +$546
- After-tax cash flow
- $1,335/yr
For passive investors: Depreciation is non-cash, so a rental often shows a tax loss while cash-flowing — sheltering income. Rental losses are passive: they offset passive income freely, and up to $25,000/yr can offset ordinary (W-2) income if you actively participate and your MAGI is under $100k (phasing out to $0 by $150k); unused losses carry forward. On sale, claimed depreciation is recaptured at up to 25%, and gains may owe capital-gains tax (a 1031 exchange can defer both). Figures are a year-1 estimate at your 24.0% rate — not tax advice; consult a CPA.
Condition & rehab AI · 13 photos
This single-story home features a modern open-concept layout with good condition and minimal repairs needed. It's move-in ready with a fresh exterior paint job and clean windows enhancing its curb appeal and rental value.
Value-add opportunities
- Resale Paint exterior — Enhances curb appeal
- Rental Clean windows — Improves natural light and air circulation
Renovation cost estimate screening
Value-add ROI direction
- Resale Paint exterior — Enhances curb appeal ↑
- Rental Clean windows — Improves natural light and air circulation ↑
ⓘ Cost ranges are severity-bucket heuristics (US national rule-of-thumb). Get contractor quotes + a written scope before underwriting a rehab budget.
Schools (NCES district)
- District
- Southwest ISD
- NCES district ID
- 4840950
- Math proficiency
- 21% ▼ -21.00%
- Reading proficiency
- 31% ▼ -5.00%
- Median HH income
- $43,362
- Composite
- 22.22/100
- National rank
- #8153
- State rank
- #701 of 826 in TX
Livability — San Antonio
- Score
- 80/100
- State rank
- #31
- US rank
- #1616
Category grades
Schools grade is shown separately in the Schools card above.
Census & demographics
- Census place
- San Antonio, TX
- City population
- 1,806,925
- Population (ZIP)
- 9,510
Population outlook (Bexar County) Hauer SSP2
- Today (2025)
- 2,336,851 people
- By 2030
- 2,560,728 · +9.6%
- By 2040
- 3,020,569 · +29.3%
- By 2050
- 3,493,522 · +49.5%
- By 2075
- 4,668,459 · +99.8%
- By 2100
- 5,533,242 · +136.8%
Race, ethnicity, and origin ACS 2023
- Neighborhood character
- Predominantly Hispanic (81%)
- Race & ethnicity
- Hispanic / Latino 81% Two or more races 33% White 16%
- Hispanic origin (detail)
- Mexican 75%
- Foreign-born
- 12% · Canada
- Languages at home
- 51% English-only · Spanish 48% German/W. Germanic 1%
Political lean MEDSL · Bexar
- 2024 margin
- Lean D (+9.8) · D 54.3% · R 44.6% · Other 1.1%
- 2008→2024 swing
- +4.2pp toward D · 2008: 5.6pp · 2024: 9.8pp
- All cycles
- 2024: D+9.8 2020: D+18.2 2016: D+13.5 2012: D+4.6 2008: D+5.6
Not yet ingested
- Civics
- —
Market trends
- HPI YoY
- ▲ 2.60%
- Current HPI
- 289.1266
- Rent YoY
- —
- Metro
- —
- State GDP YoY
- ▲ 3.95%
- F500 in state
- 110
Industry mix (Fortune 500 HQ in TX)
| Industry | F500 HQs | Revenue |
|---|---|---|
| Energy | 16 | $1,198B |
|
||
| Technology | 5 | $198B |
|
||
| Engineering / Construction | 4 | $72B |
|
||
| Energy Services | 3 | $60B |
|
||
| Utilities | 3 | $41B |
|
||
| Healthcare | 2 | $330B |
|
||
Cash-flow waterfall
monthlySold comps — $/sqft
last 12 mo · ≤1 miLoading sold comps…