345 Mountain Leader Trail Trl · Tupelo, MS
Flood risk 1/10 · Minimal
- FEMA flood zone
- X (unshaded)
- Chance of flooding over 30 yrs
- 0.0%
- Est. flood insurance / yr
- $507 – $1,088
Fire risk 4/10 · Minor
- Est. fire insurance / yr
- $1,241 – $2,305
Heat risk 6/10 · Moderate
- Hot days now (above 108°F)
- 7 days/yr
- Hot days in 30 yrs
- 21 days/yr
Wind risk 6/10 · Moderate
- Chance of severe wind over 30 yrs
- 27.0%
Air-quality risk 1/10 · Minimal
- Unhealthy air days now
- 0 days/yr
- Unhealthy air days in 30 yrs
- 0 days/yr
Risk factors via First Street. Map © Google.
Why this score? — see what drove the B- grade
The composite is a weighted blend of 9 inputs, each scored 0–100. Each bar is that input's sub-score; the figure is the points it added to the 100-point composite (weight × sub-score).
- Cash flow +30.0/30.0
- 1% rule +10.0/10.0
- DSCR +10.0/10.0
- ARV discount +7.5/15.0
- Livability +3.6/5.0
- Schools +3.0/10.0
- Rent growth +2.5/5.0
- Condition / age +1.0/5.0
- Appreciation +0.0/10.0
$59,900
🖨 Deal sheet 📄 Offer letter ✓ Due diligence
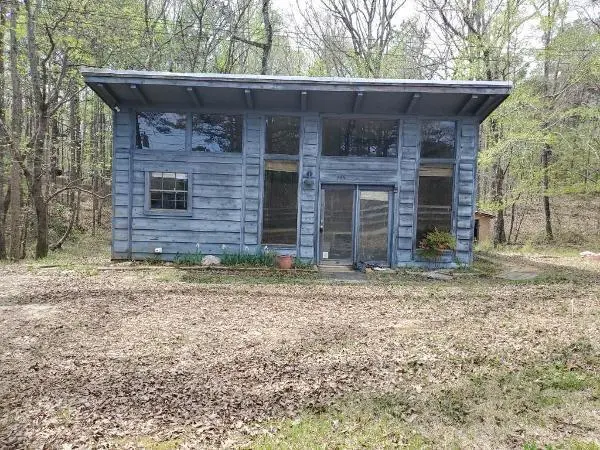
Listing remarks
Cute 1 Bedroom/ 1 bath cabin located on a quiet . 34 acre lot at Lake Piomingo. Home has a large open kitchen & living room area and would be a great weekend get-a-way home. All information deemed reliable. We do not warrant lot size or sqft. Buyers are responsible for verifying all taxes, schools and information before making an offer. . * * Agents see private remarks * *
Key facts
- 0.34 acre lot
- Built 1978
- Listed 12 days
Neighborhood map
What this means for you Summary
Snapshot
- This is a 1-bed/1.0-bath single-family listed at $60k. Condition is rated poor.
Deal economics
- At list price, monthly cash flow is $431 ($5k/yr) — positive.
- The deal already cash-flows at list — no discount required.
- Meets the 1% rule at list price ($1k rent vs $60k).
Location & tenants
- Location reads 72/100 on livability (#26 in MS) — a middle-class / working-renter tenant base. Strengths: cost of living A+, housing A+, health & safety A-; Watch: schools C-, amenities D+, employment D+.
- Lee County School District (rural): math 37% / reading 35% proficiency, ranked #51 of 130 in MS (top 39%) — families likely to look elsewhere, expect single-tenant / working-renter base with shorter leases.
- Market conditions: 172 active listings in the ZIP; 154 units permitted in Lee County in 2024 (24 in 5+ unit buildings).
Forward outlook
- Local home prices are declining (-3.0%/yr); year-one equity from $414 of loan paydown is wiped out by about $2k of value loss. Plan a longer hold.
- Lee County population projected at +6% by 2050 — modest demand growth; plan on rents tracking national, not racing it.
- At projected returns (-3.0% appreciation + 3.0% rent growth), your $17k cash investment doubles in ~4 years — after that, you're playing with house money.
Negotiation context
- Only 12 days on market — expect competitive offers; lowballing is unlikely to land.
Risks & watch-outs
- Climate carrying-cost: major wind risk, 27% chance of damaging wind over 30y; extreme-heat days projected 7→21/yr by 2055 (HVAC capex compounding) — expect insurance premiums to compound above CPI over the hold.
Questions for the listing agent
- Have any recent inspections been done? Can we get a copy of the seller's disclosures and any deferred-maintenance estimates?
- Built in 1978 — when were the roof, HVAC, electrical panel, plumbing, and water heater last replaced?
- What does the HOA fee cover, when was the last increase, and are there any pending special assessments or reserve-fund shortfalls?
- Is there a deadline driving the sale (1031 exchange, divorce, estate, relocation)? That informs how much negotiation room exists.
- Crime grade is F in this area — have there been break-ins, vandalism, or insurance claims at this property in the last 3 years? What carrier currently insures it and at what premium?
- What's the average days-on-market for RENTAL listings here right now (not sales)? A rising rental-DOM trend means longer vacancies and softer asking-rent achievability than the comps imply.
- What's the recent tenant-quality profile in this submarket — average credit score on applications, eviction rate, late-payment / NSF rate, and stable-employment percentage? A property-management company in the area should have these aggregated.
- How much new for-sale + rental construction is in the pipeline within 1–3 miles? Heavy new supply typically softens prices + rents 12–24 months out; constrained supply supports both.
Investment metrics
- 1% rule
- 1.83% ✓
- Cap rate
- 14.93%
- Cash-on-cash
- 30.84%
- DSCR
- 2.37
- GRM
- 4.6
CMA / ARV
No comps found within radius.
Projected returns pro-forma
-3.0% appreciation · 3.0% rent growth · sell at horizon
- IRR
- 25.6%
- Equity multiple
- 2.06×
- Total profit
- $17,778
- Equity at exit
- $8,931
- IRR
- 33.3%
- Equity multiple
- 4.04×
- Total profit
- $50,950
- Equity at exit
- $5,179
Cash invested: $16,772 (down + closing). Projections, not guarantees.
Landlord ↔ Tenant lean methodology
- Overall (STATE)
- 90 Strongly Landlord-Friendly
- State Mississippi
- 90 Strongly Landlord-Friendly · R+11
- County
- — inherits STATE
- City
- — inherits STATE
ZIP-level market 38804
- Active inventory
- 172
- Price-to-rent
- 4.6×
Monthly cashflow live
- Estimated rent
- $1,095 medium interval (Pro) →
- Mortgage (P&I)
- −$314
- Tax est. 1.5%
- −$75 /mo · $898/yr
- Insurance
- −$25
- HOA
- −$20
- Vacancy / Maint / Mgmt
- −$230
- Net cashflow
- $431
Break-even live
UW: 25.0% down · 7.5% · 30yr · 1.5% tax · 5.0% vac · 8.0% maint · 8.0% mgmt
Financing live
Cash to close
- Down payment
- $14,975
- Closing costs
- $1,797
- Reserves months
- —
- Total cash needed
- —
Loan-product check · same deal, 3 products live
Conventional
25% down · 7.5% · 30yr
- Down + closing
- —
- Monthly P&I
- —
- Monthly cashflow
- —
- DSCR
- —
- Eligible?
- —
Personal DTI + credit; lowest rate.
DSCR
20% down · 8.5% · 30yr
- Down + closing
- —
- Monthly P&I
- —
- Monthly cashflow
- —
- DSCR
- —
- Eligible?
- —
No personal income docs; deal must DSCR.
Hard money
10% down · 12.0% · 12mo
- Down + closing
- —
- Monthly P&I
- —
- Monthly cashflow
- —
- DSCR
- —
- Eligible?
- —
Short-term bridge; refi at stabilization.
HOA detail
- Monthly dues
- $20 · $240/yr
Listing history 2 events
-
2026-06-01remarks 382-char remark
-
2026-06-01$59,900 Pending 12 DOM
ⓘ Source: listings_history table (triggers on properties + properties_extension) + one-shot
backfill from property_details.listing_events for pre-trigger history.
Climate risk First Street
- Flood 1/10 Low FEMA zone X (unshaded) · 0% chance over 30 yrs
- Wildfire 4/10 Moderate
- Heat 6/10 Major 7 d/yr ≥108°F today · 21 d/yr by 30 yrs out
- Wind 6/10 Major 27% chance of damaging wind over 30 yrs
- Air quality 1/10 Low 0 unhealthy d/yr today · 0 by 30 yrs out
Nearby sold comps map
Loading sold comps map…
Walkable amenities ~0.75 mi
Loading nearby amenities…
Taxation est. · year 1
- Rental income
- $13,140
- − Mortgage interest
- −$3,355
- − Property taxes
- −$898
- − Insurance
- −$300
- − Repairs & maintenance
- −$1,051
- − Management
- −$1,051
- − HOA
- −$240
- − Depreciation
- −$1,743
- Taxable income
- $4,501
- Est. tax owed @ 24.0%
- −$1,080
- After-tax cash flow
- $4,093/yr
For passive investors: Depreciation is non-cash, so a rental often shows a tax loss while cash-flowing — sheltering income. Rental losses are passive: they offset passive income freely, and up to $25,000/yr can offset ordinary (W-2) income if you actively participate and your MAGI is under $100k (phasing out to $0 by $150k); unused losses carry forward. On sale, claimed depreciation is recaptured at up to 25%, and gains may owe capital-gains tax (a 1031 exchange can defer both). Figures are a year-1 estimate at your 24.0% rate — not tax advice; consult a CPA.
Condition & rehab AI · 11 photos
This property requires extensive repairs and updates to bring it up to a livable condition. Immediate safety and aesthetic improvements are necessary to increase its value.
Repairs flagged
- Major Exposed wiring in kitchen and bathrooms — Safety hazard
- Major Missing hardware in kitchen cabinets — Aesthetic and functionality
- Major Missing fixtures in bathrooms — Aesthetic and functionality
- Major Weathered siding — Structural integrity
- Major Exposed nails — Structural integrity
- Major Worn tile flooring — Aesthetic and functionality
- Major Worn paint on interior walls — Aesthetic
- Major Exposed wiring in HVAC/mechanicals — Safety hazard
Value-add opportunities
- Both Paint interior walls — Enhances aesthetics and value
- Both Replace missing fixtures — Improves functionality and aesthetics
- Both Fix exposed wiring — Ensures safety and functionality
Renovation cost estimate screening
| Repair item | Severity | Est. cost |
|---|---|---|
| Exposed wiring in kitchen and bathrooms · Safety hazard | Major | $15,000–50,000 |
| Missing hardware in kitchen cabinets · Aesthetic and functionality | Major | $15,000–50,000 |
| Missing fixtures in bathrooms · Aesthetic and functionality | Major | $15,000–50,000 |
| Weathered siding · Structural integrity | Major | $15,000–50,000 |
| Exposed nails · Structural integrity | Major | $15,000–50,000 |
| Worn tile flooring · Aesthetic and functionality | Major | $15,000–50,000 |
| Worn paint on interior walls · Aesthetic | Major | $15,000–50,000 |
| Exposed wiring in HVAC/mechanicals · Safety hazard | Major | $15,000–50,000 |
| Total estimated repair cost · 8 items | $120,000–400,000 |
Value-add ROI direction
- Both Paint interior walls — Enhances aesthetics and value ↑
- Both Replace missing fixtures — Improves functionality and aesthetics ↑
- Both Fix exposed wiring — Ensures safety and functionality ↑
ⓘ Cost ranges are severity-bucket heuristics (US national rule-of-thumb). Get contractor quotes + a written scope before underwriting a rehab budget.
Schools (NCES district)
- District
- Lee County School District
- NCES district ID
- 2802550
- Math proficiency
- 37% ▼ -11.00%
- Reading proficiency
- 35% ▼ -6.00%
- Median HH income
- $41,435
- Composite
- 30.38/100
- National rank
- #6253
- State rank
- #51 of 130 in MS
Livability — Tupelo
- Score
- 72/100
- State rank
- #26
- US rank
- #6369
Category grades
Schools grade is shown separately in the Schools card above.
Census & demographics
- County
- Lee County · 52,445 people
- City population
- 46,551
- Metro
- Tupelo, MS
- Population (ZIP)
- 16,693
- Household income
- $64,420
- Rent vs Own
- Severe rent burden
- 642.0
Population outlook (Lee County) Hauer SSP2
- Today (2025)
- 90,253 people
- By 2030
- 92,125 · +2.1%
- By 2040
- 94,914 · +5.2%
- By 2050
- 95,841 · +6.2%
- By 2075
- 94,189 · +4.4%
- By 2100
- 83,736 · -7.2%
Race, ethnicity, and origin ACS 2023
- Neighborhood character
- Majority White (63%)
- Race & ethnicity
- White 63% Black 30% Two or more races 3% Hispanic / Latino 3% Native American 1%
- Common ancestry
- Serbian 3% Slovak 2% Italian 2%
- Foreign-born
- 1%
- Languages at home
- 98% English-only · Spanish 1% Other Indo-European 1%
Political lean MEDSL · Lee
- 2024 margin
- Solid R (+38.8) · D 30.0% · R 68.9% · Other 1.1%
- 2008→2024 swing
- -8.3pp toward R · 2008: -30.5pp · 2024: -38.8pp
- All cycles
- 2024: R+38.8 2020: R+32.5 2016: R+37.7 2012: R+29.0 2008: R+30.5
Not yet ingested
- Civics
- —
Market trends
- HPI YoY
- ▼ -111.19%
- Current HPI
- 172.0153
- Rent YoY
- —
- Metro
- Tupelo, MS
- State GDP YoY
- —
- F500 in state
- 0
Price history
2 events — show timeline
- 2026-06-01 Pending — NEMSBD
- 2026-04-17 Listed $59,900 NEMSBD
Cash-flow waterfall
monthlySold comps — $/sqft
last 12 mo · ≤1 miLoading sold comps…