 🏗️ New Construction
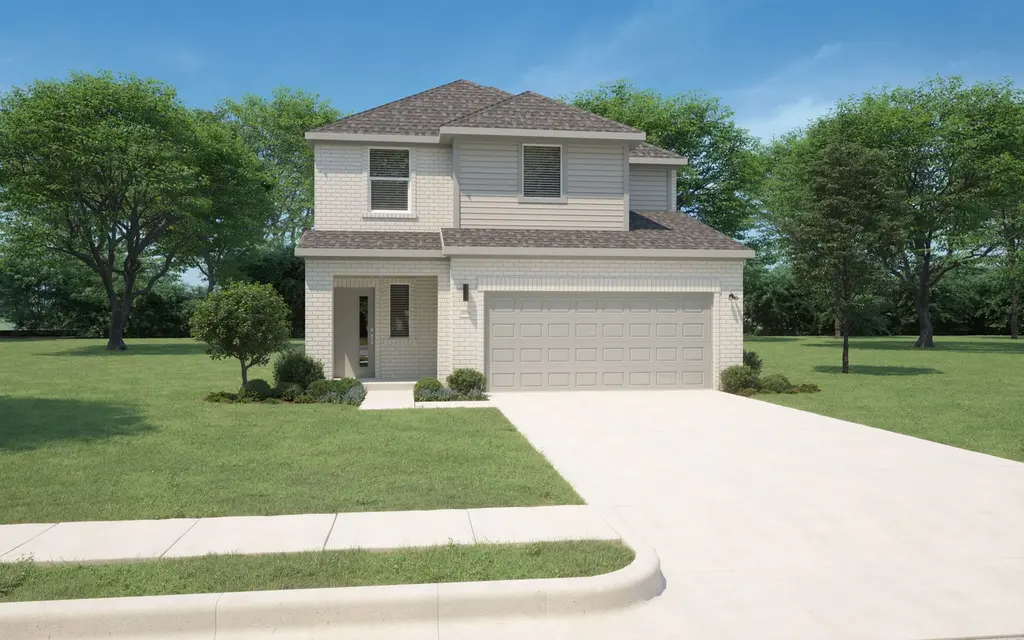
Magnolia Plan · Plum Grove, TX
Flood risk No data
- FEMA flood zone
- —
- Chance of flooding over 30 yrs
- —
- Est. flood insurance / yr
- —
Fire risk No data
- Est. fire insurance / yr
- —
Heat risk No data
- Hot days now (above threshold)
- —
- Hot days in 30 yrs
- —
Wind risk No data
- Chance of severe wind over 30 yrs
- —
Air-quality risk No data
- Unhealthy air days now
- —
- Unhealthy air days in 30 yrs
- —
Risk factors via First Street. Map © Google.
Why this score? — see what drove the F grade
The composite is a weighted blend of 9 inputs, each scored 0–100. Each bar is that input's sub-score; the figure is the points it added to the 100-point composite (weight × sub-score).
- Cash flow +8.9/30.0
- ARV discount +7.5/15.0
- Condition / age +4.0/5.0
- Schools +3.1/10.0
- Livability +2.9/5.0
- 1% rule +2.7/10.0
- DSCR +2.5/10.0
- Rent growth +2.5/5.0
- Appreciation +0.7/10.0
$253,990
🖨 Deal sheet (PDF) 📄 Offer letter ✓ Due diligence
Listing remarks MLS
A floor plan that epitomizes grace and functionality, offering a harmonious blend of classic charm and contemporary comfort - the Magnolia. Designed with meticulous attention to detail, this layout creates an inviting space ideal for both relaxed living and elegant entertaining. In essence, the Magnolia floor plan offers a perfect blend of elegance and everyday convenience, delivering a living experience that is both refined and accommodating. Discover the Magnolia, where timeless beauty meets modern living.
Key facts
- Listed 175 days
Neighborhood map
What this means for you Summary
Snapshot
- This is a 4-bed/2.5-bath single-family listed at $254k. Condition is rated good.
Deal economics
- At list price, monthly cash flow is $-226 ($-3k/yr) — negative.
- To cash-flow at today's rent, offer at most $249k (1.9% below list).
- To meet the 1% rule (rent ≥ 1% of price), the offer needs to be $218k (14.2% below list).
- Recommended offer: $218k (14.2% below list) — sets the bar for 1% rule.
Location & tenants
- Location reads 58/100 on livability (#1,206 in TX) — a working-class tenant base; expect higher turnover. Strengths: crime A+, cost of living A+, housing A+; Watch: amenities F, commute F, health & safety F.
- Huffman ISD (rural): math 32% / reading 35% proficiency, ranked #500 of 826 in TX (top 60%) — families likely to look elsewhere, expect single-tenant / working-renter base with shorter leases.
- Zoned schools: Huffman Middle (math 36% / reading 32%, grade F, #892 of 1,662 statewide, top 55%, 907 students, 42% FRL); Hargrave H S (math 31% / reading 46%, grade F, #866 of 1,632 statewide, top 54%, 1,125 students, 36% FRL) — zoned schools at 39% FRL track the district average.
- Market conditions: 587 active listings in the ZIP; 1 comparable units currently listed for rent nearby; solid renter incomes; 29,883 units permitted in Harris County in 2024 (8,621 in 5+ unit buildings).
Forward outlook
- Local home prices are declining (-3.0%/yr); year-one equity from $2k of loan paydown is wiped out by about $8k of value loss. Plan a longer hold.
- Harris County population projected at +47% by 2050 — long-run rental-demand tailwind backs the buy-and-hold thesis.
Negotiation context
- It's been on market 175 days — a 12% lower offer ($224k) is reasonable based on typical stale-listing flexibility.
Questions for the listing agent
- What do current leases actually rent for vs. the listed asking? Can we see a recent rent roll and the last 12 months of T-12 income?
- It's been on market 175 days. Have you received any prior offers? Is the seller open to a 14% concession, seller financing, or rate buy-down credit?
- Why hasn't it sold? Are there any deal-killer items the seller is aware of (foundation, flood, title, zoning, code violations)?
- Is there a deadline driving the sale (1031 exchange, divorce, estate, relocation)? That informs how much negotiation room exists.
- Schools are F-rated, which usually means shorter tenancies and higher turnover. Who's the typical renter profile here, and what's been the actual vacancy rate?
- The area grade is low — what's the realistic commute time and amenity access for the typical tenant pool here? Any planned neighborhood developments (good or bad) we should know about?
- What's the average days-on-market for RENTAL listings here right now (not sales)? A rising rental-DOM trend means longer vacancies and softer asking-rent achievability than the comps imply.
- What's the recent tenant-quality profile in this submarket — average credit score on applications, eviction rate, late-payment / NSF rate, and stable-employment percentage? A property-management company in the area should have these aggregated.
- How much new for-sale + rental construction is in the pipeline within 1–3 miles? Heavy new supply typically softens prices + rents 12–24 months out; constrained supply supports both.
Investment metrics
- 1% rule
- 0.77% ✗
- Cap rate
- 5.33%
- Cash-on-cash
- -3.43%
- DSCR
- 0.85
- GRM
- 10.8
CMA / ARV
- ARV (median comp)
- $281,885
- List price
- $253,990
- Delta
- -9.90%
- Verdict
- FAIR
- Comps
- 20 within 1.0 mi
Show comp detail 12 sales within ~0.75 mi
| Address | Dist | Beds/Ba | Sqft | Sold | Price | $/sf | Match |
|---|---|---|---|---|---|---|---|
| 1229 Corsica Cliffs Dr | 0.03mi | 4/3.0 | 2,045 (-0%) | 1mo | $284,230 | $139 | 95 |
| 31115 De La Guerra St | 0.10mi | 4/3.0 | 2,045 (-0%) | 2mo | $285,980 | $140 | 91 |
| 1216 Pavia Fields Dr | 0.06mi | 4/3.0 | 2,120 (+3%) | 1mo | $295,990 | $140 | 90 |
| 1202 Peter Pine St | 0.29mi | 4/2.5 | 2,085 (+2%) | 1mo | $355,000 | $170 | 83 |
| 1128 Peter Pine St | 0.32mi | 4/2.5 | 2,027 (-1%) | 1mo | $332,400 | $164 | 82 |
| 31112 De La Guerra | 0.10mi | 4/3.0 | 2,244 (+9%) | 1mo | $279,280 | $124 | 77 |
| 1210 Romany Fields Dr | 0.12mi | 3/2.0 (-1) | 1,941 (-6%) | 2mo | $244,390 | $126 | 77 |
| 1105 Peter Pine St | 0.38mi | 4/2.5 | 2,118 (+3%) | 1mo | $334,000 | $158 | 76 |
| 31028 Perdido Valley Ln | 0.19mi | 4/2.5 | 2,255 (+10%) | 0mo | $239,890 | $106 | 75 |
| 1216 Romany Flds | 0.11mi | 3/2.0 (-1) | 1,857 (-10%) | 2mo | $251,540 | $135 | 70 |
| 1110 Long Leaf Pine St | 0.45mi | 4/2.0 | 1,943 (-6%) | 1mo | $316,000 | $163 | 67 |
| 1042 Gazing Pine St | 0.55mi | 4/2.0 | 1,943 (-6%) | 2mo | $320,000 | $165 | 62 |
Match score weights: distance 35% · size 25% · config 20% · recency 20%. Top-matched comps best support the ARV.
Projected returns pro-forma
-3.0% appreciation · 3.0% rent growth · sell at horizon
- IRR
- -22.0%
- Equity multiple
- 0.24×
- Total profit
- $-60,007
- Equity at exit
- $42,030
- IRR
- -15.9%
- Equity multiple
- 0.11×
- Total profit
- $-70,613
- Equity at exit
- $24,372
Cash invested: $78,928 (down + closing). Projections, not guarantees.
Landlord ↔ Tenant lean methodology
- Overall (STATE)
- 87 Strongly Landlord-Friendly
- State Texas
- 87 Strongly Landlord-Friendly · R+5
- County
- — inherits STATE
- City
- — inherits STATE
ZIP-level market 77336
- Home prices YoY
- -1.8%
- Active inventory
- 587
- Price-to-rent
- 9.7×
Monthly cashflow live
- Estimated rent
- $2,180 medium interval (Pro) →
- Mortgage (P&I)
- −$1,478
- Tax est. 1.5%
- −$352 /mo · $4,228/yr
- Insurance
- −$117
- HOA
- −$0
- Vacancy / Maint / Mgmt
- −$458
- Net cashflow
- $-226
Break-even live
Sensitivity live
| Price | -10% $-31 | -5% $-128 | +0% $-226 | +5% $-323 | +10% $-420 |
|---|---|---|---|---|---|
| Rent | -10% $-398 | -5% $-312 | +0% $-226 | +5% $-139 | +10% $-53 |
| Rate | -1.0pp $-84 | -0.5pp $-154 | base $-226 | +0.5pp $-299 | +1.0pp $-373 |
UW: 25.0% down · 7.5% · 30yr · 1.5% tax · 5.0% vac · 8.0% maint · 8.0% mgmt
Financing live
Cash to close
- Down payment
- $70,471
- Closing costs
- $8,457
- Reserves months
- —
- Total cash needed
- —
Loan-product check · same deal, 3 products live
Conventional
25% down · 7.5% · 30yr
- Down + closing
- —
- Monthly P&I
- —
- Monthly cashflow
- —
- DSCR
- —
- Eligible?
- —
Personal DTI + credit; lowest rate.
DSCR
20% down · 8.5% · 30yr
- Down + closing
- —
- Monthly P&I
- —
- Monthly cashflow
- —
- DSCR
- —
- Eligible?
- —
No personal income docs; deal must DSCR.
Hard money
10% down · 12.0% · 12mo
- Down + closing
- —
- Monthly P&I
- —
- Monthly cashflow
- —
- DSCR
- —
- Eligible?
- —
Short-term bridge; refi at stabilization.
Rent comps 1 comps
| Address | Beds | Baths | Sqft | Rent | $/sqft | DOM | Units | Dist |
|---|---|---|---|---|---|---|---|---|
| 31416 Pratola Serra Cir Huffman, TX | 3.0 | 2.0 | 1461 | $1,675 | $1.15 | 3d | 1 | 0.90mi |
Listing history 10 events
-
2026-06-09days on market $253,990 Active 175 DOM
-
2026-06-08days on market $253,990 Active 174 DOM
-
2026-06-07days on market $253,990 Active 173 DOM
-
2026-06-04days on market $253,990 Active 170 DOM
-
2026-06-03days on market $253,990 Active 169 DOM
-
2026-06-02days on market $253,990 Active 168 DOM
-
2026-06-01days on market $253,990 Active 167 DOM
-
2026-05-31days on market $253,990 Active 166 DOM
-
2026-03-05price $253,990 513-char remark
Show marketing remark (513 chars)
A floor plan that epitomizes grace and functionality, offering a harmonious blend of classic charm and contemporary comfort - the Magnolia. Designed with meticulous attention to detail, this layout creates an inviting space ideal for both relaxed living and elegant entertaining. In essence, the Magnolia floor plan offers a perfect blend of elegance and everyday convenience, delivering a living experience that is both refined and accommodating. Discover the Magnolia, where timeless beauty meets modern living.
-
2025-12-16$264,900 Active 513-char remark
Show marketing remark (513 chars)
A floor plan that epitomizes grace and functionality, offering a harmonious blend of classic charm and contemporary comfort - the Magnolia. Designed with meticulous attention to detail, this layout creates an inviting space ideal for both relaxed living and elegant entertaining. In essence, the Magnolia floor plan offers a perfect blend of elegance and everyday convenience, delivering a living experience that is both refined and accommodating. Discover the Magnolia, where timeless beauty meets modern living.
ⓘ Source: listings_history table (triggers on properties + properties_extension) + one-shot
backfill from property_details.listing_events for pre-trigger history.
Nearby sold comps map
Loading sold comps map…
Walkable amenities ~0.75 mi
Loading nearby amenities…
Taxation est. · year 1
- Rental income
- $26,165
- − Mortgage interest
- −$15,790
- − Property taxes
- −$4,228
- − Insurance
- −$1,409
- − Repairs & maintenance
- −$2,093
- − Management
- −$2,093
- − Depreciation
- −$8,200
- Taxable loss
- −$7,649
- Est. tax savings @ 24.0%
- +$1,836
- After-tax cash flow
- $-870/yr
For passive investors: Depreciation is non-cash, so a rental often shows a tax loss while cash-flowing — sheltering income. Rental losses are passive: they offset passive income freely, and up to $25,000/yr can offset ordinary (W-2) income if you actively participate and your MAGI is under $100k (phasing out to $0 by $150k); unused losses carry forward. On sale, claimed depreciation is recaptured at up to 25%, and gains may owe capital-gains tax (a 1031 exchange can defer both). Figures are a year-1 estimate at your 24.0% rate — not tax advice; consult a CPA.
Condition & rehab AI · 12 photos
This home is in excellent condition with a modern and well-maintained interior and exterior. It is move-in ready and would benefit from a fresh coat of paint and landscaping improvements to further enhance its curb appeal and value.
Value-add opportunities
- Both Painting exterior and interior walls — Fresh paint enhances curb appeal and interior aesthetics.
- Both Landscaping improvements — Enhances curb appeal and adds value to the property.
Renovation cost estimate screening
Value-add ROI direction
- Both Painting exterior and interior walls — Fresh paint enhances curb appeal and interior aesthetics. ↑
- Both Landscaping improvements — Enhances curb appeal and adds value to the property. ↑
ⓘ Cost ranges are severity-bucket heuristics (US national rule-of-thumb). Get contractor quotes + a written scope before underwriting a rehab budget.
Schools (NCES district)
- District
- Huffman ISD
- NCES district ID
- 4823820
- Math proficiency
- 32% ▼ -9.00%
- Reading proficiency
- 35% ▼ -9.00%
- Median HH income
- $65,848
- Composite
- 30.61/100
- National rank
- #6195
- State rank
- #500 of 826 in TX
Livability — Plum Grove
- Score
- 58/100
- State rank
- #1206
- US rank
- #21049
Category grades
Schools grade is shown separately in the Schools card above.
Census & demographics
- County
- Harris County · 4,702,590 people
- City population
- 3,226,434
- Metro
- Houston-The Woodlands-Sugar Land, TX
- Population (ZIP)
- 14,342
- Household income
- $96,404
- Rent vs Own
- Severe rent burden
- 377.0
Population outlook (Harris County) Hauer SSP2
- Today (2025)
- 5,571,493 people
- By 2030
- 6,089,821 · +9.3%
- By 2040
- 7,142,806 · +28.2%
- By 2050
- 8,185,864 · +46.9%
- By 2075
- 10,574,329 · +89.8%
- By 2100
- 12,109,958 · +117.4%
Race, ethnicity, and origin ACS 2023
- Neighborhood character
- Majority White (65%)
- Race & ethnicity
- White 65% Hispanic / Latino 23% Two or more races 9% Black 5% Native American 4%
- Hispanic origin (detail)
- Mexican 20%
- Common ancestry
- Lithuanian 4% Slovak 2% Romanian 2%
- Foreign-born
- 9% · Canada
- Languages at home
- 79% English-only · Spanish 18% Other Indo-European 2%
Political lean MEDSL · Harris
- 2024 margin
- Lean D (+5.5) · D 52.0% · R 46.4% · Other 1.6%
- 2008→2024 swing
- +3.9pp toward D · 2008: 1.6pp · 2024: 5.5pp
- All cycles
- 2024: D+5.5 2020: D+13.3 2016: D+12.4 2012: D+0.1 2008: D+1.6
Not yet ingested
- Civics
- —
Market trends
- HPI YoY
- ▼ -8.59%
- Current HPI
- 472.03
- Rent YoY
- —
- Metro
- Houston-The Woodlands-Sugar Land, TX
- State GDP YoY
- ▲ 3.95%
- F500 in state
- 110
Industry mix (Fortune 500 HQ in TX)
| Industry | F500 HQs | Revenue |
|---|---|---|
| Energy | 16 | $1,198B |
|
||
| Technology | 5 | $198B |
|
||
| Engineering / Construction | 4 | $72B |
|
||
| Energy Services | 3 | $60B |
|
||
| Utilities | 3 | $41B |
|
||
| Healthcare | 2 | $330B |
|
||
Price history
-4.1% since first listed2 events — show timeline
- 2026-03-05 Price Changed $253,990 Zillow
- 2025-12-16 Listed $264,900 Zillow
Cash-flow waterfall
monthlySold comps — $/sqft
last 12 mo · ≤1 miLoading sold comps…