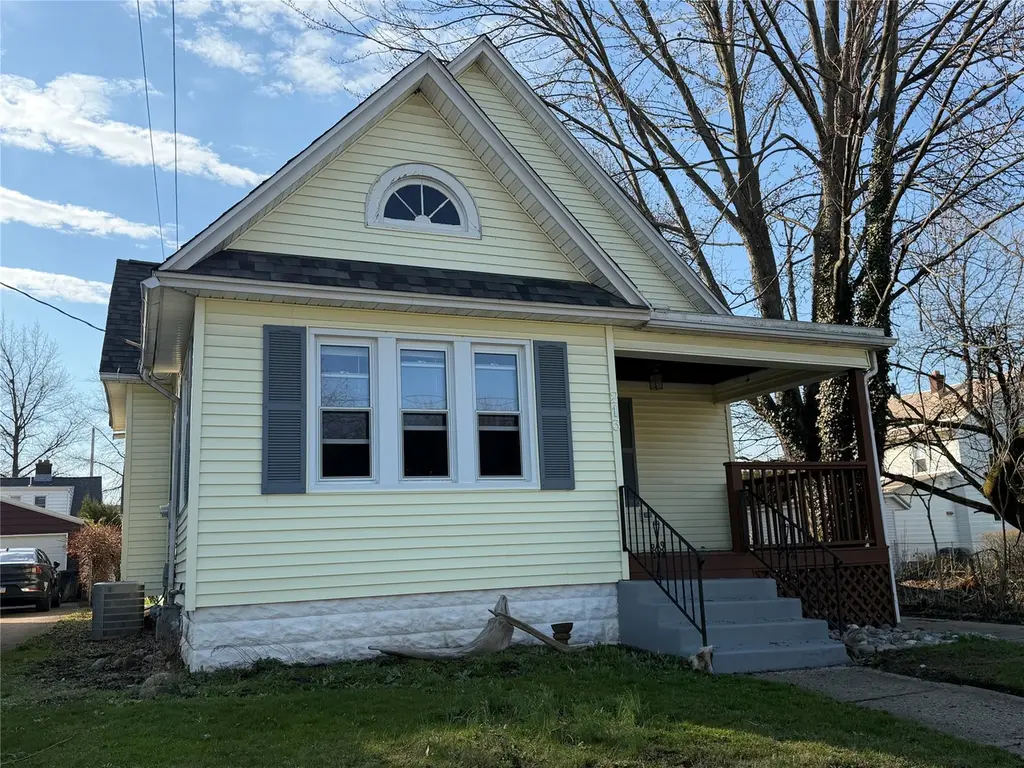
213 E 34th St · Erie, PA
Flood risk 1/10 · Minimal
- FEMA flood zone
- X (unshaded)
- Chance of flooding over 30 yrs
- 0.0%
- Est. flood insurance / yr
- $473 – $860
Fire risk 1/10 · Minimal
- Est. fire insurance / yr
- $511 – $949
Heat risk 2/10 · Minimal
- Hot days now (above 89°F)
- 7 days/yr
- Hot days in 30 yrs
- 16 days/yr
Wind risk 1/10 · Minimal
- Chance of severe wind over 30 yrs
- —
Air-quality risk 2/10 · Minimal
- Unhealthy air days now
- 1 days/yr
- Unhealthy air days in 30 yrs
- 3 days/yr
Risk factors via First Street. Map © Google.
Why this score? — see what drove the B- grade
The composite is a weighted blend of 9 inputs, each scored 0–100. Each bar is that input's sub-score; the figure is the points it added to the 100-point composite (weight × sub-score).
- Cash flow +28.7/30.0
- ARV discount +10.8/15.0
- DSCR +10.0/10.0
- 1% rule +9.3/10.0
- Livability +4.2/5.0
- Rent growth +2.5/5.0
- Condition / age +2.5/5.0
- Schools +1.3/10.0
- Appreciation +0.0/10.0
$160,000
🖨 Deal sheet 📄 Offer letter ✓ Due diligence
Listing remarks MLS
Adorable Dollhouse Of A Home Boasts Tremendous Mbr Retreat W/ Elect Fp, Sitting Area & Full Ba's. This Hm Is Loc W/ In 2 Blks Of Schools & Va Hospital. French Doors, Tons Of Charm, 2 Full Baths, 2-Car Garage, Heated Kennel W/ Fenced Dog Run & Fenced Back Yard All Located In A Beautiful Erie Neighbrhd Near Schls/Amen. Hh Mbg Avail!
Key facts
- Covered porch
- Fenced yard
- Updated roof
Tags
Neighborhood map
What this means for you Summary
Snapshot
- This is a 3-bed/2.0-bath single-family listed at $160k.
Deal economics
- At list price, monthly cash flow is $531 ($6k/yr) — positive.
- The deal already cash-flows at list — no discount required.
- Meets the 1% rule at list price ($2k rent vs $160k).
- Cap rate 10.3% vs local median 5.2% in Erie — top-decile yield for the area; either an underpriced asset or a hidden risk that comps aren't pricing in. Stress-test before assuming the spread holds.
Location & tenants
- Location reads 83/100 on livability (#109 in PA, #840 nationally) — a professional / high-income tenant draw. Strengths: amenities A+, commute A+, cost of living A+; Watch: crime D+, employment F.
- Erie City SD (urban): math 12% / reading 19% proficiency, ranked #510 of 539 in PA (top 95%) — low school quality limits family demand, transient renter base, plan for 1-2y turnover; 81% free/reduced lunch — lower-income household profile, screen leases tightly.
- Market conditions: 68 active listings in the ZIP; 6 comparable units currently listed for rent nearby; rentals lingering (median 44d on market — plan ~5-8 weeks vacancy on turnover, expect pricing pressure); 100% of comp listings sitting > 30 days — soft ceiling on asking rent; 364 units permitted in Erie County in 2024 (188 in 5+ unit buildings).
Forward outlook
- Local home prices are declining (-3.0%/yr); year-one equity from $1k of loan paydown is wiped out by about $5k of value loss. Plan a longer hold.
- Erie County population projected at -14% by 2050 — secular population decline; favor cash flow + early exit over multi-decade hold.
- At projected returns (-3.0% appreciation + 3.0% rent growth), your $45k cash investment doubles in ~9 years — after that, you're playing with house money.
Negotiation context
- Only 3 days on market — expect competitive offers; lowballing is unlikely to land.
- 3 sale attempts since 12y ago with the ask held roughly flat each time — persistent listings suggest the price (not the market) is what's stuck; bring a comps-based counter.
- Current owner paid $118k; 35% above their basis — modest negotiation headroom, anchor on the comps not their cost.
Risks & watch-outs
- Watch-outs: property tax is 2.8% of price; built in 1928 — expect roof / HVAC / electrical / plumbing capex.
Questions for the listing agent
- Built in 1928 — when were the roof, HVAC, electrical panel, plumbing, and water heater last replaced?
- Property tax is high relative to price — has the assessment been appealed recently, and will the sale trigger a re-assessment?
- Is there a deadline driving the sale (1031 exchange, divorce, estate, relocation)? That informs how much negotiation room exists.
- Crime grade is D in this area — have there been break-ins, vandalism, or insurance claims at this property in the last 3 years? What carrier currently insures it and at what premium?
- What's the average days-on-market for RENTAL listings here right now (not sales)? A rising rental-DOM trend means longer vacancies and softer asking-rent achievability than the comps imply.
- What's the recent tenant-quality profile in this submarket — average credit score on applications, eviction rate, late-payment / NSF rate, and stable-employment percentage? A property-management company in the area should have these aggregated.
- How much new for-sale + rental construction is in the pipeline within 1–3 miles? Heavy new supply typically softens prices + rents 12–24 months out; constrained supply supports both.
Investment metrics
- 1% rule
- 1.43% ✓
- Cap rate
- 10.28%
- Cash-on-cash
- 14.23%
- DSCR
- 1.63
- GRM
- 5.8
CMA / ARV
- ARV (on-the-fly)
- $172,575
- Comps found
- 12
Show comp detail 12 sales within ~0.75 mi
| Address | Dist | Beds/Ba | Sqft | Sold | Price | $/sf | Match |
|---|---|---|---|---|---|---|---|
| 3729 State St | 0.28mi | 4/2.0 (+1) | 1,461 (-1%) | 1mo | $241,000 | $165 | 79 |
| 248 Maiden Ln | 0.09mi | 3/1.0 | 1,349 (-8%) | 0mo | $175,950 | $130 | 77 |
| 3711 State St | 0.25mi | 3/2.5 | 1,600 (+8%) | 0mo | $282,500 | $177 | 72 |
| 242 E 32 St | 0.19mi | 3/1.0 | 1,336 (-9%) | 3mo | $75,201 | $56 | 69 |
| 3831 Sassafras St | 0.49mi | 3/1.5 | 1,424 (-4%) | 4mo | $250,000 | $176 | 66 |
| 3848 Eliot Rd | 0.59mi | 3/1.5 | 1,440 (-2%) | 2mo | $255,000 | $177 | 65 |
| 4003 Old French Rd | 0.38mi | 3/1.5 | 1,584 (+7%) | 4mo | $185,000 | $117 | 64 |
| 3114 Old French Rd | 0.26mi | 3/1.0 | 1,320 (-10%) | 4mo | $152,000 | $115 | 63 |
| 239 E 25th St | 0.62mi | 3/1.0 | 1,404 (-5%) | 1mo | $77,500 | $55 | 59 |
| 3025 Pine Ave | 0.44mi | 3/2.0 | 1,674 (+14%) | 4mo | $105,000 | $63 | 54 |
| 333 W 31 St | 0.72mi | 3/1.0 | 1,584 (+7%) | 1mo | $95,000 | $60 | 49 |
| 329 Metz St | 0.67mi | 3/1.0 | 1,330 (-10%) | 4mo | $149,900 | $113 | 45 |
Match score weights: distance 35% · size 25% · config 20% · recency 20%. Top-matched comps best support the ARV.
Projected returns pro-forma
-3.0% appreciation · 3.0% rent growth · sell at horizon
- IRR
- 4.6%
- Equity multiple
- 1.18×
- Total profit
- $8,044
- Equity at exit
- $23,857
- IRR
- 14.2%
- Equity multiple
- 2.14×
- Total profit
- $51,145
- Equity at exit
- $13,834
Cash invested: $44,800 (down + closing). Projections, not guarantees.
Landlord ↔ Tenant lean methodology
- Overall (STATE)
- 62 Landlord-Friendly
- State Pennsylvania
- 62 Landlord-Friendly · EVEN
- County
- — inherits STATE
- City
- — inherits STATE
ZIP-level market 16504
- Home prices YoY
- -17.9%
- Active inventory
- 68
- Price-to-rent
- 5.8×
Monthly cashflow live
- Estimated rent
- $2,296 high interval (Pro) →
- Mortgage (P&I)
- −$839
- Tax from tax record
- −$377 /mo · $4,520/yr
- Insurance
- −$67
- HOA
- −$0
- Vacancy / Maint / Mgmt
- −$482
- Net cashflow
- $531
Break-even live
UW: 25.0% down · 7.5% · 30yr · 1.5% tax · 5.0% vac · 8.0% maint · 8.0% mgmt
Financing live
Cash to close
- Down payment
- $40,000
- Closing costs
- $4,800
- Reserves months
- —
- Total cash needed
- —
Loan-product check · same deal, 3 products live
Conventional
25% down · 7.5% · 30yr
- Down + closing
- —
- Monthly P&I
- —
- Monthly cashflow
- —
- DSCR
- —
- Eligible?
- —
Personal DTI + credit; lowest rate.
DSCR
20% down · 8.5% · 30yr
- Down + closing
- —
- Monthly P&I
- —
- Monthly cashflow
- —
- DSCR
- —
- Eligible?
- —
No personal income docs; deal must DSCR.
Hard money
10% down · 12.0% · 12mo
- Down + closing
- —
- Monthly P&I
- —
- Monthly cashflow
- —
- DSCR
- —
- Eligible?
- —
Short-term bridge; refi at stabilization.
Rent comps 6 comps
| Address | Beds | Baths | Sqft | Rent | $/sqft | DOM | Units | Dist |
|---|---|---|---|---|---|---|---|---|
| 115 W 32nd St Erie, PA | 3.0 | 2.0 | 1844 | $1,050 | $0.57 | 44d | 1 | 0.41mi |
| 126 W 38th St Erie, PA | 4.0 | 2.0 | 1850 | $4,000 | $2.16 | 44d | 1 | 0.41mi |
| 504 W 29th St Unit 2 Erie, PA | 3.0 | 1.0 | 1200 | $1,500 | $1.25 | 44d | 1 | 0.99mi |
| 614 E 22nd St Unit 1 Erie, PA | 3.0 | 1.0 | 1300 | $1,000 | $0.77 | 44d | 1 | 1.00mi |
| 3603 Maple St Erie, PA | 2.0 | 1.0 | 1200 | $1,000 | $0.83 | 44d | 1 | 1.05mi |
| 811 W 30th St Unit 1 Erie, PA | 2.0 | 1.0 | 900 | $1,175 | $1.31 | 44d | 1 | 1.31mi |
Listing history 10 events
-
2026-03-30status Pending
-
2026-03-26$160,000 Active
-
2018-03-22$118,000
-
2014-06-25soldstatus $118,500
-
2014-06-23soldstatus $118,500 350-char remark
Show marketing remark (350 chars)
Adorable Dollhouse Of A Home Boasts Tremendous Mbr Retreat W/ Elect Fp, Sitting Area & Full Ba's. This Hm Is Loc W/ In 2 Blks Of Schools & Va Hospital. French Doors, Tons Of Charm, 2 Full Baths, 2-Car Garage, Heated Kennel W/ Fenced Dog Run & Fenced Back Yard All Located In A Beautiful Erie Neighbrhd Near Schls/Amen. Hh Mbg Avail!
-
2014-05-05$120,000 350-char remark
Show marketing remark (350 chars)
Adorable Dollhouse Of A Home Boasts Tremendous Mbr Retreat W/ Elect Fp, Sitting Area & Full Ba's. This Hm Is Loc W/ In 2 Blks Of Schools & Va Hospital. French Doors, Tons Of Charm, 2 Full Baths, 2-Car Garage, Heated Kennel W/ Fenced Dog Run & Fenced Back Yard All Located In A Beautiful Erie Neighbrhd Near Schls/Amen. Hh Mbg Avail!
-
2011-02-09soldstatus $114,500
-
2011-02-09soldstatus $114,500
-
2001-08-16soldstatus $72,000
-
1986-12-04soldstatus $33,500
ⓘ Source: listings_history table (triggers on properties + properties_extension) + one-shot
backfill from property_details.listing_events for pre-trigger history.
Tax reassessment forecast PA · Partial reset (capped growth)
- Current annual tax
- $4,520 · $377/mo
- Projected year-2 tax
- $4,520 · $377/mo
- Expected delta
- $0/yr ($0/mo · 0.0%)
ⓘ Screening estimate from a state-policy table — verify with the county assessor before closing.
Climate risk First Street
- Flood 1/10 Low FEMA zone X (unshaded) · 0% chance over 30 yrs
- Wildfire 1/10 Low
- Heat 2/10 Low 7 d/yr ≥89°F today · 16 d/yr by 30 yrs out
- Wind 1/10 Low
- Air quality 2/10 Low 1 unhealthy d/yr today · 3 by 30 yrs out
Nearby sold comps map
Loading sold comps map…
Walkable amenities ~0.75 mi
Loading nearby amenities…
Taxation est. · year 1
- Rental income
- $27,547
- − Mortgage interest
- −$8,962
- − Property taxes
- −$4,520
- − Insurance
- −$800
- − Repairs & maintenance
- −$2,204
- − Management
- −$2,204
- − Depreciation
- −$4,655
- Taxable income
- $4,203
- Est. tax owed @ 24.0%
- −$1,009
- After-tax cash flow
- $5,365/yr
For passive investors: Depreciation is non-cash, so a rental often shows a tax loss while cash-flowing — sheltering income. Rental losses are passive: they offset passive income freely, and up to $25,000/yr can offset ordinary (W-2) income if you actively participate and your MAGI is under $100k (phasing out to $0 by $150k); unused losses carry forward. On sale, claimed depreciation is recaptured at up to 25%, and gains may owe capital-gains tax (a 1031 exchange can defer both). Figures are a year-1 estimate at your 24.0% rate — not tax advice; consult a CPA.
Schools (NCES district)
- District
- Erie City SD
- NCES district ID
- 4209300
- Math proficiency
- 12% ▼ -11.00%
- Reading proficiency
- 19% ▼ -16.00%
- Median HH income
- $33,625
- Composite
- 12.59/100
- National rank
- #9617
- State rank
- #510 of 539 in PA
Livability — Erie
- Score
- 83/100
- State rank
- #109
- US rank
- #840
Category grades
Schools grade is shown separately in the Schools card above.
Census & demographics
- Census place
- Erie, PA
- City population
- 92,215
- Population (ZIP)
- 15,632
Population outlook (Erie County) Hauer SSP2
- Today (2025)
- 272,159 people
- By 2030
- 266,299 · -2.2%
- By 2040
- 250,987 · -7.8%
- By 2050
- 234,925 · -13.7%
- By 2075
- 199,164 · -26.8%
- By 2100
- 162,985 · -40.1%
Race, ethnicity, and origin ACS 2023
- Neighborhood character
- Predominantly White (73%)
- Race & ethnicity
- White 73% Two or more races 12% Black 10% Hispanic / Latino 6% Asian 3%
- Hispanic origin (detail)
- Mexican 1% Puerto Rican 3%
- Common ancestry
- Romanian 17% Subsaharan African 2% American 2%
- Foreign-born
- 9% · Canada, India, China
- Languages at home
- 88% English-only · Russian/Polish/Slavic 5% Spanish 3% Other Indo-European 3%
Political lean MEDSL · Erie
- 2024 margin
- Toss-up / Even · D 49.0% · R 50.0%
- 2008→2024 swing
- -20.9pp toward R · 2008: 19.9pp · 2024: -1.0pp
- All cycles
- 2024: R+1.0 2020: D+1.0 2016: R+2.0 2012: D+16.9 2008: D+19.9
Not yet ingested
- Civics
- —
Market trends
- HPI YoY
- ▼ -56.54%
- Current HPI
- 260.1053
- Rent YoY
- —
- Metro
- —
- State GDP YoY
- ▲ 1.68%
- F500 in state
- 34
Industry mix (Fortune 500 HQ in PA)
| Industry | F500 HQs | Revenue |
|---|---|---|
| Healthcare | 2 | $309B |
|
||
| Insurance | 2 | $27B |
|
||
| Telecommunications / Media | 1 | $124B |
|
||
| Industrial Distribution | 1 | $22B |
|
||
| Financial Services | 1 | $20B |
|
||
| Chemicals / Materials | 1 | $18B |
|
||
Price history
+377.6% since first listed10 events — show timeline
- 2026-03-30 Pending — GEBOR
- 2026-03-26 Listed $160,000 GEBOR
- 2018-03-22 Listed $118,000 GEBOR
- 2014-06-25 Sold (Public Records) $118,500 Public Records
- 2014-06-23 Sold (MLS) $118,500 GEBOR
- 2014-05-05 Listed $120,000 GEBOR
- 2011-02-09 Sold (Public Records) $114,500 Public Records
- 2011-02-09 Sold (Public Records) $114,500 Public Records
- 2001-08-16 Sold (Public Records) $72,000 Public Records
- 1986-12-04 Sold (Public Records) $33,500 Public Records
Property tax history
+1.9%/yrLatest (2026): $4,520 · +3.4% YoY. Source: county tax records.
Cash-flow waterfall
monthlySold comps — $/sqft
last 12 mo · ≤1 miLoading sold comps…