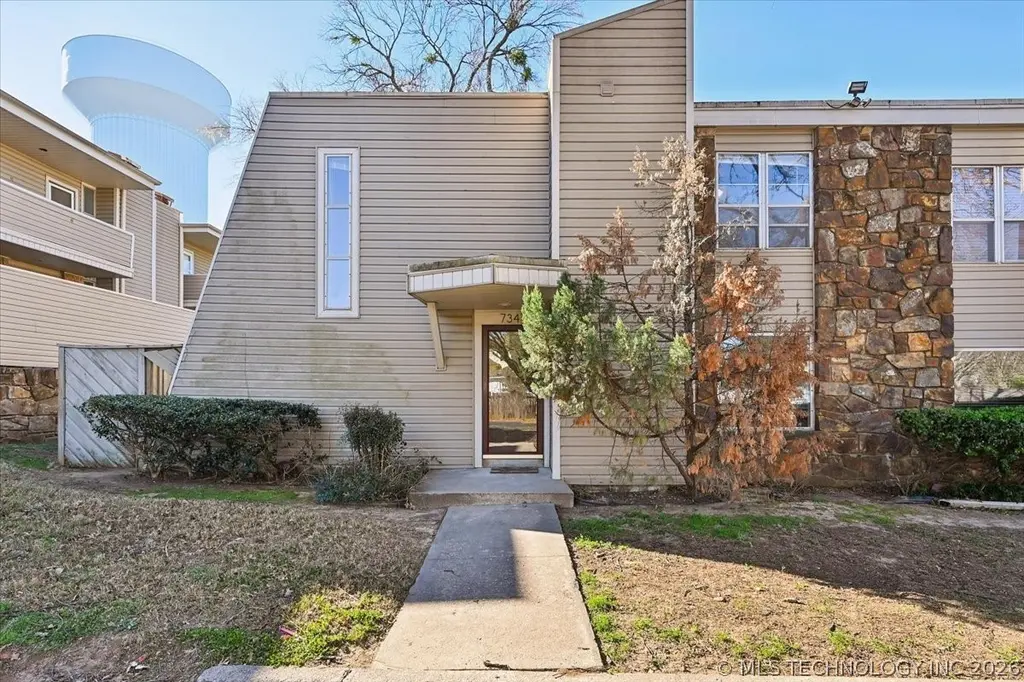
7347 S Yale Ave Unit A7347 · Tulsa, OK
Flood risk 1/10 · Minimal
- FEMA flood zone
- X (unshaded)
- Chance of flooding over 30 yrs
- 0.0%
- Est. flood insurance / yr
- $473 – $860
Fire risk 1/10 · Minimal
- Est. fire insurance / yr
- $2,463 – $4,575
Heat risk 6/10 · Moderate
- Hot days now (above 111°F)
- 7 days/yr
- Hot days in 30 yrs
- 16 days/yr
Wind risk 2/10 · Minimal
- Chance of severe wind over 30 yrs
- 4.0%
Air-quality risk 2/10 · Minimal
- Unhealthy air days now
- 1 days/yr
- Unhealthy air days in 30 yrs
- 1 days/yr
Risk factors via First Street. Map © Google.
Why this score? — see what drove the D grade
The composite is a weighted blend of 9 inputs, each scored 0–100. Each bar is that input's sub-score; the figure is the points it added to the 100-point composite (weight × sub-score).
- Cash flow +15.6/30.0
- ARV discount +7.5/15.0
- 1% rule +6.0/10.0
- DSCR +4.8/10.0
- Livability +3.8/5.0
- Rent growth +2.7/5.0
- Condition / age +2.5/5.0
- Schools +0.8/10.0
- Appreciation +0.0/10.0
$120,000
🖨 Deal sheet (PDF) 📄 Offer letter ✓ Due diligence
Listing remarks
PRICED TO SELL! Charmingly updated condo in a prime location near 71st & Yale. Conveniently situated close to Saint Francis Medical Plaza and I?44, this well-maintained home features new carpet in the bedrooms and fresh paint throughout. The thoughtful floor plan includes a private fenced patio perfect for relaxing or entertaining. Both bedrooms are located upstairs, each with its own private bathroom. Enjoy a spacious formal living room with a cozy fireplace, plus many additional features that make this home truly stand out.
Key facts
- Private fenced patio
- Formal living room
- Cozy fireplace
Tags
Property features AI
Finance
- Financial info: Pets allowed
- HOA & community: Homeowners association with monthly fee; Association fee covers structure maintenance, sewer, trash, and water; Community clubhouse and pool; Gated/guard presence; Pets allowed in association; Sidewalks in the community
Exterior
- Security: Smoke detector(s); No safety shelter
- Utilities: Public water; Public sewer; Electricity available; Natural gas available; Cable available; Phone available
- Home design: 2 stories; Faces north; Slab foundation
- Construction: Vinyl siding; Wood frame construction; Asphalt/fiberglass roof; Built (year per public records)
- Exterior features: Covered balcony; Patio; Porch; Shed(s); Privacy fencing; Mature trees
Interior
- Kitchen: Dishwasher; Microwave; Oven; Range; Refrigerator; Garbage disposal; Electric water heater
- Flooring: Carpet; Tile; Vinyl
- Bathrooms: 2 full bathrooms; 1 half bathroom
- Heating & cooling: Central heating (gas); Central air conditioning; Has heating; Has cooling; Wood-burning fireplace (1)
- Interior features: High ceilings; Vaulted ceilings; Ceiling fan(s); High speed internet; Cable TV; Wired for data; Laminate counters; Aluminum frame windows; Electric oven and range connections
- Laundry & utility: Washer hookup; Electric dryer hookup
Neighborhood map
What this means for you Summary
Snapshot
- This is a 2-bed/2.5-bath condo listed at $120k.
Deal economics
- At list price, monthly cash flow is $50 ($603/yr) — positive.
- The deal already cash-flows at list — no discount required.
- Meets the 1% rule at list price ($1k rent vs $120k).
- Cap rate 6.8% vs local median 3.8% in Tulsa — top-decile yield for the area; either an underpriced asset or a hidden risk that comps aren't pricing in. Stress-test before assuming the spread holds.
Location & tenants
- Location reads 75/100 on livability (#13 in OK, #4,058 nationally) — a middle-class / working-renter tenant base. Strengths: amenities A+, commute A+, cost of living A+; Watch: crime F, employment D-.
- Tulsa (urban): math 7% / reading 12% proficiency, ranked #250 of 270 in OK (top 93%) — low school quality limits family demand, transient renter base, plan for 1-2y turnover; 76% free/reduced lunch — lower-income household profile, screen leases tightly.
- Zoned schools: Project Accept Traice Es (math 10% / reading 10%, grade F, #695 of 845 statewide, top 84%, 558 students, 0% FRL); Monroe Demonstration Ms (math 0% / reading 2%, grade F, #344 of 345 statewide, top 100%, 688 students, 0% FRL); Booker T. Washington Hs (math 41% / reading 61%, grade D+, #2 of 447 statewide, top 0%, 1,280 students, 0% FRL) — zoned schools average 0% FRL vs 76% district-wide (76 pts lower); this property's tenant base skews higher-income than the district average.
- Market conditions: Rents flat; 173 active listings in the ZIP; 11 comparable units currently listed for rent nearby; rentals leasing fast (median 14d on market — plan ~1-2 weeks tenant-placement turnaround); 2,818 units permitted in Tulsa County in 2024 (518 in 5+ unit buildings).
- This rent runs 31% of the median local income ($52k/yr) — at the standard rent-burdened threshold; future hikes will face affordability resistance.
Forward outlook
- Local home prices are declining (-3.0%/yr); year-one equity from $830 of loan paydown is wiped out by about $4k of value loss. Plan a longer hold.
- Tulsa County population projected at +30% by 2050 — long-run rental-demand tailwind backs the buy-and-hold thesis.
Negotiation context
- Only 8 days on market — expect competitive offers; lowballing is unlikely to land.
- Current owner paid $50k; list at $120k implies a 140% gain — meaningful room to come down on a strong offer.
Risks & watch-outs
- Climate carrying-cost: extreme-heat days projected 7→16/yr by 2055 (HVAC capex compounding) — expect insurance premiums to compound above CPI over the hold.
Questions for the listing agent
- Built in 1970 — when were the roof, HVAC, electrical panel, plumbing, and water heater last replaced?
- What does the HOA fee cover, when was the last increase, and are there any pending special assessments or reserve-fund shortfalls?
- Any open or pending special assessments — roof, HVAC, plumbing, elevator, façade? What's the per-unit balance and payoff schedule, and is the seller paying it off at close or rolling it to the buyer?
- Is there a deadline driving the sale (1031 exchange, divorce, estate, relocation)? That informs how much negotiation room exists.
- Schools are F-rated, which usually means shorter tenancies and higher turnover. Who's the typical renter profile here, and what's been the actual vacancy rate?
- Crime grade is F in this area — have there been break-ins, vandalism, or insurance claims at this property in the last 3 years? What carrier currently insures it and at what premium?
- The area grade is low — what's the realistic commute time and amenity access for the typical tenant pool here? Any planned neighborhood developments (good or bad) we should know about?
- What's the average days-on-market for RENTAL listings here right now (not sales)? A rising rental-DOM trend means longer vacancies and softer asking-rent achievability than the comps imply.
- What's the recent tenant-quality profile in this submarket — average credit score on applications, eviction rate, late-payment / NSF rate, and stable-employment percentage? A property-management company in the area should have these aggregated.
- How much new apartment / multifamily construction is in the pipeline within 1–3 miles? Heavy new supply (>2% of stock underway) typically softens rents 12–24 months out; light construction supports rent growth.
Investment metrics
- 1% rule
- 1.10% ✓
- Cap rate
- 6.80%
- Cash-on-cash
- 1.79%
- DSCR
- 1.08
- GRM
- 7.5
CMA / ARV
No comps found within radius.
Projected returns pro-forma
-3.0% appreciation · 0.74% rent growth · sell at horizon
- IRR
- -16.4%
- Equity multiple
- 0.43×
- Total profit
- $-19,071
- Equity at exit
- $17,892
- IRR
- -13.7%
- Equity multiple
- 0.30×
- Total profit
- $-23,550
- Equity at exit
- $10,375
Cash invested: $33,600 (down + closing). Projections, not guarantees.
Landlord ↔ Tenant lean methodology
- Overall (STATE)
- 83 Strongly Landlord-Friendly
- State Oklahoma
- 83 Strongly Landlord-Friendly · R+20
- County
- — inherits STATE
- City
- — inherits STATE
ZIP-level market 74136
- Home prices YoY
- -31.4%
- Rents YoY
- 0.7%
- Active inventory
- 173
- Price-to-rent
- 7.5×
Monthly cashflow live
- Estimated rent
- $1,326 high interval (Pro) →
- Mortgage (P&I)
- −$629
- Tax from tax record
- −$71 /mo · $851/yr
- Insurance
- −$50
- HOA
- −$247
- Vacancy / Maint / Mgmt
- −$278
- Net cashflow
- $50
Break-even live
Sensitivity live
| Price | -10% $118 | -5% $84 | +0% $50 | +5% $16 | +10% $-18 |
|---|---|---|---|---|---|
| Rent | -10% $-55 | -5% $-2 | +0% $50 | +5% $103 | +10% $155 |
| Rate | -1.0pp $111 | -0.5pp $81 | base $50 | +0.5pp $19 | +1.0pp $-13 |
UW: 25.0% down · 7.5% · 30yr · 1.5% tax · 5.0% vac · 8.0% maint · 8.0% mgmt
Financing live
Cash to close
- Down payment
- $30,000
- Closing costs
- $3,600
- Reserves months
- —
- Total cash needed
- —
Loan-product check · same deal, 3 products live
Conventional
25% down · 7.5% · 30yr
- Down + closing
- —
- Monthly P&I
- —
- Monthly cashflow
- —
- DSCR
- —
- Eligible?
- —
Personal DTI + credit; lowest rate.
DSCR
20% down · 8.5% · 30yr
- Down + closing
- —
- Monthly P&I
- —
- Monthly cashflow
- —
- DSCR
- —
- Eligible?
- —
No personal income docs; deal must DSCR.
Hard money
10% down · 12.0% · 12mo
- Down + closing
- —
- Monthly P&I
- —
- Monthly cashflow
- —
- DSCR
- —
- Eligible?
- —
Short-term bridge; refi at stabilization.
Rent comps 11 comps
| Address | Beds | Baths | Sqft | Rent | $/sqft | DOM | Units | Dist |
|---|---|---|---|---|---|---|---|---|
| 7129 S Braden Ave Tulsa, OK | 3.0 | 2.5 | 1710 | $1,800 | $1.05 | 3d | 1 | 0.26mi |
| 5808 E 71st St Tulsa, OK | 1.0–2.0 | 1.0–2.0 | 800 | $1,061 | $1.33 | 3d | 27 | 0.65mi |
| 4614 E 68th St Unit Labs Tulsa, OK | 3.0 | 2.5 | 1402 | $1,480 | $1.06 | 13d | 1 | 0.70mi |
| 5202 E 81st St Tulsa, OK | 1.0–3.0 | 1.0–2.0 | 1029 | $1,340 | $1.30 | 4d | 38 | 0.71mi |
| 6806 S Toledo Ave Tulsa, OK | 2.0 | 2.0 | 875 | $1,150 | $1.31 | 23d | 1 | 0.72mi |
| 4426 E 68th St Tulsa, OK | 3.0 | 2.0 | 1460 | $1,750 | $1.20 | 25d | 1 | 0.76mi |
| 4329 E 68th St #507 Tulsa, OK | 2.0 | 1.0 | 910 | $1,025 | $1.13 | 25d | 1 | 0.78mi |
| 6717 S Richmond Ave #637 Tulsa, OK | 2.0 | 1.0 | 910 | $950 | $1.04 | 25d | 1 | 0.83mi |
| 7902 S Sheridan Rd Tulsa, OK | 1.0–2.0 | 1.0–2.0 | 837 | $1,199 | $1.43 | 13d | 3 | 1.03mi |
| 8130 S Lakewood Pl Tulsa, OK | 1.0–2.0 | 1.0–2.0 | 796 | $1,419 | $1.78 | 3d | 7 | 1.15mi |
| 5516 E 61st Pl Tulsa, OK | 3.0 | 2.0 | 1813 | $1,425 | $0.79 | 23d | 1 | 1.27mi |
HOA detail condo
- Monthly dues
- $247 · $2,964/yr
- Assessments
- None detected in remarks — confirm with the listing agent.
Listing history 6 events
-
2026-04-17status Pending
-
2026-04-09$120,000 Active
-
2026-02-23soldstatus $50,000
-
1999-03-19soldstatus $45,000
-
1997-10-30soldstatus $38,000
-
1990-05-01soldstatus $32,000
ⓘ Source: listings_history table (triggers on properties + properties_extension) + one-shot
backfill from property_details.listing_events for pre-trigger history.
Tax reassessment forecast OK · Resets to sale price
- Current annual tax
- $851 · $71/mo
- Projected year-2 tax
- $1,080 · $90/mo
- Expected delta
- +$229/yr (+$19/mo · 26.9%)
ⓘ Screening estimate from a state-policy table — verify with the county assessor before closing.
Climate risk First Street
- Flood 1/10 Low FEMA zone X (unshaded) · 0% chance over 30 yrs
- Wildfire 1/10 Low
- Heat 6/10 Major 7 d/yr ≥111°F today · 16 d/yr by 30 yrs out
- Wind 2/10 Low 4% chance of damaging wind over 30 yrs
- Air quality 2/10 Low 1 unhealthy d/yr today · 1 by 30 yrs out
Nearby sold comps map
Loading sold comps map…
Walkable amenities ~0.75 mi
Loading nearby amenities…
Taxation est. · year 1
- Rental income
- $15,910
- − Mortgage interest
- −$6,722
- − Property taxes
- −$851
- − Insurance
- −$600
- − Repairs & maintenance
- −$1,273
- − Management
- −$1,273
- − HOA
- −$2,964
- − Depreciation
- −$3,491
- Taxable loss
- −$1,263
- Est. tax savings @ 24.0%
- +$303
- After-tax cash flow
- $906/yr
For passive investors: Depreciation is non-cash, so a rental often shows a tax loss while cash-flowing — sheltering income. Rental losses are passive: they offset passive income freely, and up to $25,000/yr can offset ordinary (W-2) income if you actively participate and your MAGI is under $100k (phasing out to $0 by $150k); unused losses carry forward. On sale, claimed depreciation is recaptured at up to 25%, and gains may owe capital-gains tax (a 1031 exchange can defer both). Figures are a year-1 estimate at your 24.0% rate — not tax advice; consult a CPA.
Schools (NCES district)
- District
- Tulsa
- NCES district ID
- 4030240
- Math proficiency
- 7% ▼ -9.00%
- Reading proficiency
- 12% ▼ -7.00%
- Median HH income
- $37,895
- Composite
- 8.04/100
- National rank
- #9919
- State rank
- #250 of 270 in OK
Livability — Tulsa
- Score
- 75/100
- State rank
- #13
- US rank
- #4058
Category grades
Schools grade is shown separately in the Schools card above.
Census & demographics
- Census place
- Tulsa, OK
- County
- Tulsa County · 640,811 people
- City population
- 389,418
- Metro
- Tulsa, OK
- Population (ZIP)
- 31,416
- Household income
- $51,820
- Rent vs Own
- Severe rent burden
- 2579.0
Population outlook (Tulsa County) Hauer SSP2
- Today (2025)
- 723,846 people
- By 2030
- 766,033 · +5.8%
- By 2040
- 851,386 · +17.6%
- By 2050
- 938,389 · +29.6%
- By 2075
- 1,166,011 · +61.1%
- By 2100
- 1,350,277 · +86.5%
Race, ethnicity, and origin ACS 2023
- Neighborhood character
- Diverse neighborhood (Simpson 0.66)
- Race & ethnicity
- White 55% Black 16% Two or more races 13% Hispanic / Latino 10% Asian 7% Native American 2%
- Hispanic origin (detail)
- Mexican 6%
- Common ancestry
- Slovak 2% Lithuanian 2% Italian 1%
- Foreign-born
- 14% · Canada, Philippines
- Languages at home
- 83% English-only · Spanish 8% Other Asian/Pacific 5% Other Indo-European 1%
Political lean MEDSL · Tulsa
- 2024 margin
- R (+15.2) · D 41.3% · R 56.5% · Other 2.2%
- 2008→2024 swing
- +9.2pp toward D · 2008: -24.5pp · 2024: -15.2pp
- All cycles
- 2024: R+15.2 2020: R+15.6 2016: R+22.9 2012: R+27.4 2008: R+24.5
Not yet ingested
- Civics
- —
Market trends
- HPI YoY
- ▼ -98.51%
- Current HPI
- 215.3642
- Rent YoY
- ▲ 0.74%
- Metro
- Tulsa, OK
- State GDP YoY
- ▲ 1.55%
- F500 in state
- 6
Industry mix (Fortune 500 HQ in OK)
| Industry | F500 HQs | Revenue |
|---|---|---|
| Energy | 3 | $48B |
|
||
Price history
+275.0% since first listed6 events — show timeline
- 2026-04-17 Pending — MLS Technology, Inc.
- 2026-04-09 Listed $120,000 MLS Technology, Inc.
- 2026-02-23 Sold (Public Records) $50,000 Public Records
- 1999-03-19 Sold (Public Records) $45,000 Public Records
- 1997-10-30 Sold (Public Records) $38,000 Public Records
- 1990-05-01 Sold (Public Records) $32,000 Public Records
Property tax history
+1.3%/yrLatest (2025): $851 · +8.5% YoY. Source: county tax records.
Cash-flow waterfall
monthlySold comps — $/sqft
last 12 mo · ≤1 miLoading sold comps…