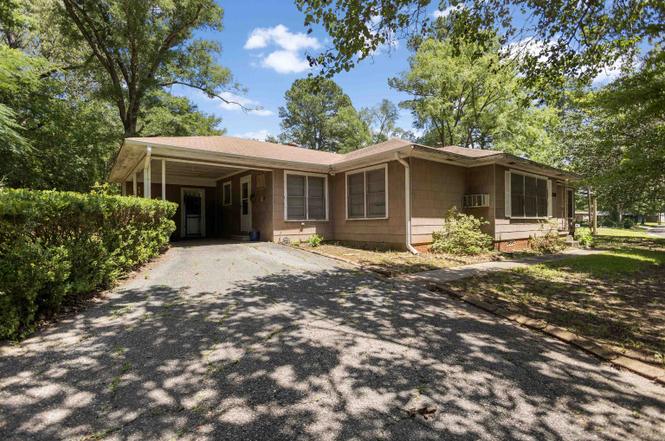
3018 Florence St · Kilgore, TX
Flood risk 1/10 · Minimal
- FEMA flood zone
- X (unshaded)
- Chance of flooding over 30 yrs
- 0.0%
- Est. flood insurance / yr
- $507 – $1,088
Fire risk 4/10 · Minor
- Est. fire insurance / yr
- $1,222 – $2,270
Heat risk 7/10 · Major
- Hot days now (above 109°F)
- 7 days/yr
- Hot days in 30 yrs
- 25 days/yr
Wind risk 6/10 · Moderate
- Chance of severe wind over 30 yrs
- 61.0%
Air-quality risk 2/10 · Minimal
- Unhealthy air days now
- 0 days/yr
- Unhealthy air days in 30 yrs
- 2 days/yr
Risk factors via First Street. Map © Google.
Why this score? — see what drove the C grade
The composite is a weighted blend of 9 inputs, each scored 0–100. Each bar is that input's sub-score; the figure is the points it added to the 100-point composite (weight × sub-score).
- Cash flow +17.7/30.0
- ARV discount +15.0/15.0
- 1% rule +5.5/10.0
- DSCR +5.5/10.0
- Rent growth +4.7/5.0
- Livability +3.6/5.0
- Schools +3.1/10.0
- Condition / age +2.5/5.0
- Appreciation +0.0/10.0
$140,000
🖨 Deal sheet (PDF) 📄 Offer letter ✓ Due diligence
Listing remarks
Nestled on a desirable corner lot in Kilgore, this charming 3-bedroom, 2-bath home offers 1,659 square feet of living space and a unique opportunity to own a property that has been lovingly maintained since it was built in 1948. Full of character and potential, this home is being offered "AS IS" making it an excellent opportunity for buyers looking to personalize a home in a great location. The spacious floor plan provides comfortable living areas, generously sized bedrooms, and plenty of natural light throughout. Adding even more value, the furniture will remain with the home unless the buyer prefers otherwise. The washer, dryer, and additional appliances will also convey with th
Key facts
- Original owner
- Natural light
- Move in ready
Tags
Property features AI
Exterior
- Parking: 1-car garage
- Utilities: Public water; Public sewer; Natural gas available
- Home design: Single-family residence; Residential property
- Exterior features: Paved parking area; Lot approximately 0.3889 acres
Interior
- Bathrooms: 2 full bathrooms
- Heating & cooling: Central heating; Natural gas heating; Central air conditioning
- Interior features: Gas water heater; 3 total rooms
Neighborhood map
What this means for you Summary
Snapshot
- This is a 3-bed/2.0-bath single-family listed at $140k.
Deal economics
- At list price, monthly cash flow is $112 ($1k/yr) — positive.
- The deal already cash-flows at list — no discount required.
- Meets the 1% rule at list price ($1k rent vs $140k).
- Cap rate 7.3% vs local median 3.2% in Kilgore — top-decile yield for the area; either an underpriced asset or a hidden risk that comps aren't pricing in. Stress-test before assuming the spread holds.
Location & tenants
- Location reads 72/100 on livability (#257 in TX) — a middle-class / working-renter tenant base. Strengths: cost of living A+, housing A+, health & safety A+; Watch: crime D+, employment D+, schools D-.
- Kilgore ISD (town): math 33% / reading 38% proficiency, ranked #498 of 826 in TX (top 60%) — families likely to look elsewhere, expect single-tenant / working-renter base with shorter leases.
- Market conditions: Rents rising fast (+8.9%/yr); 283 active listings in the ZIP; 2 comparable units currently listed for rent nearby; 4 units permitted in Rusk County in 2024 (0 in 5+ unit buildings).
Forward outlook
- Local home prices are declining (-3.0%/yr); year-one equity from $968 of loan paydown is wiped out by about $4k of value loss. Plan a longer hold.
- Rusk County population projected to shrink 5% by 2050 — rents likely to lag national; underwrite the cash flow, not the appreciation.
- At projected returns (-3.0% appreciation + 8.0% rent growth), your $39k cash investment doubles in ~10 years — after that, you're playing with house money.
Negotiation context
- Only 5 days on market — expect competitive offers; lowballing is unlikely to land.
Risks & watch-outs
- Watch-outs: built in 1948 — expect roof / HVAC / electrical / plumbing capex.
- Climate carrying-cost: major wind risk, 61% chance of damaging wind over 30y; extreme-heat days projected 7→25/yr by 2055 (HVAC capex compounding) — expect insurance premiums to compound above CPI over the hold.
Questions for the listing agent
- Built in 1948 — when were the roof, HVAC, electrical panel, plumbing, and water heater last replaced?
- Is there a deadline driving the sale (1031 exchange, divorce, estate, relocation)? That informs how much negotiation room exists.
- Schools are D-rated, which usually means shorter tenancies and higher turnover. Who's the typical renter profile here, and what's been the actual vacancy rate?
- Crime grade is D in this area — have there been break-ins, vandalism, or insurance claims at this property in the last 3 years? What carrier currently insures it and at what premium?
- What's the average days-on-market for RENTAL listings here right now (not sales)? A rising rental-DOM trend means longer vacancies and softer asking-rent achievability than the comps imply.
- What's the recent tenant-quality profile in this submarket — average credit score on applications, eviction rate, late-payment / NSF rate, and stable-employment percentage? A property-management company in the area should have these aggregated.
- How much new for-sale + rental construction is in the pipeline within 1–3 miles? Heavy new supply typically softens prices + rents 12–24 months out; constrained supply supports both.
Investment metrics
- 1% rule
- 1.05% ✓
- Cap rate
- 7.26%
- Cash-on-cash
- 3.44%
- DSCR
- 1.15
- GRM
- 7.9
CMA / ARV
- ARV (on-the-fly)
- $243,873
- Comps found
- 1
Show comp detail 1 sale within ~0.75 mi
| Address | Dist | Beds/Ba | Sqft | Sold | Price | $/sf | Match |
|---|---|---|---|---|---|---|---|
| 1502 Peach St | 0.72mi | 4/2.0 (+1) | 1,903 (+15%) | 4mo | $279,000 | $147 | 33 |
Match score weights: distance 35% · size 25% · config 20% · recency 20%. Top-matched comps best support the ARV.
Projected returns pro-forma
-3.0% appreciation · 8.0% rent growth · sell at horizon
- IRR
- -5.0%
- Equity multiple
- 0.80×
- Total profit
- $-7,708
- Equity at exit
- $20,874
- IRR
- 10.1%
- Equity multiple
- 1.97×
- Total profit
- $38,092
- Equity at exit
- $12,105
Cash invested: $39,200 (down + closing). Projections, not guarantees.
Landlord ↔ Tenant lean methodology
- Overall (STATE)
- 87 Strongly Landlord-Friendly
- State Texas
- 87 Strongly Landlord-Friendly · R+5
- County
- — inherits STATE
- City
- — inherits STATE
ZIP-level market 75662
- Home prices YoY
- -16.9%
- Rents YoY
- 8.9%
- Active inventory
- 283
- Price-to-rent
- 7.9×
Monthly cashflow live
- Estimated rent
- $1,468 medium interval (Pro) →
- Mortgage (P&I)
- −$734
- Tax from tax record
- −$255 /mo · $3,059/yr
- Insurance
- −$58
- HOA
- −$0
- Vacancy / Maint / Mgmt
- −$308
- Net cashflow
- $112
Break-even live
Sensitivity live
| Price | -10% $192 | -5% $152 | +0% $112 | +5% $73 | +10% $33 |
|---|---|---|---|---|---|
| Rent | -10% $-4 | -5% $54 | +0% $112 | +5% $170 | +10% $228 |
| Rate | -1.0pp $183 | -0.5pp $148 | base $112 | +0.5pp $76 | +1.0pp $39 |
UW: 25.0% down · 7.5% · 30yr · 1.5% tax · 5.0% vac · 8.0% maint · 8.0% mgmt
Financing live
Cash to close
- Down payment
- $35,000
- Closing costs
- $4,200
- Reserves months
- —
- Total cash needed
- —
Loan-product check · same deal, 3 products live
Conventional
25% down · 7.5% · 30yr
- Down + closing
- —
- Monthly P&I
- —
- Monthly cashflow
- —
- DSCR
- —
- Eligible?
- —
Personal DTI + credit; lowest rate.
DSCR
20% down · 8.5% · 30yr
- Down + closing
- —
- Monthly P&I
- —
- Monthly cashflow
- —
- DSCR
- —
- Eligible?
- —
No personal income docs; deal must DSCR.
Hard money
10% down · 12.0% · 12mo
- Down + closing
- —
- Monthly P&I
- —
- Monthly cashflow
- —
- DSCR
- —
- Eligible?
- —
Short-term bridge; refi at stabilization.
Rent comps 2 comps
| Address | Beds | Baths | Sqft | Rent | $/sqft | DOM | Units | Dist |
|---|---|---|---|---|---|---|---|---|
| 633 Harris St Kilgore, TX | 2.0 | 2.0 | 1500 | $1,400 | $0.93 | 14d | 1 | 0.94mi |
| 620 Riverside Dr Kilgore, TX | 3.0 | 2.0 | 1376 | $1,495 | $1.09 | 14d | 1 | 1.04mi |
Listing history 6 events
-
2026-06-19days on market $140,000 Active 5 DOM
-
2026-06-18days on market $140,000 Active 4 DOM
-
2026-06-17days on market $140,000 Active 3 DOM
-
2026-06-16days on market $140,000 Active 2 DOM
-
2026-06-15remarks 689-char remark
-
2026-06-15$140,000 Active 1 DOM
ⓘ Source: listings_history table (triggers on properties + properties_extension) + one-shot
backfill from property_details.listing_events for pre-trigger history.
Tax reassessment forecast TX · Resets to sale price
- Current annual tax
- $3,059 · $255/mo
- Projected year-2 tax
- $3,059 · $255/mo
- Expected delta
- $0/yr ($0/mo · 0.0%)
ⓘ Screening estimate from a state-policy table — verify with the county assessor before closing.
Climate risk First Street
- Flood 1/10 Low FEMA zone X (unshaded) · 0% chance over 30 yrs
- Wildfire 4/10 Moderate
- Heat 7/10 Severe 7 d/yr ≥109°F today · 25 d/yr by 30 yrs out
- Wind 6/10 Major 61% chance of damaging wind over 30 yrs
- Air quality 2/10 Low 0 unhealthy d/yr today · 2 by 30 yrs out
Nearby sold comps map
Loading sold comps map…
Walkable amenities ~0.75 mi
Loading nearby amenities…
Taxation est. · year 1
- Rental income
- $17,615
- − Mortgage interest
- −$7,842
- − Property taxes
- −$3,059
- − Insurance
- −$700
- − Repairs & maintenance
- −$1,409
- − Management
- −$1,409
- − Depreciation
- −$4,073
- Taxable loss
- −$877
- Est. tax savings @ 24.0%
- +$210
- After-tax cash flow
- $1,558/yr
For passive investors: Depreciation is non-cash, so a rental often shows a tax loss while cash-flowing — sheltering income. Rental losses are passive: they offset passive income freely, and up to $25,000/yr can offset ordinary (W-2) income if you actively participate and your MAGI is under $100k (phasing out to $0 by $150k); unused losses carry forward. On sale, claimed depreciation is recaptured at up to 25%, and gains may owe capital-gains tax (a 1031 exchange can defer both). Figures are a year-1 estimate at your 24.0% rate — not tax advice; consult a CPA.
Schools (NCES district)
- District
- Kilgore ISD
- NCES district ID
- 4825620
- Math proficiency
- 33% ▼ -6.00%
- Reading proficiency
- 38% ▲ 2.00%
- Median HH income
- $49,682
- Composite
- 30.72/100
- National rank
- #6168
- State rank
- #498 of 826 in TX
Livability — Kilgore
- Score
- 72/100
- State rank
- #257
- US rank
- #6044
Category grades
Schools grade is shown separately in the Schools card above.
Census & demographics
- Census place
- Kilgore, TX
- County
- Gregg County · 128,826 people
- City population
- 25,034
- Metro
- Longview, TX
- Population (ZIP)
- 25,034
- Household income
- $70,096
- Rent vs Own
- Severe rent burden
- 486.0
Population outlook (Rusk County) Hauer SSP2
- Today (2025)
- 52,498 people
- By 2030
- 52,093 · -0.8%
- By 2040
- 50,866 · -3.1%
- By 2050
- 49,696 · -5.3%
- By 2075
- 48,583 · -7.5%
- By 2100
- 43,265 · -17.6%
Race, ethnicity, and origin ACS 2023
- Neighborhood character
- Diverse neighborhood (Simpson 0.58)
- Race & ethnicity
- White 59% Hispanic / Latino 23% Two or more races 22% Black 11%
- Hispanic origin (detail)
- Mexican 21%
- Common ancestry
- Lithuanian 2% Slovak 1% Serbian 1%
- Foreign-born
- 9% · Canada
- Languages at home
- 81% English-only · Spanish 18%
Political lean MEDSL · Rusk
- 2024 margin
- Solid R (+59.4) · D 20.0% · R 79.4%
- 2008→2024 swing
- -13.2pp toward R · 2008: -46.3pp · 2024: -59.4pp
- All cycles
- 2024: R+59.4 2020: R+55.7 2016: R+56.5 2012: R+51.1 2008: R+46.3
Not yet ingested
- Civics
- —
Market trends
- HPI YoY
- ▼ -50.09%
- Current HPI
- 247.1337
- Rent YoY
- ▲ 8.89%
- Metro
- Longview, TX
- State GDP YoY
- ▲ 3.95%
- F500 in state
- 110
Industry mix (Fortune 500 HQ in TX)
| Industry | F500 HQs | Revenue |
|---|---|---|
| Energy | 16 | $1,198B |
|
||
| Technology | 5 | $198B |
|
||
| Engineering / Construction | 4 | $72B |
|
||
| Energy Services | 3 | $60B |
|
||
| Utilities | 3 | $41B |
|
||
| Healthcare | 2 | $330B |
|
||
Price history
3 events — show timeline
- 2026-06-02 Listed $140,000 LAAR
- 1973-01-24 Sold (Public Records) — Public Records
- 1969-09-25 Sold (Public Records) — Public Records
Property tax history
+3.6%/yrLatest (2025): $3,059 · -1.1% YoY. Source: county tax records.
Cash-flow waterfall
monthlySold comps — $/sqft
last 12 mo · ≤1 miLoading sold comps…