 🏗️ New Construction
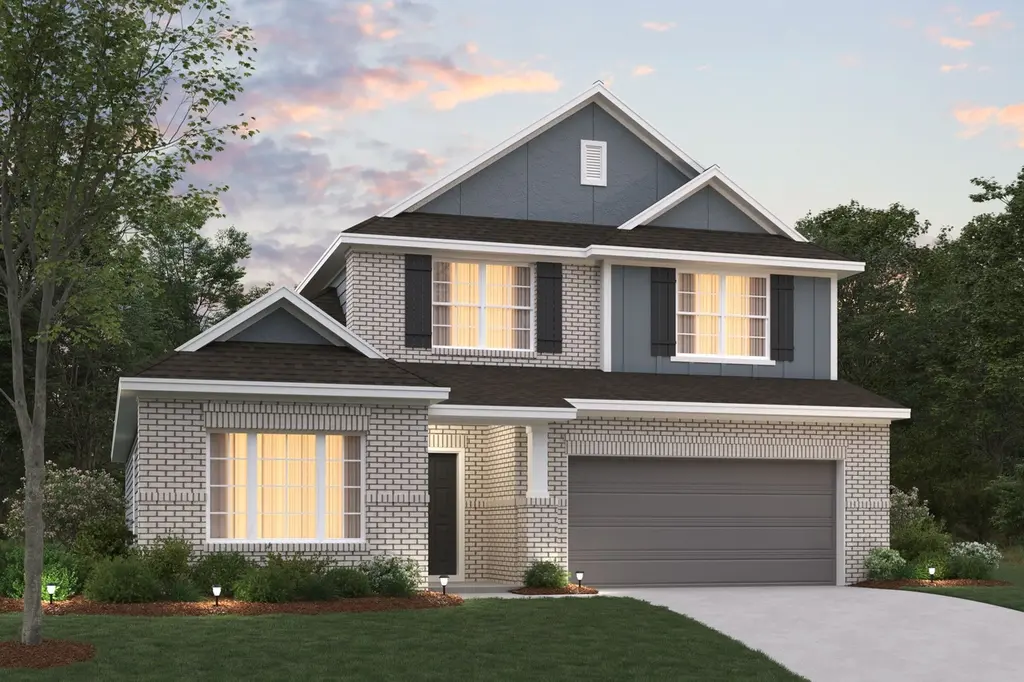
Barbosa Plan · Texas City, TX
Flood risk 1/10 · Minimal
- FEMA flood zone
- X (unshaded)
- Chance of flooding over 30 yrs
- 0.0%
- Est. flood insurance / yr
- $507 – $1,088
Fire risk 4/10 · Minor
- Est. fire insurance / yr
- $1,222 – $2,270
Heat risk 10/10 · Severe
- Hot days now (above 109°F)
- 7 days/yr
- Hot days in 30 yrs
- 24 days/yr
Wind risk 10/10 · Severe
- Chance of severe wind over 30 yrs
- 99.0%
Air-quality risk 2/10 · Minimal
- Unhealthy air days now
- 1 days/yr
- Unhealthy air days in 30 yrs
- 1 days/yr
Risk factors via First Street. Map © Google.
Why this score? — see what drove the C- grade
The composite is a weighted blend of 9 inputs, each scored 0–100. Each bar is that input's sub-score; the figure is the points it added to the 100-point composite (weight × sub-score).
- Cash flow +19.9/30.0
- ARV discount +7.5/15.0
- DSCR +6.3/10.0
- 1% rule +5.3/10.0
- Condition / age +4.0/5.0
- Schools +3.5/10.0
- Livability +3.1/5.0
- Rent growth +2.5/5.0
- Appreciation +0.0/10.0
$353,490
🖨 Deal sheet 📄 Offer letter ✓ Due diligence
Listing remarks MLS
This 2-story home plan is part of our Smart Series and features up to 4 bedrooms, 2.5 bathrooms, and a 2-car garage as standard, with the option to increase to enough space for 3 cars. It can reach over 2,400 sqft.
Key facts
- 2 garage spots
- Listed 469 days
Neighborhood map
What this means for you Summary
Snapshot
- This is a 4-bed/3.0-bath single-family listed at $353k. Condition is rated good.
Deal economics
- At list price, monthly cash flow is $426 ($5k/yr) — positive.
- The deal already cash-flows at list — no discount required.
- Meets the 1% rule at list price ($4k rent vs $353k).
- Recommended offer: $311k (12.0% below list) — sets the bar for market timing.
- Cap rate 7.7% vs local median 4.3% in Texas City — top-decile yield for the area; either an underpriced asset or a hidden risk that comps aren't pricing in. Stress-test before assuming the spread holds.
Location & tenants
- Location reads 62/100 on livability (#907 in TX) — a middle-class / working-renter tenant base. Strengths: cost of living A+, housing A+; Watch: crime D+, schools F, amenities F.
- Dickinson ISD (suburban): math 39% / reading 40% proficiency, ranked #366 of 826 in TX (top 44%) — families likely to look elsewhere, expect single-tenant / working-renter base with shorter leases; 60% free/reduced lunch — lower-income household profile, screen leases tightly.
- Market conditions: 233 active listings in the ZIP; 1 comparable units currently listed for rent nearby; 3,258 units permitted in Galveston County in 2024 (0 in 5+ unit buildings).
Forward outlook
- Local home prices are declining (-3.0%/yr); year-one equity from $2k of loan paydown is wiped out by about $11k of value loss. Plan a longer hold.
- Galveston County population projected at +43% by 2050 — long-run rental-demand tailwind backs the buy-and-hold thesis.
Negotiation context
- It's been on market 470 days — a 12% lower offer ($311k) is reasonable based on typical stale-listing flexibility.
Risks & watch-outs
- Climate carrying-cost: severe wind risk, 99% chance of damaging wind over 30y; extreme-heat days projected 7→24/yr by 2055 (HVAC capex compounding) — expect insurance premiums to compound above CPI over the hold.
Questions for the listing agent
- It's been on market 470 days. Have you received any prior offers? Is the seller open to a 12% concession, seller financing, or rate buy-down credit?
- Why hasn't it sold? Are there any deal-killer items the seller is aware of (foundation, flood, title, zoning, code violations)?
- Is there a deadline driving the sale (1031 exchange, divorce, estate, relocation)? That informs how much negotiation room exists.
- Schools are F-rated, which usually means shorter tenancies and higher turnover. Who's the typical renter profile here, and what's been the actual vacancy rate?
- Crime grade is D in this area — have there been break-ins, vandalism, or insurance claims at this property in the last 3 years? What carrier currently insures it and at what premium?
- What's the average days-on-market for RENTAL listings here right now (not sales)? A rising rental-DOM trend means longer vacancies and softer asking-rent achievability than the comps imply.
- What's the recent tenant-quality profile in this submarket — average credit score on applications, eviction rate, late-payment / NSF rate, and stable-employment percentage? A property-management company in the area should have these aggregated.
- How much new for-sale + rental construction is in the pipeline within 1–3 miles? Heavy new supply typically softens prices + rents 12–24 months out; constrained supply supports both.
Investment metrics
- 1% rule
- 1.03% ✓
- Cap rate
- 7.74%
- Cash-on-cash
- 5.17%
- DSCR
- 1.23
- GRM
- 8.1
CMA / ARV
- ARV (median comp)
- $353,332
- List price
- $353,490
- Delta
- 0.04%
- Verdict
- FAIR
- Comps
- 20 within 1.0 mi
Show comp detail 12 sales within ~0.75 mi
| Address | Dist | Beds/Ba | Sqft | Sold | Price | $/sf | Match |
|---|---|---|---|---|---|---|---|
| 3214 Bolt Rope Dr | 0.25mi | 4/2.5 | 2,452 (+1%) | 1mo | $339,990 | $139 | 84 |
| 14121 Baikal Manor Dr | 0.12mi | 4/3.0 | 2,214 (-9%) | 1mo | $349,990 | $158 | 80 |
| 3406 Bright Keel Dr | 0.34mi | 4/3.0 | 2,582 (+7%) | 0mo | $396,990 | $154 | 73 |
| 13601 Fairway Arbor Dr | 0.39mi | 3/2.5 (-1) | 2,377 (-2%) | 1mo | $394,990 | $166 | 71 |
| 14006 Baikal Manor Dr | 0.14mi | 4/2.0 | 2,126 (-12%) | 1mo | $325,990 | $153 | 68 |
| 3315 Hidden Mist Dr | 0.17mi | 3/2.5 (-1) | 2,160 (-11%) | 1mo | $344,990 | $160 | 67 |
| 14117 Baikal Manor Dr | 0.12mi | 4/2.0 | 2,063 (-15%) | 1mo | $312,990 | $152 | 65 |
| 13602 Hartwell Bend Dr | 0.28mi | 4/4.0 | 2,679 (+11%) | 1mo | $499,990 | $187 | 65 |
| 2820 Mackinac Bay Dr | 0.62mi | 3/2.0 (-1) | 2,517 (+4%) | 1mo | $441,990 | $176 | 55 |
| 14318 Lunan Dr | 0.73mi | 4/2.5 | 2,280 (-6%) | 1mo | $364,987 | $160 | 53 |
| 2816 Mackinac Bay Dr | 0.63mi | 4/3.5 | 2,666 (+10%) | 1mo | $452,990 | $170 | 51 |
| 13507 Golden Isle Dr | 0.54mi | 4/3.5 | 2,772 (+14%) | 1mo | $448,775 | $162 | 48 |
Match score weights: distance 35% · size 25% · config 20% · recency 20%. Top-matched comps best support the ARV.
Projected returns pro-forma
-3.0% appreciation · 3.0% rent growth · sell at horizon
- IRR
- -8.3%
- Equity multiple
- 0.70×
- Total profit
- $-30,074
- Equity at exit
- $52,683
- IRR
- 1.3%
- Equity multiple
- 1.09×
- Total profit
- $8,963
- Equity at exit
- $30,550
Cash invested: $98,933 (down + closing). Projections, not guarantees.
Landlord ↔ Tenant lean methodology
- Overall (STATE)
- 87 Strongly Landlord-Friendly
- State Texas
- 87 Strongly Landlord-Friendly · R+5
- County
- — inherits STATE
- City
- — inherits STATE
ZIP-level market 77510
- Home prices YoY
- -15.3%
- Active inventory
- 233
- Price-to-rent
- 8.1×
Monthly cashflow live
- Estimated rent
- $3,630 medium interval (Pro) →
- Mortgage (P&I)
- −$1,853
- Tax est. 1.5%
- −$442 /mo · $5,300/yr
- Insurance
- −$147
- HOA
- −$0
- Vacancy / Maint / Mgmt
- −$762
- Net cashflow
- $426
Break-even live
UW: 25.0% down · 7.5% · 30yr · 1.5% tax · 5.0% vac · 8.0% maint · 8.0% mgmt
Financing live
Cash to close
- Down payment
- $88,333
- Closing costs
- $10,600
- Reserves months
- —
- Total cash needed
- —
Loan-product check · same deal, 3 products live
Conventional
25% down · 7.5% · 30yr
- Down + closing
- —
- Monthly P&I
- —
- Monthly cashflow
- —
- DSCR
- —
- Eligible?
- —
Personal DTI + credit; lowest rate.
DSCR
20% down · 8.5% · 30yr
- Down + closing
- —
- Monthly P&I
- —
- Monthly cashflow
- —
- DSCR
- —
- Eligible?
- —
No personal income docs; deal must DSCR.
Hard money
10% down · 12.0% · 12mo
- Down + closing
- —
- Monthly P&I
- —
- Monthly cashflow
- —
- DSCR
- —
- Eligible?
- —
Short-term bridge; refi at stabilization.
Rent comps 1 comps
| Address | Beds | Baths | Sqft | Rent | $/sqft | DOM | Units | Dist |
|---|---|---|---|---|---|---|---|---|
| 13817 Starboard Reach Dr Santa Fe, TX | 3.0–4.0 | 2.0–3.5 | 2268 | $3,630 | $1.60 | 1d | 1 | 0.26mi |
Listing history 19 events
-
2026-06-18days on market $353,490 Active 470 DOM
-
2026-06-17days on market $353,490 Active 469 DOM
-
2026-06-16days on market $353,490 Active 468 DOM
-
2026-06-15days on market $353,490 Active 467 DOM
-
2026-06-13days on market $353,490 Active 465 DOM
-
2026-06-09days on market $353,490 Active 461 DOM
-
2026-06-08days on market $353,490 Active 460 DOM
-
2026-06-07days on market $353,490 Active 459 DOM
-
2026-06-04days on market $353,490 Active 456 DOM
-
2026-06-03days on market $353,490 Active 455 DOM
-
2026-06-02days on market $353,490 Active 454 DOM
-
2026-06-02days on market $353,490 Active 453 DOM
-
2026-05-31days on market $353,490 Active 452 DOM
-
2026-04-03price $352,990 214-char remark
Show marketing remark (214 chars)
This 2-story home plan is part of our Smart Series and features up to 4 bedrooms, 2.5 bathrooms, and a 2-car garage as standard, with the option to increase to enough space for 3 cars. It can reach over 2,400 sqft.
-
2026-03-05price $352,490 214-char remark
Show marketing remark (214 chars)
This 2-story home plan is part of our Smart Series and features up to 4 bedrooms, 2.5 bathrooms, and a 2-car garage as standard, with the option to increase to enough space for 3 cars. It can reach over 2,400 sqft.
-
2025-07-02price $351,990 214-char remark
Show marketing remark (214 chars)
This 2-story home plan is part of our Smart Series and features up to 4 bedrooms, 2.5 bathrooms, and a 2-car garage as standard, with the option to increase to enough space for 3 cars. It can reach over 2,400 sqft.
-
2025-04-08price $350,990 214-char remark
Show marketing remark (214 chars)
This 2-story home plan is part of our Smart Series and features up to 4 bedrooms, 2.5 bathrooms, and a 2-car garage as standard, with the option to increase to enough space for 3 cars. It can reach over 2,400 sqft.
-
2025-03-08price $360,990 214-char remark
Show marketing remark (214 chars)
This 2-story home plan is part of our Smart Series and features up to 4 bedrooms, 2.5 bathrooms, and a 2-car garage as standard, with the option to increase to enough space for 3 cars. It can reach over 2,400 sqft.
-
2025-03-06$360,490 Active 214-char remark
Show marketing remark (214 chars)
This 2-story home plan is part of our Smart Series and features up to 4 bedrooms, 2.5 bathrooms, and a 2-car garage as standard, with the option to increase to enough space for 3 cars. It can reach over 2,400 sqft.
ⓘ Source: listings_history table (triggers on properties + properties_extension) + one-shot
backfill from property_details.listing_events for pre-trigger history.
Climate risk First Street
- Flood 1/10 Low FEMA zone X (unshaded) · 0% chance over 30 yrs
- Wildfire 4/10 Moderate
- Heat 10/10 Extreme 7 d/yr ≥109°F today · 24 d/yr by 30 yrs out
- Wind 10/10 Extreme 99% chance of damaging wind over 30 yrs
- Air quality 2/10 Low 1 unhealthy d/yr today · 1 by 30 yrs out
Nearby sold comps map
Loading sold comps map…
Walkable amenities ~0.75 mi
Loading nearby amenities…
Taxation est. · year 1
- Rental income
- $43,560
- − Mortgage interest
- −$19,792
- − Property taxes
- −$5,300
- − Insurance
- −$1,767
- − Repairs & maintenance
- −$3,485
- − Management
- −$3,485
- − Depreciation
- −$10,279
- Taxable loss
- −$547
- Est. tax savings @ 24.0%
- +$131
- After-tax cash flow
- $5,242/yr
For passive investors: Depreciation is non-cash, so a rental often shows a tax loss while cash-flowing — sheltering income. Rental losses are passive: they offset passive income freely, and up to $25,000/yr can offset ordinary (W-2) income if you actively participate and your MAGI is under $100k (phasing out to $0 by $150k); unused losses carry forward. On sale, claimed depreciation is recaptured at up to 25%, and gains may owe capital-gains tax (a 1031 exchange can defer both). Figures are a year-1 estimate at your 24.0% rate — not tax advice; consult a CPA.
Condition & rehab AI · 12 photos
This well-maintained, move-in-ready home with a good condition score and no major repairs needed is a solid investment opportunity.
Value-add opportunities
- Both Painting exterior brick and siding — Enhances curb appeal and can increase both resale and rental value.
- Both Landscaping improvements — Enhances curb appeal and can increase both resale and rental value.
- Resale Kitchen appliances — Modern appliances can attract more buyers and renters.
- Resale Bathroom fixtures — Upgraded fixtures can attract more buyers and renters.
- Resale Flooring in bathrooms — Updated flooring can attract more buyers and renters.
- Resale Painting interior walls — Fresh paint can make the home more appealing to buyers and renters.
- Resale Landscaping around the front door — A well-maintained front yard can attract more buyers and renters.
- Both Lighting improvements — Better lighting can enhance curb appeal and make the home more inviting for buyers and renters.
Renovation cost estimate screening
Value-add ROI direction
- Both Painting exterior brick and siding — Enhances curb appeal and can increase both resale and rental value. ↑
- Both Landscaping improvements — Enhances curb appeal and can increase both resale and rental value. ↑
- Resale Kitchen appliances — Modern appliances can attract more buyers and renters. ↑
- Resale Bathroom fixtures — Upgraded fixtures can attract more buyers and renters. ↑
- Resale Flooring in bathrooms — Updated flooring can attract more buyers and renters. ↑
- Resale Painting interior walls — Fresh paint can make the home more appealing to buyers and renters. ↑
- Resale Landscaping around the front door — A well-maintained front yard can attract more buyers and renters. ↑
- Both Lighting improvements — Better lighting can enhance curb appeal and make the home more inviting for buyers and renters. ↑
ⓘ Cost ranges are severity-bucket heuristics (US national rule-of-thumb). Get contractor quotes + a written scope before underwriting a rehab budget.
Schools (NCES district)
- District
- Dickinson ISD
- NCES district ID
- 4817070
- Math proficiency
- 39% ▼ -11.00%
- Reading proficiency
- 40% ▼ -2.00%
- Median HH income
- $61,318
- Composite
- 35.16/100
- National rank
- #5005
- State rank
- #366 of 826 in TX
Livability — Texas City
- Score
- 62/100
- State rank
- #907
- US rank
- #16268
Category grades
Schools grade is shown separately in the Schools card above.
Census & demographics
- Census place
- Texas City, TX
- City population
- 49,936
- Population (ZIP)
- 13,938
Population outlook (Galveston County) Hauer SSP2
- Today (2025)
- 390,640 people
- By 2030
- 425,226 · +8.9%
- By 2040
- 493,765 · +26.4%
- By 2050
- 559,698 · +43.3%
- By 2075
- 719,260 · +84.1%
- By 2100
- 819,628 · +109.8%
Race, ethnicity, and origin ACS 2023
- Neighborhood character
- Predominantly White (72%)
- Race & ethnicity
- White 72% Hispanic / Latino 21% Two or more races 17% Asian 2%
- Hispanic origin (detail)
- Mexican 14% Puerto Rican 3% Cuban 1%
- Common ancestry
- Lithuanian 4% Italian 3% Slovak 1%
- Foreign-born
- 5% · Canada
- Languages at home
- 89% English-only · Spanish 10% Tagalog/Filipino 1%
Political lean MEDSL · Galveston
- 2024 margin
- Strong R (+27.4) · D 35.7% · R 63.1% · Other 1.2%
- 2008→2024 swing
- -7.9pp toward R · 2008: -19.5pp · 2024: -27.4pp
- All cycles
- 2024: R+27.4 2020: R+22.6 2016: R+22.6 2012: R+26.9 2008: R+19.5
Not yet ingested
- Civics
- —
Market trends
- HPI YoY
- ▼ -54.15%
- Current HPI
- 299.2228
- Rent YoY
- —
- Metro
- —
- State GDP YoY
- ▲ 3.95%
- F500 in state
- 110
Industry mix (Fortune 500 HQ in TX)
| Industry | F500 HQs | Revenue |
|---|---|---|
| Energy | 16 | $1,198B |
|
||
| Technology | 5 | $198B |
|
||
| Engineering / Construction | 4 | $72B |
|
||
| Energy Services | 3 | $60B |
|
||
| Utilities | 3 | $41B |
|
||
| Healthcare | 2 | $330B |
|
||
Price history
-2.1% since first listed6 events — show timeline
- 2026-04-03 Price Changed $352,990 Zillow
- 2026-03-05 Price Changed $352,490 Zillow
- 2025-07-02 Price Changed $351,990 Zillow
- 2025-04-08 Price Changed $350,990 Zillow
- 2025-03-08 Price Changed $360,990 Zillow
- 2025-03-06 Listed $360,490 Zillow
Cash-flow waterfall
monthlySold comps — $/sqft
last 12 mo · ≤1 miLoading sold comps…