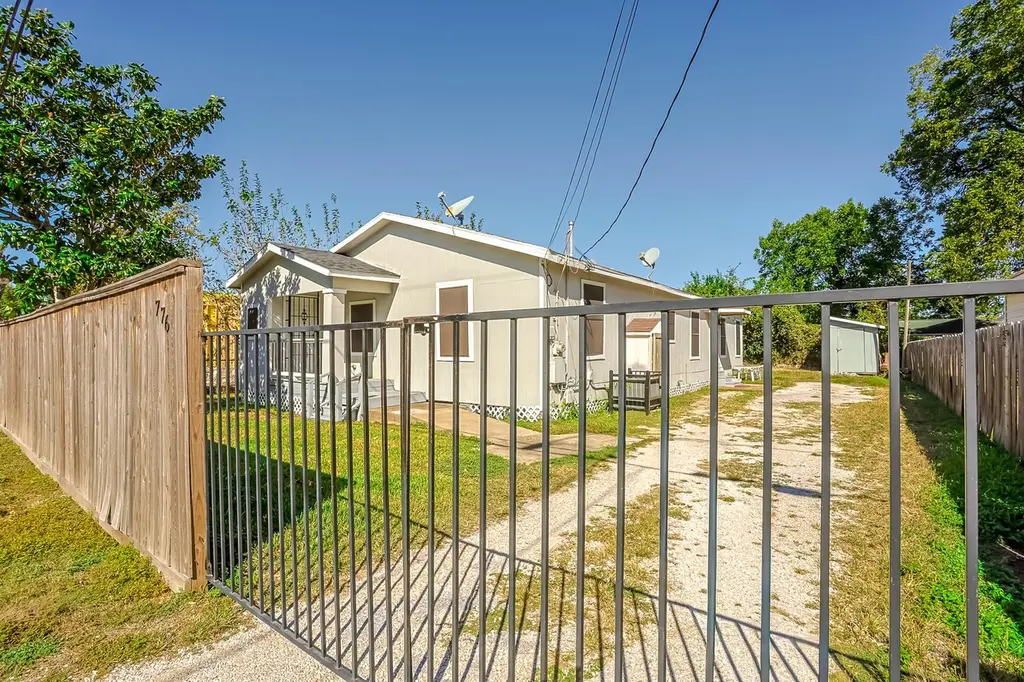
776 Fair St · Houston, TX
Flood risk 1/10 · Minimal
- FEMA flood zone
- X (unshaded)
- Chance of flooding over 30 yrs
- 0.0%
- Est. flood insurance / yr
- $507 – $1,088
Fire risk 1/10 · Minimal
- Est. fire insurance / yr
- $1,222 – $2,270
Heat risk 9/10 · Severe
- Hot days now (above 109°F)
- 7 days/yr
- Hot days in 30 yrs
- 24 days/yr
Wind risk 9/10 · Severe
- Chance of severe wind over 30 yrs
- 99.0%
Air-quality risk 3/10 · Minor
- Unhealthy air days now
- 3 days/yr
- Unhealthy air days in 30 yrs
- 4 days/yr
Risk factors via First Street. Map © Google.
Why this score? — see what drove the C- grade
The composite is a weighted blend of 9 inputs, each scored 0–100. Each bar is that input's sub-score; the figure is the points it added to the 100-point composite (weight × sub-score).
- Cash flow +15.9/30.0
- ARV discount +15.0/15.0
- 1% rule +5.2/10.0
- DSCR +4.9/10.0
- Livability +3.7/5.0
- Schools +2.7/10.0
- Condition / age +2.5/5.0
- Rent growth +2.2/5.0
- Appreciation +0.0/10.0
$193,500
🖨 Deal sheet 📄 Offer letter ✓ Due diligence
Listing remarks MLS
COME SEE THIS CHARMING 3-BEDROOM, 2-BATH HOME OFFERING COMFORT, CONVENIENCE, AND CHARACTER! The primary bedroom features a spacious walking-in closet, while the laundry room and well- designed kitchen make daily living a breeze. Enjoy gathering in the cozy Family room or outdoors on the yard, perfect for relaxing. Recent improvements include updated plumbing and a water system. Conveniently located with easy access to I-45N and just 20 minutes from downtown.
Key facts
- Walking-in closet
- Easy access to i-45n
- Updated plumbing
Tags
Neighborhood map
What this means for you Summary
Snapshot
- This is a 3-bed/2.0-bath single-family listed at $194k.
Deal economics
- At list price, monthly cash flow is $92 ($1k/yr) — positive.
- The deal already cash-flows at list — no discount required.
- Meets the 1% rule at list price ($2k rent vs $194k).
- Recommended offer: $182k (6.0% below list) — sets the bar for market timing.
- Cap rate 6.9% vs local median 3.2% in Houston — top-decile yield for the area; either an underpriced asset or a hidden risk that comps aren't pricing in. Stress-test before assuming the spread holds.
Location & tenants
- Location reads 74/100 on livability (#184 in TX, #4,771 nationally) — a middle-class / working-renter tenant base. Strengths: amenities A+, cost of living A+, housing A+; Watch: schools D, crime F.
- Houston ISD (urban): math 27% / reading 35% proficiency, ranked #593 of 826 in TX (top 72%) — families likely to look elsewhere, expect single-tenant / working-renter base with shorter leases; 71% free/reduced lunch — lower-income household profile, screen leases tightly.
- Market conditions: Rents soft (-1.0%/yr); 468 active listings in the ZIP; 28 comparable units currently listed for rent nearby; rentals lingering (median 44d on market — plan ~5-8 weeks vacancy on turnover, expect pricing pressure); 54% of comp listings sitting > 30 days — soft ceiling on asking rent; 29,883 units permitted in Harris County in 2024 (8,621 in 5+ unit buildings).
- This rent runs 43% of the median local income ($54k/yr) — at the standard rent-burdened threshold; future hikes will face affordability resistance.
Forward outlook
- Local home prices are declining (-3.0%/yr); year-one equity from $1k of loan paydown is wiped out by about $6k of value loss. Plan a longer hold.
- Harris County population projected at +47% by 2050 — long-run rental-demand tailwind backs the buy-and-hold thesis.
Negotiation context
- It's been on market 84 days — a 6% lower offer ($182k) is reasonable based on typical stale-listing flexibility.
- 3 sale attempts since 10y ago with the ask held roughly flat each time — persistent listings suggest the price (not the market) is what's stuck; bring a comps-based counter.
Risks & watch-outs
- Watch-outs: built in 1940 — expect roof / HVAC / electrical / plumbing capex.
- Climate carrying-cost: severe wind risk, 99% chance of damaging wind over 30y; extreme-heat days projected 7→24/yr by 2055 (HVAC capex compounding) — expect insurance premiums to compound above CPI over the hold.
Questions for the listing agent
- It's been on market 84 days. Have you received any prior offers? Is the seller open to a 6% concession, seller financing, or rate buy-down credit?
- Built in 1940 — when were the roof, HVAC, electrical panel, plumbing, and water heater last replaced?
- Why hasn't it sold? Are there any deal-killer items the seller is aware of (foundation, flood, title, zoning, code violations)?
- Is there a deadline driving the sale (1031 exchange, divorce, estate, relocation)? That informs how much negotiation room exists.
- Schools are D-rated, which usually means shorter tenancies and higher turnover. Who's the typical renter profile here, and what's been the actual vacancy rate?
- Crime grade is F in this area — have there been break-ins, vandalism, or insurance claims at this property in the last 3 years? What carrier currently insures it and at what premium?
- What's the average days-on-market for RENTAL listings here right now (not sales)? A rising rental-DOM trend means longer vacancies and softer asking-rent achievability than the comps imply.
- What's the recent tenant-quality profile in this submarket — average credit score on applications, eviction rate, late-payment / NSF rate, and stable-employment percentage? A property-management company in the area should have these aggregated.
- How much new for-sale + rental construction is in the pipeline within 1–3 miles? Heavy new supply typically softens prices + rents 12–24 months out; constrained supply supports both.
Investment metrics
- 1% rule
- 1.02% ✓
- Cap rate
- 6.87%
- Cash-on-cash
- 2.05%
- DSCR
- 1.09
- GRM
- 8.2
CMA / ARV
- ARV (median comp)
- $248,081
- List price
- $193,500
- Delta
- -22.00%
- Verdict
- UNDERPRICED
- Comps
- 20 within 1.0 mi
Show comp detail 12 sales within ~0.75 mi
| Address | Dist | Beds/Ba | Sqft | Sold | Price | $/sf | Match |
|---|---|---|---|---|---|---|---|
| 866 N Victory Dr | 0.28mi | 3/2.0 | 1,510 (+0%) | 7mo | $109,900 | $73 | 80 |
| 882 Fortune St St | 0.30mi | 3/2.5 | 1,379 (-8%) | 0mo | $265,000 | $192 | 70 |
| 8414 Williamsdell St | 0.42mi | 3/2.0 | 1,410 (-6%) | 1mo | $210,000 | $149 | 69 |
| 940 Lucky St | 0.54mi | 3/2.0 | 1,536 (+2%) | 8mo | $249,900 | $163 | 64 |
| 863 Dolly Wright St | 0.48mi | 3/2.5 | 1,448 (-4%) | 9mo | $251,000 | $173 | 62 |
| 905 Ferguson Way | 0.45mi | 3/1.0 | 1,582 (+5%) | 6mo | $105,000 | $66 | 61 |
| 773 Lucky St | 0.22mi | 4/2.0 (+1) | 1,660 (+10%) | 8mo | $180,000 | $108 | 61 |
| 954 B Junell St | 0.43mi | 3/2.5 | 1,617 (+8%) | 10mo | $265,000 | $164 | 57 |
| 797 Millville Dr | 0.54mi | 3/2.0 | 1,348 (-10%) | 13mo | $249,900 | $185 | 47 |
| 885 W Little York Rd | 0.55mi | 3/1.5 | 1,344 (-11%) | 12mo | $155,000 | $115 | 44 |
| 774 Green Meadow Ln | 0.46mi | 3/2.0 | 1,296 (-14%) | 14mo | $195,000 | $150 | 44 |
| 902 Lucky St | 0.43mi | 3/2.5 | 1,727 (+15%) | 12mo | $285,000 | $165 | 44 |
Match score weights: distance 35% · size 25% · config 20% · recency 20%. Top-matched comps best support the ARV.
Projected returns pro-forma
-3.0% appreciation · 0.0% rent growth · sell at horizon
- IRR
- -16.7%
- Equity multiple
- 0.43×
- Total profit
- $-31,118
- Equity at exit
- $28,851
- IRR
- -15.9%
- Equity multiple
- 0.24×
- Total profit
- $-41,341
- Equity at exit
- $16,730
Cash invested: $54,180 (down + closing). Projections, not guarantees.
Landlord ↔ Tenant lean methodology
- Overall (STATE)
- 87 Strongly Landlord-Friendly
- State Texas
- 87 Strongly Landlord-Friendly · R+5
- County
- — inherits STATE
- City
- — inherits STATE
ZIP-level market 77088
- Home prices YoY
- -23.2%
- Rents YoY
- -1.0%
- Active inventory
- 468
- Price-to-rent
- 8.2×
Monthly cashflow live
- Estimated rent
- $1,965 high interval (Pro) →
- Mortgage (P&I)
- −$1,015
- Tax from tax record
- −$365 /mo · $4,375/yr
- Insurance
- −$81
- HOA
- −$0
- Vacancy / Maint / Mgmt
- −$413
- Net cashflow
- $92
Break-even live
UW: 25.0% down · 7.5% · 30yr · 1.5% tax · 5.0% vac · 8.0% maint · 8.0% mgmt
Financing live
Cash to close
- Down payment
- $48,375
- Closing costs
- $5,805
- Reserves months
- —
- Total cash needed
- —
Loan-product check · same deal, 3 products live
Conventional
25% down · 7.5% · 30yr
- Down + closing
- —
- Monthly P&I
- —
- Monthly cashflow
- —
- DSCR
- —
- Eligible?
- —
Personal DTI + credit; lowest rate.
DSCR
20% down · 8.5% · 30yr
- Down + closing
- —
- Monthly P&I
- —
- Monthly cashflow
- —
- DSCR
- —
- Eligible?
- —
No personal income docs; deal must DSCR.
Hard money
10% down · 12.0% · 12mo
- Down + closing
- —
- Monthly P&I
- —
- Monthly cashflow
- —
- DSCR
- —
- Eligible?
- —
Short-term bridge; refi at stabilization.
Rent comps 28 comps
| Address | Beds | Baths | Sqft | Rent | $/sqft | DOM | Units | Dist |
|---|---|---|---|---|---|---|---|---|
| 783 Fortune St Unit A Houston, TX | 3.0 | 2.5 | 1328 | $1,795 | $1.35 | 16d | 1 | 0.03mi |
| 855 S Victory Dr Unit C Houston, TX | 3.0 | 2.5 | 1546 | $2,300 | $1.49 | 43d | 1 | 0.20mi |
| 8108 De Priest St Unit B Houston, TX | 3.0 | 2.5 | 1500 | $1,900 | $1.27 | 43d | 1 | 0.32mi |
| 8110 De Priest St Unit A Houston, TX | 3.0 | 2.5 | 1500 | $1,900 | $1.27 | 43d | 1 | 0.33mi |
| 8112 De Priest St Unit B Houston, TX | 3.0 | 2.5 | 1500 | $1,900 | $1.27 | 43d | 1 | 0.33mi |
| 7486 N Shepherd Dr Houston, TX | 3.0 | 2.0 | 1177 | $1,290 | $1.10 | 43d | 1 | 0.34mi |
| 8118 De Priest St Unit B Houston, TX | 3.0 | 2.5 | 1500 | $1,900 | $1.27 | 43d | 1 | 0.35mi |
| 8120 De Priest St Unit B Houston, TX | 3.0 | 2.5 | 1500 | $1,900 | $1.27 | 43d | 1 | 0.35mi |
| 8120 De Priest St Unit A Houston, TX | 3.0 | 2.5 | 1500 | $1,750 | $1.17 | 43d | 1 | 0.35mi |
| 8122 De Priest St Unit A Houston, TX | 3.0 | 3.5 | 1500 | $1,900 | $1.27 | 43d | 1 | 0.35mi |
| 8304 De Priest St Unit B Houston, TX | 3.0 | 2.5 | 1600 | $1,900 | $1.19 | 22d | 1 | 0.36mi |
| 8306 De Priest St Unit A Houston, TX | 3.0 | 2.5 | 1500 | $1,900 | $1.27 | 20d | 1 | 0.37mi |
| 8310 De Priest St Unit B Houston, TX | 3.0 | 2.5 | 1500 | $1,900 | $1.27 | 20d | 1 | 0.37mi |
| 8312 De Priest St Unit A Houston, TX | 3.0 | 2.5 | 1500 | $1,900 | $1.27 | 20d | 1 | 0.38mi |
| 8312 De Priest St Unit B Houston, TX | 3.0 | 3.5 | 1500 | $1,900 | $1.27 | 20d | 1 | 0.38mi |
| 8404 De Priest St Unit A Houston, TX | 3.0 | 2.5 | 1600 | $1,900 | $1.19 | 43d | 1 | 0.40mi |
| 8406 De Priest St Unit A Houston, TX | 3.0 | 2.5 | 1600 | $1,695 | $1.06 | 43d | 1 | 0.41mi |
| 929 Marjorie St Unit 1060806P Houston, TX | 3.0 | 2.0 | 1076 | $3,091 | $2.87 | 7d | 1 | 0.45mi |
| 774 Dillard St Houston, TX | 4.0 | 2.5 | 1899 | $2,405 | $1.27 | 20d | 1 | 0.73mi |
| 301 W Little York Rd Unit 1722 Houston, TX | 2.0 | 2.0 | 1322 | $1,230 | $0.93 | 20d | 1 | 0.81mi |
| 1032 Glen Ln Houston, TX | 3.0 | 3.0 | 1667 | $2,400 | $1.44 | 43d | 1 | 0.86mi |
| 6513 Knox St Houston, TX | 4.0 | 3.0 | 1773 | $2,100 | $1.18 | 43d | 1 | 1.09mi |
| 9002 Bunny Run Dr Houston, TX | 3.0 | 2.0 | 1544 | $1,950 | $1.26 | 24d | 1 | 1.17mi |
| 7514 Sandle St Houston, TX | 3.0 | 2.5 | 1523 | $1,999 | $1.31 | 43d | 1 | 1.21mi |
| 1438 Peach Spring Dr Houston, TX | 4.0 | 1.5 | 1288 | $1,599 | $1.24 | 1d | 1 | 1.25mi |
| 1450 Dewalt St Houston, TX | 3.0 | 2.5 | 1371 | $2,500 | $1.82 | 43d | 1 | 1.33mi |
| 6127 W Montgomery Rd Houston, TX | 3.0 | 3.0 | 1786 | $2,000 | $1.12 | 24d | 1 | 1.35mi |
| 411 E Carby Rd Houston, TX | 4.0 | 1.5 | 1806 | $1,649 | $0.91 | 22d | 1 | 1.36mi |
Listing history 12 events
-
2026-03-01$193,500 Active 469-char remark
Show marketing remark (469 chars)
COME SEE THIS CHARMING 3-BEDROOM, 2-BATH HOME OFFERING COMFORT, CONVENIENCE, AND CHARACTER! The primary bedroom features a spacious walking-in closet, while the laundry room and well- designed kitchen make daily living a breeze. Enjoy gathering in the cozy Family room or outdoors on the yard, perfect for relaxing. Recent improvements include updated plumbing and a water system. Conveniently located with easy access to I-45N and just 20 minutes from downtown.
-
2026-02-01historical
-
2026-01-02price $205,000
-
2025-11-01$225,000 Active
-
2017-05-01soldstatus
-
2017-04-28soldstatus Sold
-
2017-04-10status Pending
-
2017-04-09status Option Pending
-
2017-01-27price $125,000
-
2016-11-29$87,000 Active
-
2016-11-23soldstatus
-
1988-01-02soldstatus
ⓘ Source: listings_history table (triggers on properties + properties_extension) + one-shot
backfill from property_details.listing_events for pre-trigger history.
Tax reassessment forecast TX · Resets to sale price
- Current annual tax
- $4,375 · $365/mo
- Projected year-2 tax
- $4,375 · $365/mo
- Expected delta
- $0/yr ($0/mo · 0.0%)
ⓘ Screening estimate from a state-policy table — verify with the county assessor before closing.
Climate risk First Street
- Flood 1/10 Low FEMA zone X (unshaded) · 0% chance over 30 yrs
- Wildfire 1/10 Low
- Heat 9/10 Extreme 7 d/yr ≥109°F today · 24 d/yr by 30 yrs out
- Wind 9/10 Extreme 99% chance of damaging wind over 30 yrs
- Air quality 3/10 Moderate 3 unhealthy d/yr today · 4 by 30 yrs out
Nearby sold comps map
Loading sold comps map…
Walkable amenities ~0.75 mi
Loading nearby amenities…
Taxation est. · year 1
- Rental income
- $23,582
- − Mortgage interest
- −$10,839
- − Property taxes
- −$4,375
- − Insurance
- −$968
- − Repairs & maintenance
- −$1,887
- − Management
- −$1,887
- − Depreciation
- −$5,629
- Taxable loss
- −$2,002
- Est. tax savings @ 24.0%
- +$481
- After-tax cash flow
- $1,591/yr
For passive investors: Depreciation is non-cash, so a rental often shows a tax loss while cash-flowing — sheltering income. Rental losses are passive: they offset passive income freely, and up to $25,000/yr can offset ordinary (W-2) income if you actively participate and your MAGI is under $100k (phasing out to $0 by $150k); unused losses carry forward. On sale, claimed depreciation is recaptured at up to 25%, and gains may owe capital-gains tax (a 1031 exchange can defer both). Figures are a year-1 estimate at your 24.0% rate — not tax advice; consult a CPA.
Schools (NCES district)
- District
- Houston ISD
- NCES district ID
- 4823640
- Math proficiency
- 27% ▼ -18.00%
- Reading proficiency
- 35% ▼ -6.00%
- Median HH income
- $46,054
- Composite
- 26.63/100
- National rank
- #7173
- State rank
- #593 of 826 in TX
Livability — Houston
- Score
- 74/100
- State rank
- #184
- US rank
- #4771
Category grades
Schools grade is shown separately in the Schools card above.
Census & demographics
- Census place
- Houston, TX
- County
- Harris County · 4,702,590 people
- City population
- 3,226,434
- Metro
- Houston-The Woodlands-Sugar Land, TX
- Population (ZIP)
- 57,047
- Household income
- $54,411
- Rent vs Own
- Severe rent burden
- 2294.0
Population outlook (Harris County) Hauer SSP2
- Today (2025)
- 5,571,493 people
- By 2030
- 6,089,821 · +9.3%
- By 2040
- 7,142,806 · +28.2%
- By 2050
- 8,185,864 · +46.9%
- By 2075
- 10,574,329 · +89.8%
- By 2100
- 12,109,958 · +117.4%
Race, ethnicity, and origin ACS 2023
- Neighborhood character
- Diverse neighborhood (Simpson 0.59)
- Race & ethnicity
- Hispanic / Latino 52% Black 37% Two or more races 18% White 6% Asian 4%
- Hispanic origin (detail)
- Mexican 36%
- Common ancestry
- Lithuanian 1%
- Foreign-born
- 25% · Canada, Vietnam, China
- Languages at home
- 49% English-only · Spanish 47% Vietnamese 3%
Political lean MEDSL · Harris
- 2024 margin
- Lean D (+5.5) · D 52.0% · R 46.4% · Other 1.6%
- 2008→2024 swing
- +3.9pp toward D · 2008: 1.6pp · 2024: 5.5pp
- All cycles
- 2024: D+5.5 2020: D+13.3 2016: D+12.4 2012: D+0.1 2008: D+1.6
Not yet ingested
- Civics
- —
Market trends
- HPI YoY
- ▼ -98.37%
- Current HPI
- 325.0499
- Rent YoY
- ▼ -1.01%
- Metro
- Houston-The Woodlands-Sugar Land, TX
- State GDP YoY
- ▲ 3.95%
- F500 in state
- 110
Industry mix (Fortune 500 HQ in TX)
| Industry | F500 HQs | Revenue |
|---|---|---|
| Energy | 16 | $1,198B |
|
||
| Technology | 5 | $198B |
|
||
| Engineering / Construction | 4 | $72B |
|
||
| Energy Services | 3 | $60B |
|
||
| Utilities | 3 | $41B |
|
||
| Healthcare | 2 | $330B |
|
||
Price history
+122.4% since first listed12 events — show timeline
- 2026-03-01 Listed $193,500 HARMLS
- 2026-02-01 Listing Removed — HARMLS
- 2026-01-02 Price Changed $205,000 HARMLS
- 2025-11-01 Listed $225,000 HARMLS
- 2017-05-01 Sold (Public Records) — Public Records
- 2017-04-28 Sold (MLS) — HARMLS
- 2017-04-10 Pending — HARMLS
- 2017-04-09 Pending — HARMLS
- 2017-01-27 Price Changed $125,000 HARMLS
- 2016-11-29 Listed $87,000 HARMLS
- 2016-11-23 Sold (Public Records) — Public Records
- 1988-01-02 Sold (Public Records) — Public Records
Property tax history
+11.9%/yrLatest (2025): $4,375 · +11.7% YoY. Source: county tax records.
Cash-flow waterfall
monthlySold comps — $/sqft
last 12 mo · ≤1 miLoading sold comps…