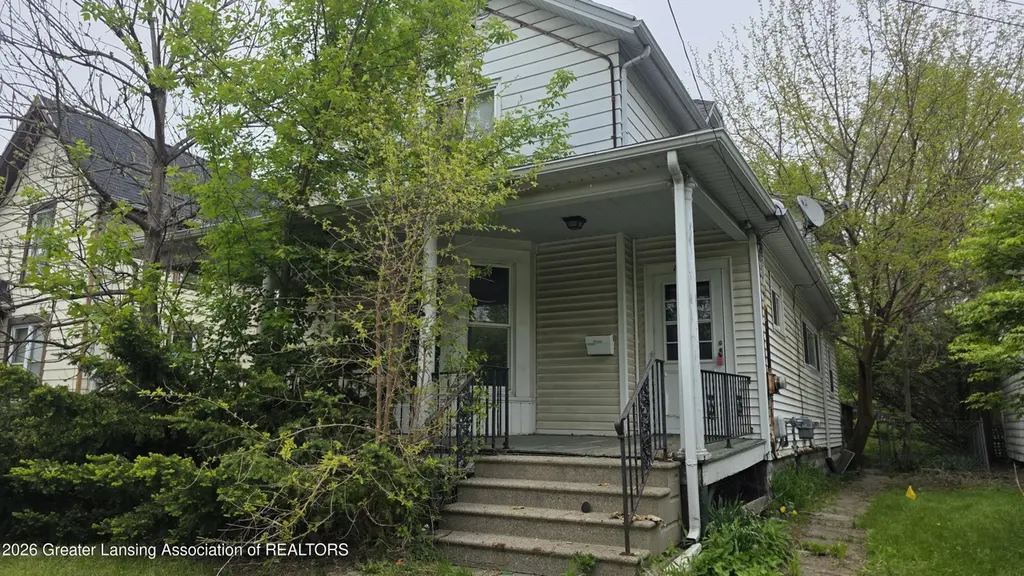
820 N Seymour Ave · Lansing, MI
Flood risk 1/10 · Minimal
- FEMA flood zone
- X (unshaded)
- Chance of flooding over 30 yrs
- 0.0%
- Est. flood insurance / yr
- $473 – $860
Fire risk 1/10 · Minimal
- Est. fire insurance / yr
- $784 – $1,456
Heat risk 3/10 · Minor
- Hot days now (above 97°F)
- 7 days/yr
- Hot days in 30 yrs
- 16 days/yr
Wind risk 2/10 · Minimal
- Chance of severe wind over 30 yrs
- —
Air-quality risk 2/10 · Minimal
- Unhealthy air days now
- 1 days/yr
- Unhealthy air days in 30 yrs
- 2 days/yr
Risk factors via First Street. Map © Google.
Why this score? — see what drove the B grade
The composite is a weighted blend of 9 inputs, each scored 0–100. Each bar is that input's sub-score; the figure is the points it added to the 100-point composite (weight × sub-score).
- Cash flow +30.0/30.0
- 1% rule +10.0/10.0
- DSCR +10.0/10.0
- ARV discount +7.5/15.0
- Rent growth +5.0/5.0
- Livability +4.0/5.0
- Condition / age +2.5/5.0
- Schools +1.9/10.0
- Appreciation +0.0/10.0
$74,900
🖨 Deal sheet (PDF) 📄 Offer letter ✓ Due diligence
Listing remarks MLS
Welcome to 820 N Seymour, Lansing Mi. This Huge home is a handi-man special and is ready for an investor or handy person to bring it back alive. The home belongs to the Advent house and currently has reduced taxes. This 4-5 bedroom house is massive and full of character. It has not been very well maintained for years and years. The roof is leaking and needs replaced, some plumbing is leaking and there is a wet basement. This home has a nice covered front porch that leads to a foyer with a closet and hooks. Into the living room, then family room and into the dining room. The dining room has built ins and in the kitchen. There is a door off the back to the big deck and the detached 2 car garage. The yard is partially fenced. The main floor has a bedroom and a full bath. The second floor has a second full bathroom and 4 more bedrooms. Home is vacant, and sold AS-IS/Where is. . Room sizes are estimates. Please use caution when in the house. Cash only offers.
Key facts
- Covered front porch
- Built ins
- Big deck
Tags
Property features AI
Finance
- Financial info: Current use suitable for rental, primary residence, or investment
- HOA & community: Curbs; Park; Sidewalks; Street lights
Exterior
- Parking: Detached garage; Driveway; Garage with 2 garage spaces
- Utilities: Public sewer
- Home design: Colonial-style; Two levels; Front door faces west; City street frontage; Built in 1880
- Construction: Aluminum siding; Vinyl siding; Block, brick/mortar, combination and stone foundation; Shingle roof
- Exterior features: Covered porch and front porch; Deck; Porch; Exterior lighting; Partial backyard fencing; Back yard; Front yard; City lot; Near public transit; Downtown and neighborhood views
Interior
- Kitchen: Laminate counters
- Bedrooms: Primary bedroom (10 x 11); Bedroom 2 (10 x 10); Bedroom 3 (11 x 11); Bedroom 4 (11 x 10)
- Flooring: Carpet; Combination; Hardwood; Laminate
- Bathrooms: 2 full bathrooms
- Heating & cooling: Forced air natural gas heating; No central cooling
- Interior features: Built-in features; Ceiling fan(s); Crown molding; Entrance foyer; Laminate counters; Natural woodwork
- Laundry & utility: Laundry in basement
Neighborhood map
What this means for you Summary
Snapshot
- This is a 4-bed/1.5-bath single-family listed at $75k.
Deal economics
- At list price, monthly cash flow is $738 ($9k/yr) — positive.
- The deal already cash-flows at list — no discount required.
- Meets the 1% rule at list price ($2k rent vs $75k).
- Cap rate 18.1% vs local median 6.0% in Lansing — top-decile yield for the area; either an underpriced asset or a hidden risk that comps aren't pricing in. Stress-test before assuming the spread holds.
Location & tenants
- Location reads 79/100 on livability (#94 in MI, #2,182 nationally) — a middle-class / working-renter tenant base. Strengths: amenities A+, commute A+, cost of living A+; Watch: employment D, schools F, crime F.
- Lansing Public School District (urban): math 14% / reading 23% proficiency, ranked #650 of 760 in MI (top 86%) — low school quality limits family demand, transient renter base, plan for 1-2y turnover; 68% free/reduced lunch — lower-income household profile, screen leases tightly.
- Market conditions: Rents rising fast (+10.5%/yr); 138 active listings in the ZIP; 9 comparable units currently listed for rent nearby; rentals lingering (median 44d on market — plan ~5-8 weeks vacancy on turnover, expect pricing pressure); 56% of comp listings sitting > 30 days — soft ceiling on asking rent; 350 units permitted in Ingham County in 2024 (186 in 5+ unit buildings).
Forward outlook
- Local home prices are declining (-3.0%/yr); year-one equity from $518 of loan paydown is wiped out by about $2k of value loss. Plan a longer hold.
- Ingham County population projected at +11% by 2050 — modest demand growth; plan on rents tracking national, not racing it.
- At projected returns (-3.0% appreciation + 8.0% rent growth), your $21k cash investment doubles in ~3 years — after that, you're playing with house money.
Negotiation context
- Only 9 days on market — expect competitive offers; lowballing is unlikely to land.
- 2 sale attempts; this cycle's ask has dropped $10k (12%) from the opening price — seller is motivated, your offer sets the floor, not the list.
Risks & watch-outs
- Watch-outs: built in 1880 — expect roof / HVAC / electrical / plumbing capex.
Questions for the listing agent
- Built in 1880 — when were the roof, HVAC, electrical panel, plumbing, and water heater last replaced?
- Is there a deadline driving the sale (1031 exchange, divorce, estate, relocation)? That informs how much negotiation room exists.
- Schools are F-rated, which usually means shorter tenancies and higher turnover. Who's the typical renter profile here, and what's been the actual vacancy rate?
- Crime grade is F in this area — have there been break-ins, vandalism, or insurance claims at this property in the last 3 years? What carrier currently insures it and at what premium?
- What's the average days-on-market for RENTAL listings here right now (not sales)? A rising rental-DOM trend means longer vacancies and softer asking-rent achievability than the comps imply.
- What's the recent tenant-quality profile in this submarket — average credit score on applications, eviction rate, late-payment / NSF rate, and stable-employment percentage? A property-management company in the area should have these aggregated.
- How much new for-sale + rental construction is in the pipeline within 1–3 miles? Heavy new supply typically softens prices + rents 12–24 months out; constrained supply supports both.
Investment metrics
- 1% rule
- 2.12% ✓
- Cap rate
- 18.12%
- Cash-on-cash
- 42.25%
- DSCR
- 2.88
- GRM
- 3.9
CMA / ARV
- ARV (on-the-fly)
- $173,700
- Comps found
- 12
Show comp detail 12 sales within ~0.75 mi
| Address | Dist | Beds/Ba | Sqft | Sold | Price | $/sf | Match |
|---|---|---|---|---|---|---|---|
| 514 W Genesee St | 0.35mi | 3/1.5 (-1) | 1,757 (+1%) | 1mo | $212,500 | $121 | 76 |
| 610 N Pine St | 0.30mi | 3/1.5 (-1) | 1,800 (+4%) | 8mo | $187,700 | $104 | 69 |
| 820 Princeton Ave | 0.53mi | 4/1.5 | 1,692 (-3%) | 4mo | $129,900 | $77 | 68 |
| 810 N Walnut St | 0.08mi | 3/2.0 (-1) | 1,570 (-10%) | 7mo | $156,500 | $100 | 68 |
| 423 N Pine St | 0.43mi | 3/2.0 (-1) | 1,767 (+2%) | 5mo | $215,000 | $122 | 66 |
| 506 W Oakland Ave | 0.20mi | 4/2.5 | 1,944 (+12%) | 7mo | $113,500 | $58 | 61 |
| 705 Princeton Ave | 0.57mi | 4/3.0 | 1,662 (-4%) | 4mo | $115,000 | $69 | 57 |
| 609 W Shiawassee St | 0.49mi | 5/2.0 (+1) | 1,830 (+5%) | 8mo | $85,000 | $46 | 55 |
| 418 N Sycamore St | 0.46mi | 3/2.0 (-1) | 1,880 (+8%) | 7mo | $220,000 | $117 | 52 |
| 738 W Lapeer St | 0.46mi | 3/1.5 (-1) | 1,479 (-15%) | 2mo | $158,000 | $107 | 47 |
| 430 Pearl St | 0.62mi | 3/2.5 (-1) | 1,608 (-7%) | 5mo | $90,000 | $56 | 45 |
| 805 Bancroft Ct | 0.51mi | 4/2.0 | 1,986 (+14%) | 7mo | $102,500 | $52 | 45 |
Match score weights: distance 35% · size 25% · config 20% · recency 20%. Top-matched comps best support the ARV.
Projected returns pro-forma
-3.0% appreciation · 8.0% rent growth · sell at horizon
- IRR
- 44.5%
- Equity multiple
- 3.07×
- Total profit
- $43,317
- Equity at exit
- $11,168
- IRR
- 52.7%
- Equity multiple
- 7.51×
- Total profit
- $136,616
- Equity at exit
- $6,476
Cash invested: $20,972 (down + closing). Projections, not guarantees.
Landlord ↔ Tenant lean methodology
- Overall (STATE)
- 62 Landlord-Friendly
- State Michigan
- 62 Landlord-Friendly · EVEN
- County
- — inherits STATE
- City
- — inherits STATE
ZIP-level market 48906
- Rents YoY
- 10.5%
- Active inventory
- 138
- Price-to-rent
- 3.9×
Monthly cashflow live
- Estimated rent
- $1,590 high interval (Pro) →
- Mortgage (P&I)
- −$393
- Tax est. 1.5%
- −$94 /mo · $1,124/yr
- Insurance
- −$31
- HOA
- −$0
- Vacancy / Maint / Mgmt
- −$334
- Net cashflow
- $738
Break-even live
Sensitivity live
| Price | -10% $790 | -5% $764 | +0% $738 | +5% $713 | +10% $687 |
|---|---|---|---|---|---|
| Rent | -10% $613 | -5% $676 | +0% $738 | +5% $801 | +10% $864 |
| Rate | -1.0pp $776 | -0.5pp $757 | base $738 | +0.5pp $719 | +1.0pp $699 |
UW: 25.0% down · 7.5% · 30yr · 1.5% tax · 5.0% vac · 8.0% maint · 8.0% mgmt
Financing live
Cash to close
- Down payment
- $18,725
- Closing costs
- $2,247
- Reserves months
- —
- Total cash needed
- —
Loan-product check · same deal, 3 products live
Conventional
25% down · 7.5% · 30yr
- Down + closing
- —
- Monthly P&I
- —
- Monthly cashflow
- —
- DSCR
- —
- Eligible?
- —
Personal DTI + credit; lowest rate.
DSCR
20% down · 8.5% · 30yr
- Down + closing
- —
- Monthly P&I
- —
- Monthly cashflow
- —
- DSCR
- —
- Eligible?
- —
No personal income docs; deal must DSCR.
Hard money
10% down · 12.0% · 12mo
- Down + closing
- —
- Monthly P&I
- —
- Monthly cashflow
- —
- DSCR
- —
- Eligible?
- —
Short-term bridge; refi at stabilization.
Rent comps 9 comps
| Address | Beds | Baths | Sqft | Rent | $/sqft | DOM | Units | Dist |
|---|---|---|---|---|---|---|---|---|
| 433 Seymour Ave Unit 3 Lansing, MI | 3.0 | 1.0 | 1250 | $1,395 | $1.12 | 44d | 1 | 0.32mi |
| 712 N Sycamore St Lansing, MI | 3.0 | 1.0 | 1100 | $1,650 | $1.50 | 21d | 1 | 0.35mi |
| 919 Princeton Ave Lansing, MI | 3.0 | 1.5 | 1119 | $1,475 | $1.32 | 21d | 1 | 0.57mi |
| 1012 Ontario St Lansing, MI | 4.0 | 2.0 | 1320 | $1,600 | $1.21 | 21d | 1 | 0.76mi |
| 921 Linden Grove Ave Lansing, MI | 3.0 | 1.0 | 1694 | $1,499 | $0.88 | 44d | 1 | 0.88mi |
| 401 S Washington Sq Unit 201 Lansing, MI | 3.0 | 1.0 | 1254 | $1,560 | $1.24 | 44d | 1 | 0.94mi |
| 605 S Grand Ave Unit 2 Lansing, MI | 4.0 | 1.0 | 1200 | $1,100 | $0.92 | 44d | 1 | 1.13mi |
| 1561 Massachusetts Ave Lansing, MI | 3.0 | 2.0 | 1100 | $1,400 | $1.27 | 44d | 1 | 1.13mi |
| 1102 Clark St Lansing, MI | 3.0 | 1.0 | 1232 | $1,550 | $1.26 | 21d | 1 | 1.19mi |
Listing history 8 events
-
2026-06-18days on market $74,900 Active 9 DOM
-
2026-06-17pricedays on market $74,900 Active 8 DOM
-
2026-06-16days on market $84,900 Active 7 DOM
-
2026-06-15days on market $84,900 Active 6 DOM
-
2026-06-14days on market $84,900 Active 4 DOM
-
2026-06-13days on market $84,900 Active 3 DOM
-
2026-06-10remarks 699-char remark
-
2026-06-10$84,900 Active 1 DOM
ⓘ Source: listings_history table (triggers on properties + properties_extension) + one-shot
backfill from property_details.listing_events for pre-trigger history.
Climate risk First Street
- Flood 1/10 Low FEMA zone X (unshaded) · 0% chance over 30 yrs
- Wildfire 1/10 Low
- Heat 3/10 Moderate 7 d/yr ≥97°F today · 16 d/yr by 30 yrs out
- Wind 2/10 Low
- Air quality 2/10 Low 1 unhealthy d/yr today · 2 by 30 yrs out
Nearby sold comps map
Loading sold comps map…
Walkable amenities ~0.75 mi
Loading nearby amenities…
Taxation est. · year 1
- Rental income
- $19,079
- − Mortgage interest
- −$4,196
- − Property taxes
- −$1,124
- − Insurance
- −$374
- − Repairs & maintenance
- −$1,526
- − Management
- −$1,526
- − Depreciation
- −$2,179
- Taxable income
- $8,154
- Est. tax owed @ 24.0%
- −$1,957
- After-tax cash flow
- $6,904/yr
For passive investors: Depreciation is non-cash, so a rental often shows a tax loss while cash-flowing — sheltering income. Rental losses are passive: they offset passive income freely, and up to $25,000/yr can offset ordinary (W-2) income if you actively participate and your MAGI is under $100k (phasing out to $0 by $150k); unused losses carry forward. On sale, claimed depreciation is recaptured at up to 25%, and gains may owe capital-gains tax (a 1031 exchange can defer both). Figures are a year-1 estimate at your 24.0% rate — not tax advice; consult a CPA.
Schools (NCES district)
- District
- Lansing Public School District
- NCES district ID
- 2621150
- Math proficiency
- 14% ▲ 1.00%
- Reading proficiency
- 23% ▲ 3.00%
- Median HH income
- $37,453
- Composite
- 18.76/100
- National rank
- #14002
- State rank
- #650 of 760 in MI
Livability — Lansing
- Score
- 79/100
- State rank
- #94
- US rank
- #2182
Category grades
Schools grade is shown separately in the Schools card above.
Census & demographics
- Census place
- Lansing, MI
- County
- Ingham County · 237,052 people
- City population
- 161,269
- Metro
- Lansing-East Lansing, MI
- Population (ZIP)
- 25,901
- Household income
- $64,315
- Rent vs Own
- Severe rent burden
- 851.0
Population outlook (Ingham County) Hauer SSP2
- Today (2025)
- 300,362 people
- By 2030
- 307,808 · +2.5%
- By 2040
- 320,492 · +6.7%
- By 2050
- 333,223 · +10.9%
- By 2075
- 373,693 · +24.4%
- By 2100
- 392,021 · +30.5%
Race, ethnicity, and origin ACS 2023
- Neighborhood character
- Diverse neighborhood (Simpson 0.56)
- Race & ethnicity
- White 64% Black 15% Two or more races 12% Hispanic / Latino 12% Asian 2%
- Hispanic origin (detail)
- Mexican 9%
- Common ancestry
- Romanian 3% Lithuanian 2% Iranian 2%
- Foreign-born
- 6% · Canada, China
- Languages at home
- 88% English-only · Spanish 5% Other Asian/Pacific 1% French/Haitian/Cajun 1%
Political lean MEDSL · Ingham
- 2024 margin
- Strong D (+29.7) · D 63.9% · R 34.2% · Other 2.0%
- 2008→2024 swing
- -3.6pp toward R · 2008: 33.3pp · 2024: 29.7pp
- All cycles
- 2024: D+29.7 2020: D+32.2 2016: D+27.6 2012: D+27.9 2008: D+33.3
Not yet ingested
- Civics
- —
Market trends
- HPI YoY
- ▼ -135.54%
- Current HPI
- 228.7023
- Rent YoY
- ▲ 10.50%
- Metro
- Lansing-East Lansing, MI
- State GDP YoY
- ▲ 1.37%
- F500 in state
- 28
Industry mix (Fortune 500 HQ in MI)
| Industry | F500 HQs | Revenue |
|---|---|---|
| Automotive Parts | 3 | $48B |
|
||
| Automotive | 2 | $372B |
|
||
| Chemicals | 1 | $45B |
|
||
| Automotive Retail | 1 | $29B |
|
||
| Healthcare / Medical Devices | 1 | $23B |
|
||
| Automotive Technology | 1 | $20B |
|
||
Price history
+0.0% since first listed2 events — show timeline
- 2026-06-09 Listed $84,900 REALCOMP
- 2026-06-09 Listed $84,900 Greater Lansing AoR
Property tax history
+0.0%/yrLatest (2016): $94 · -1.1% YoY. Source: county tax records.
Cash-flow waterfall
monthlySold comps — $/sqft
last 12 mo · ≤1 miLoading sold comps…