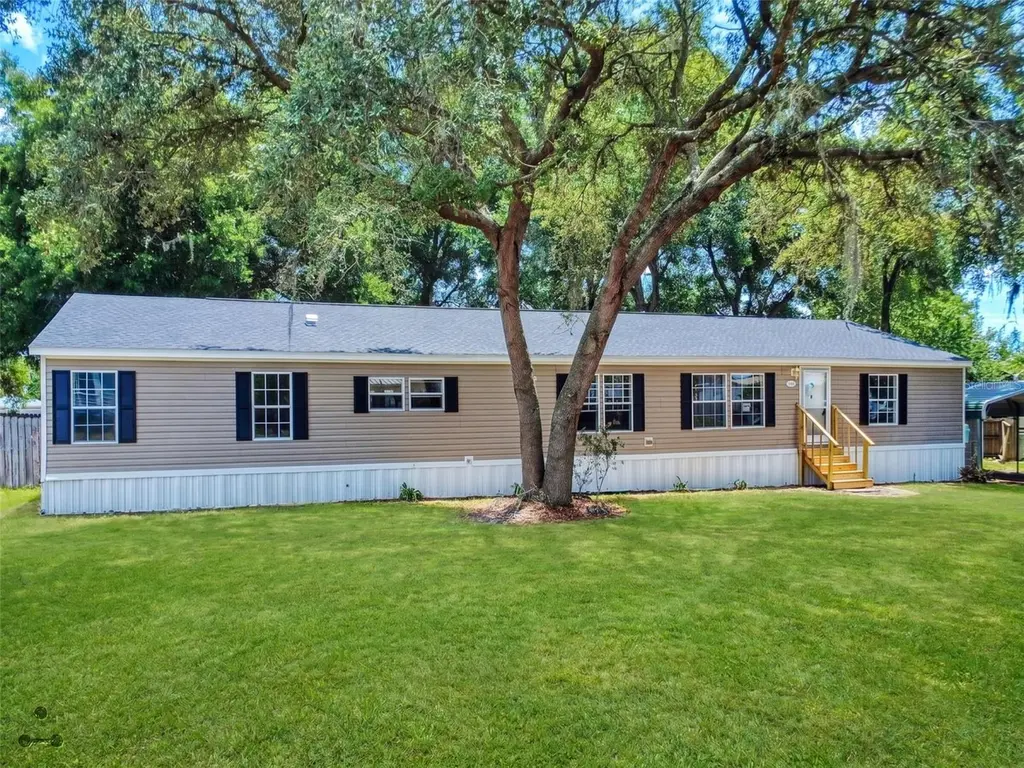
8685 SW 67th Ct · Liberty Triangle, FL
Flood risk 1/10 · Minimal
- FEMA flood zone
- X (unshaded)
- Chance of flooding over 30 yrs
- 0.0%
- Est. flood insurance / yr
- $507 – $1,088
Fire risk 3/10 · Minor
- Est. fire insurance / yr
- $947 – $1,759
Heat risk 8/10 · Major
- Hot days now (above 107°F)
- 7 days/yr
- Hot days in 30 yrs
- 22 days/yr
Wind risk 9/10 · Severe
- Chance of severe wind over 30 yrs
- 99.0%
Air-quality risk 2/10 · Minimal
- Unhealthy air days now
- 2 days/yr
- Unhealthy air days in 30 yrs
- 2 days/yr
Risk factors via First Street. Map © Google.
Why this score? — see what drove the D grade
The composite is a weighted blend of 9 inputs, each scored 0–100. Each bar is that input's sub-score; the figure is the points it added to the 100-point composite (weight × sub-score).
- Cash flow +19.2/30.0
- DSCR +6.1/10.0
- 1% rule +5.1/10.0
- Schools +3.6/10.0
- Livability +2.5/5.0
- Condition / age +2.5/5.0
- Rent growth +1.9/5.0
- ARV discount +0.0/15.0
- Appreciation +0.0/10.0
$233,000
🖨 Deal sheet 📄 Offer letter ✓ Due diligence
Listing remarks MLS
There is plenty of room to spread out inside and outside of this home. With four bedrooms, an office and a large back porch, you can spread out or entertain large groups! The kitchen includes a large island with room for seating and built in display cabinets with glass fronts. The master bedroom has new LVP flooring and features a huge en suite bathroom with dual sinks, separate tub and shower, a walk-in linen closet, toilet room and walk-in clothing closet. The three bedrooms are on the opposite side of the house and large combined living/dining room. In the winter, get cozy in front of the wood-burning fireplace in the family room, while enjoying the outside view through the french doors. Or sit outside by the fire pit roasting marshmallows. In the summers, use the large fans on the back deck to stay cool and enjoy the shade while you keep an eye on the fenced in backyard. There is a large storage shed adjacent to the carport for bikes, motorcycles, 4-wheelers or any other toys. There is no compromise necessary with this home - make your appointment to see it today! Room Feature: Linen Closet In Bath (Primary Bathroom).
Key facts
- Hvac
- New flooring
- Flexible layout
Tags
Property features AI
Finance
- Other: Lot approximately 0.3 acres (about 130 x 100); Zoned R4; Living area about 2,356 square feet; Total rooms: 7; Unfurnished; No home warranty; Directions available
- HOA & community: No association; Community street lights
Exterior
- Parking: Carport with 2 spaces
- Utilities: Public water; Public sewer; Electricity connected; Water connected; Cable available; Broadband/high-speed internet available; Underground utilities
- Home design: Residential manufactured double wide; Single-story; Faces southwest; Entry level: One
- Construction: Vinyl siding; Shingle roof; Pillar/post/pier foundation; Built as a manufactured home (double wide)
- Exterior features: Fire pit; Exterior lighting; Private mailbox; Asphalt road access; Street lights (community)
Interior
- Kitchen: Cooktop; Range; Dishwasher; Refrigerator; Ice maker; Exhaust fan; Electric water heater
- Bedrooms: 4 bedrooms
- Bathrooms: 2 full bathrooms
- Heating & cooling: Central heating (electric); Central air conditioning
- Interior features: Built-in features; Ceiling fans; Crown molding; Eat-in kitchen; Living room/dining room combo; Open floorplan; Thermostat; Walk-in closets; Electric fireplace
- Laundry & utility: Inside laundry room
Neighborhood map
What this means for you Summary
Snapshot
- This is a 4-bed/2.0-bath manufactured listed at $233k.
Deal economics
- At list price, monthly cash flow is $251 ($3k/yr) — positive.
- The deal already cash-flows at list — no discount required.
- Meets the 1% rule at list price ($2k rent vs $233k).
- Cap rate 7.6% vs local median 4.5% in Liberty Triangle — top-decile yield for the area; either an underpriced asset or a hidden risk that comps aren't pricing in. Stress-test before assuming the spread holds.
Location & tenants
- Location reads: area grade D — affects rentability + tenant quality, not the cash-flow math above.
- Marion (rural): math 42% / reading 43% proficiency, ranked #61 of 73 in FL (top 84%) — families likely to look elsewhere, expect single-tenant / working-renter base with shorter leases; 61% free/reduced lunch — lower-income household profile, screen leases tightly.
- Market conditions: Rents soft (-2.6%/yr); 852 active listings in the ZIP; 11 comparable units currently listed for rent nearby; rentals leasing fast (median 14d on market — plan ~1-2 weeks tenant-placement turnaround); 7,071 units permitted in Marion County in 2024 (534 in 5+ unit buildings).
- This rent runs 43% of the median local income ($66k/yr) — at the standard rent-burdened threshold; future hikes will face affordability resistance.
Forward outlook
- Local home prices are declining (-3.0%/yr); year-one equity from $2k of loan paydown is wiped out by about $7k of value loss. Plan a longer hold.
- Marion County population projected at +13% by 2050 — modest demand growth; plan on rents tracking national, not racing it.
Negotiation context
- Only 7 days on market — expect competitive offers; lowballing is unlikely to land.
- 6 sale attempts since 9y ago with the ask held roughly flat each time — persistent listings suggest the price (not the market) is what's stuck; bring a comps-based counter.
- Current owner paid $200k; 17% above their basis — modest negotiation headroom, anchor on the comps not their cost.
Risks & watch-outs
- Climate carrying-cost: severe wind risk, 99% chance of damaging wind over 30y; extreme-heat days projected 7→22/yr by 2055 (HVAC capex compounding) — expect insurance premiums to compound above CPI over the hold.
Questions for the listing agent
- Is there a deadline driving the sale (1031 exchange, divorce, estate, relocation)? That informs how much negotiation room exists.
- The area grade is low — what's the realistic commute time and amenity access for the typical tenant pool here? Any planned neighborhood developments (good or bad) we should know about?
- What's the average days-on-market for RENTAL listings here right now (not sales)? A rising rental-DOM trend means longer vacancies and softer asking-rent achievability than the comps imply.
- What's the recent tenant-quality profile in this submarket — average credit score on applications, eviction rate, late-payment / NSF rate, and stable-employment percentage? A property-management company in the area should have these aggregated.
- How much new for-sale + rental construction is in the pipeline within 1–3 miles? Heavy new supply typically softens prices + rents 12–24 months out; constrained supply supports both.
Investment metrics
- 1% rule
- 1.01% ✓
- Cap rate
- 7.59%
- Cash-on-cash
- 4.62%
- DSCR
- 1.21
- GRM
- 8.3
CMA / ARV
- ARV (on-the-fly)
- $186,124
- Comps found
- 1
Show comp detail 1 sale within ~0.75 mi
| Address | Dist | Beds/Ba | Sqft | Sold | Price | $/sf | Match |
|---|---|---|---|---|---|---|---|
| 6533 SW 87TH PLACE RD SW 87th Place Rd | 0.20mi | 4/2.0 | 2,280 (-3%) | 12mo | $180,000 | $79 | 76 |
Match score weights: distance 35% · size 25% · config 20% · recency 20%. Top-matched comps best support the ARV.
Projected returns pro-forma
-3.0% appreciation · 0.0% rent growth · sell at horizon
- IRR
- -12.5%
- Equity multiple
- 0.56×
- Total profit
- $-28,578
- Equity at exit
- $34,741
- IRR
- -8.7%
- Equity multiple
- 0.53×
- Total profit
- $-30,678
- Equity at exit
- $20,146
Cash invested: $65,240 (down + closing). Projections, not guarantees.
Landlord ↔ Tenant lean methodology
- Overall (STATE)
- 87 Strongly Landlord-Friendly
- State Florida
- 87 Strongly Landlord-Friendly · R+3
- County
- — inherits STATE
- City
- — inherits STATE
ZIP-level market 34476
- Rents YoY
- -2.6%
- Active inventory
- 852
- Price-to-rent
- 8.3×
Monthly cashflow live
- Estimated rent
- $2,343 high interval (Pro) →
- Mortgage (P&I)
- −$1,222
- Tax from tax record
- −$280 /mo · $3,362/yr
- Insurance
- −$97
- HOA
- −$0
- Vacancy / Maint / Mgmt
- −$492
- Net cashflow
- $251
Break-even live
UW: 25.0% down · 7.5% · 30yr · 1.5% tax · 5.0% vac · 8.0% maint · 8.0% mgmt
Financing live
Cash to close
- Down payment
- $58,250
- Closing costs
- $6,990
- Reserves months
- —
- Total cash needed
- —
Loan-product check · same deal, 3 products live
Conventional
25% down · 7.5% · 30yr
- Down + closing
- —
- Monthly P&I
- —
- Monthly cashflow
- —
- DSCR
- —
- Eligible?
- —
Personal DTI + credit; lowest rate.
DSCR
20% down · 8.5% · 30yr
- Down + closing
- —
- Monthly P&I
- —
- Monthly cashflow
- —
- DSCR
- —
- Eligible?
- —
No personal income docs; deal must DSCR.
Hard money
10% down · 12.0% · 12mo
- Down + closing
- —
- Monthly P&I
- —
- Monthly cashflow
- —
- DSCR
- —
- Eligible?
- —
Short-term bridge; refi at stabilization.
Rent comps 11 comps
| Address | Beds | Baths | Sqft | Rent | $/sqft | DOM | Units | Dist |
|---|---|---|---|---|---|---|---|---|
| 6615 SW 89th Ln Ocala, FL | 4.0 | 3.0 | 1958 | $2,195 | $1.12 | 13d | 1 | 0.31mi |
| 8710 SW 71st Ave Ocala, FL | 1.0–3.0 | 1.0–2.5 | 1312 | $2,270 | $1.73 | 13d | 27 | 0.44mi |
| 9198 SW 62nd Terrace Rd Ocala, FL | 3.0 | 2.0 | 1710 | $1,850 | $1.08 | 13d | 1 | 0.73mi |
| 13110 SW 89th St Ocala, FL | 4.0 | 2.5 | 1824 | $1,950 | $1.07 | 21d | 1 | 0.77mi |
| 9324 SW 58th Cir Ocala, FL | 3.0 | 2.0 | 2141 | $2,500 | $1.17 | 21d | 1 | 1.06mi |
| 5667 SW 92nd Pl Ocala, FL | 4.0 | 2.0 | 2283 | $2,750 | $1.20 | 13d | 1 | 1.13mi |
| 5637 SW 93rd St Ocala, FL | 4.0 | 3.0 | 2039 | $2,600 | $1.28 | 13d | 1 | 1.19mi |
| 7070 SW 65th Ave Ocala, FL | 3.0 | 2.0 | 1940 | $2,500 | $1.29 | 21d | 1 | 1.23mi |
| 7051 SW 64th Ter Ocala, FL | 3.0 | 2.0 | 1755 | $1,775 | $1.01 | 13d | 1 | 1.38mi |
| 7928 SW 80th Place Rd Ocala, FL | 3.0 | 2.0 | 1576 | $1,900 | $1.21 | 21d | 1 | 1.39mi |
| 8780 SW 49th Cir Ocala, FL | 3.0 | 2.0 | 1672 | $1,900 | $1.14 | 21d | 1 | 1.47mi |
Listing history 7 events
-
2026-06-15pricestatus $233,000 Pending 7 DOM
-
2026-06-15days on market $228,900 Active 7 DOM
-
2026-06-14days on market $228,900 Active 5 DOM
-
2026-06-13days on market $228,900 Active 4 DOM
-
2026-06-10days on market $228,900 Active 2 DOM
-
2026-06-09remarks 675-char remark
-
2026-06-09$228,900 Active 1 DOM
ⓘ Source: listings_history table (triggers on properties + properties_extension) + one-shot
backfill from property_details.listing_events for pre-trigger history.
Tax reassessment forecast FL · Resets to sale price
- Current annual tax
- $3,362 · $280/mo
- Projected year-2 tax
- $3,362 · $280/mo
- Expected delta
- $0/yr ($0/mo · 0.0%)
ⓘ Screening estimate from a state-policy table — verify with the county assessor before closing.
Climate risk First Street
- Flood 1/10 Low FEMA zone X (unshaded) · 0% chance over 30 yrs
- Wildfire 3/10 Moderate
- Heat 8/10 Severe 7 d/yr ≥107°F today · 22 d/yr by 30 yrs out
- Wind 9/10 Extreme 99% chance of damaging wind over 30 yrs
- Air quality 2/10 Low 2 unhealthy d/yr today · 2 by 30 yrs out
Nearby sold comps map
Loading sold comps map…
Walkable amenities ~0.75 mi
Loading nearby amenities…
Taxation est. · year 1
- Rental income
- $28,110
- − Mortgage interest
- −$13,052
- − Property taxes
- −$3,362
- − Insurance
- −$1,165
- − Repairs & maintenance
- −$2,249
- − Management
- −$2,249
- − Depreciation
- −$6,778
- Taxable loss
- −$744
- Est. tax savings @ 24.0%
- +$179
- After-tax cash flow
- $3,196/yr
For passive investors: Depreciation is non-cash, so a rental often shows a tax loss while cash-flowing — sheltering income. Rental losses are passive: they offset passive income freely, and up to $25,000/yr can offset ordinary (W-2) income if you actively participate and your MAGI is under $100k (phasing out to $0 by $150k); unused losses carry forward. On sale, claimed depreciation is recaptured at up to 25%, and gains may owe capital-gains tax (a 1031 exchange can defer both). Figures are a year-1 estimate at your 24.0% rate — not tax advice; consult a CPA.
Schools (NCES district)
- District
- Marion
- NCES district ID
- 1201260
- Math proficiency
- 42% ▼ -7.00%
- Reading proficiency
- 43% ▼ -4.00%
- Median HH income
- $40,015
- Composite
- 35.61/100
- National rank
- #4890
- State rank
- #61 of 73 in FL
Livability — Liberty Triangle
No livability data for this city. (Only ~50 U.S. cities are tracked.)
Census & demographics
- Census place
- Liberty Triangle, FL
- County
- Marion County · 315,796 people
- City population
- 26,397
- Metro
- Ocala, FL
- Population (ZIP)
- 28,997
- Household income
- $65,860
- Rent vs Own
- Severe rent burden
- 204.0
Population outlook (Marion County) Hauer SSP2
- Today (2025)
- 365,905 people
- By 2030
- 376,768 · +3.0%
- By 2040
- 396,555 · +8.4%
- By 2050
- 412,723 · +12.8%
- By 2075
- 446,090 · +21.9%
- By 2100
- 436,193 · +19.2%
Race, ethnicity, and origin ACS 2023
- Neighborhood character
- Diverse neighborhood (Simpson 0.55)
- Race & ethnicity
- White 63% Hispanic / Latino 18% Black 13% Two or more races 10% Asian 1%
- Hispanic origin (detail)
- Mexican 3% Puerto Rican 8% Cuban 3%
- Common ancestry
- Romanian 3% Slovak 3% Lithuanian 3%
- Foreign-born
- 15% · Canada, Jamaica, Dominican Republic
- Languages at home
- 83% English-only · Spanish 14% Other Indo-European 1% German/W. Germanic 1%
Political lean MEDSL · Marion
- 2024 margin
- Solid R (+31.6) · D 33.8% · R 65.5%
- 2008→2024 swing
- -20.0pp toward R · 2008: -11.6pp · 2024: -31.6pp
- All cycles
- 2024: R+31.6 2020: R+25.9 2016: R+26.2 2012: R+16.2 2008: R+11.6
Not yet ingested
- Civics
- —
Market trends
- HPI YoY
- ▼ -105.22%
- Current HPI
- 189.0869
- Rent YoY
- ▼ -2.57%
- Metro
- Ocala, FL
- State GDP YoY
- ▲ 3.28%
- F500 in state
- 36
Industry mix (Fortune 500 HQ in FL)
| Industry | F500 HQs | Revenue |
|---|---|---|
| Industrial Technology | 2 | $29B |
|
||
| Insurance | 2 | $17B |
|
||
| Retail | 1 | $60B |
|
||
| Technology Distribution | 1 | $58B |
|
||
| Homebuilding | 1 | $35B |
|
||
| Technology Manufacturing | 1 | $35B |
|
||
Price history
+990.0% since first listed19 events — show timeline
- 2026-06-08 Listed $228,900 Stellar MLS as Distributed by MLS Grid
- 2025-06-19 Pending — Stellar MLS as Distributed by MLS Grid
- 2025-06-18 Listing Removed — Stellar MLS as Distributed by MLS Grid
- 2025-05-19 Price Changed $175,000 Stellar MLS as Distributed by MLS Grid
- 2025-04-14 Price Changed $190,000 Stellar MLS as Distributed by MLS Grid
- 2024-11-27 Price Changed $215,000 Stellar MLS as Distributed by MLS Grid
- 2024-10-31 Listed $220,000 Stellar MLS as Distributed by MLS Grid
- 2022-02-07 Sold (Public Records) $199,900 Public Records
- 2022-01-28 Sold (MLS) $199,900 Stellar MLS as Distributed by MLS Grid
- 2021-12-18 Pending — Stellar MLS as Distributed by MLS Grid
- 2021-12-13 Relisted — Stellar MLS as Distributed by MLS Grid
- 2021-11-24 Pending — Stellar MLS as Distributed by MLS Grid
- 2021-11-22 Listed $199,900 Stellar MLS as Distributed by MLS Grid
- 2017-09-07 Sold (Public Records) $122,000 Public Records
- 2017-08-30 Sold (MLS) $122,000 Stellar MLS as Distributed by MLS Grid
- 2017-04-15 Listed $129,900 Stellar MLS as Distributed by MLS Grid
- 2017-04-12 Listing Removed — Stellar MLS as Distributed by MLS Grid
- 2017-03-01 Listed $129,900 Stellar MLS as Distributed by MLS Grid
- 2007-12-03 Sold (Public Records) $21,000 Public Records
Property tax history
+14.0%/yrLatest (2025): $3,362 · +1.0% YoY. Source: county tax records.
Cash-flow waterfall
monthlySold comps — $/sqft
last 12 mo · ≤1 miLoading sold comps…