 Multi-family
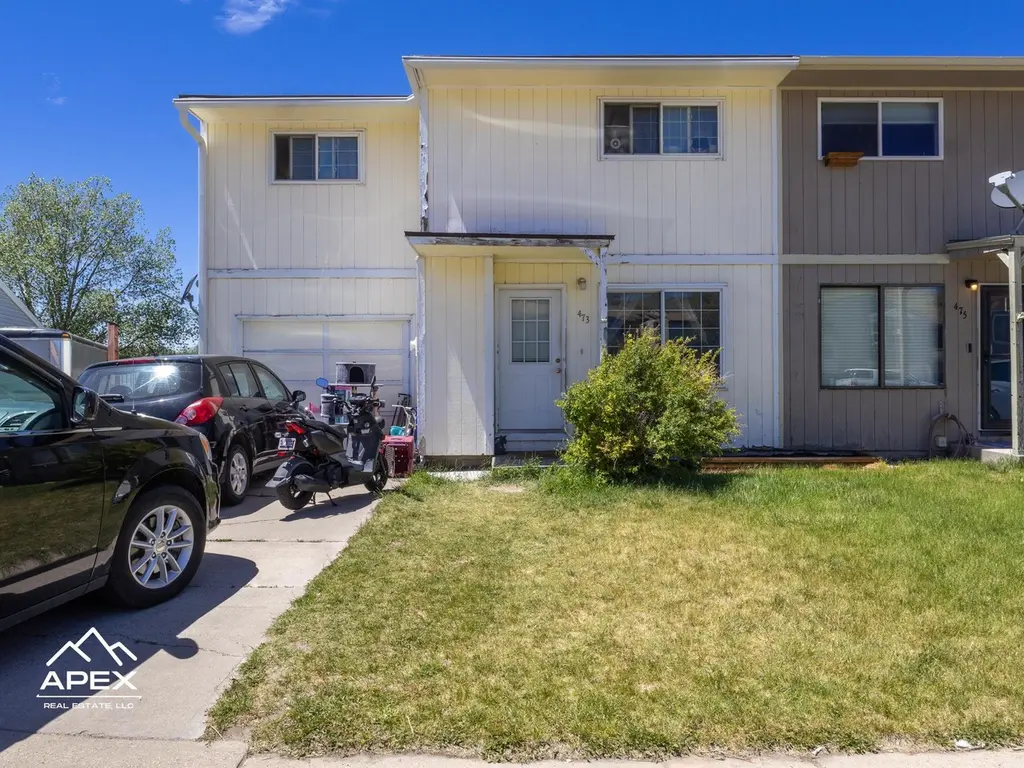
473 Miller Ave · Evanston, WY
Flood risk 1/10 · Minimal
- FEMA flood zone
- X (unshaded)
- Chance of flooding over 30 yrs
- 0.0%
- Est. flood insurance / yr
- $473 – $860
Fire risk 6/10 · Moderate
- Est. fire insurance / yr
- $564 – $1,046
Heat risk 1/10 · Minimal
- Hot days now (above 85°F)
- 7 days/yr
- Hot days in 30 yrs
- 17 days/yr
Wind risk 1/10 · Minimal
- Chance of severe wind over 30 yrs
- —
Air-quality risk 1/10 · Minimal
- Unhealthy air days now
- 0 days/yr
- Unhealthy air days in 30 yrs
- 0 days/yr
Risk factors via First Street. Map © Google.
Why this score? — see what drove the D+ grade
The composite is a weighted blend of 9 inputs, each scored 0–100. Each bar is that input's sub-score; the figure is the points it added to the 100-point composite (weight × sub-score).
- Cash flow +12.9/30.0
- Appreciation +10.0/10.0
- ARV discount +7.5/15.0
- Schools +4.8/10.0
- DSCR +3.9/10.0
- Livability +3.1/5.0
- 1% rule +2.5/10.0
- Rent growth +2.5/5.0
- Condition / age +2.5/5.0
$189,000
🖨 Deal sheet 📄 Offer letter ✓ Due diligence
Multi-family units
County records classify this as Multi-Family (2-4 Unit). Listing-text estimate: 1 unit. estimate disagrees with records
Key facts
- Spacious backyard
- Newer roof
- Second living area
Tags
Property features AI
Exterior
- Parking: Attached garage with 1 garage space
- Utilities: Public water; Public sewer; Natural gas available
- Home design: Single-family residence; Residential property
- Construction: Wood siding construction; Asphalt roof
- Exterior features: Deck; Wood fence
Interior
- Kitchen: Dishwasher; Refrigerator; Range; Oven
- Flooring: Carpet; Laminate
- Heating & cooling: Forced air heating
- Interior features: Dishwasher; Refrigerator; Range; Oven
- Laundry & utility: Laundry located in the basement; Full basement
Neighborhood map
What this means for you Summary
Snapshot
- This is a 3-bed/2.0-bath multifamily listed at $189k.
Deal economics
- At list price, monthly cash flow is $-14 ($-165/yr) — negative.
- To cash-flow at today's rent, offer at most $187k (1.3% below list).
- To meet the 1% rule (rent ≥ 1% of price), the offer needs to be $142k (24.9% below list).
- Recommended offer: $142k (24.9% below list) — sets the bar for 1% rule.
- Cap rate 6.2% vs local median 3.0% in Evanston — top-decile yield for the area; either an underpriced asset or a hidden risk that comps aren't pricing in. Stress-test before assuming the spread holds.
Location & tenants
- Location reads 61/100 on livability (#112 in WY) — a middle-class / working-renter tenant base. Strengths: cost of living A+, housing A+; Watch: crime C-, amenities F, commute F.
- Uinta County School District #1 (town): math 54% / reading 57% proficiency, ranked #17 of 41 in WY (top 42%) — acceptable for families but not a draw, mixed tenant base, ~2y average lease.
- Market conditions: 114 active listings in the ZIP; 50 units permitted in Uinta County in 2024 (0 in 5+ unit buildings).
Forward outlook
- In year one you build about $20k of equity ($1k loan paydown + $19k appreciation (10.0% local appreciation)).
- Uinta County population projected at -21% by 2050 — secular population decline; favor cash flow + early exit over multi-decade hold.
- At projected returns (10.0% appreciation + 3.0% rent growth), your $53k cash investment doubles in ~3 years — after that, you're playing with house money.
- By year 2, paydown + projected appreciation supports a ~$32k cash-out refi (75% LTV) — recoverable capital for the next deal without selling this one.
Negotiation context
- Only 7 days on market — expect competitive offers; lowballing is unlikely to land.
Risks & watch-outs
- Climate carrying-cost: major wildfire risk — expect insurance premiums to compound above CPI over the hold.
Questions for the listing agent
- What do current leases actually rent for vs. the listed asking? Can we see a recent rent roll and the last 12 months of T-12 income?
- Is there a deadline driving the sale (1031 exchange, divorce, estate, relocation)? That informs how much negotiation room exists.
- The area grade is low — what's the realistic commute time and amenity access for the typical tenant pool here? Any planned neighborhood developments (good or bad) we should know about?
- What's the average days-on-market for RENTAL listings here right now (not sales)? A rising rental-DOM trend means longer vacancies and softer asking-rent achievability than the comps imply.
- What's the recent tenant-quality profile in this submarket — average credit score on applications, eviction rate, late-payment / NSF rate, and stable-employment percentage? A property-management company in the area should have these aggregated.
- How much new apartment / multifamily construction is in the pipeline within 1–3 miles? Heavy new supply (>2% of stock underway) typically softens rents 12–24 months out; light construction supports rent growth.
Investment metrics
- 1% rule
- 0.75% ✗
- Cap rate
- 6.21%
- Cash-on-cash
- -0.31%
- DSCR
- 0.99
- GRM
- 11.1
CMA / ARV
No comps found within radius.
Projected returns pro-forma
10.0% appreciation · 3.0% rent growth · sell at horizon
- IRR
- 24.0%
- Equity multiple
- 2.93×
- Total profit
- $101,973
- Equity at exit
- $170,266
- IRR
- 21.3%
- Equity multiple
- 6.68×
- Total profit
- $300,816
- Equity at exit
- $367,185
Cash invested: $52,920 (down + closing). Projections, not guarantees.
Landlord ↔ Tenant lean methodology
- Overall (STATE)
- 90 Strongly Landlord-Friendly
- State Wyoming
- 90 Strongly Landlord-Friendly · R+25
- County
- — inherits STATE
- City
- — inherits STATE
ZIP-level market 82930
- Home prices YoY
- 4.4%
- Active inventory
- 114
- Price-to-rent
- 11.1×
Monthly cashflow live
- Estimated rent
- $1,419 medium interval (Pro) →
- Mortgage (P&I)
- −$991
- Tax from tax record
- −$65 /mo · $777/yr
- Insurance
- −$79
- HOA
- −$0
- Vacancy / Maint / Mgmt
- −$298
- Net cashflow
- $-14
Break-even live
UW: 25.0% down · 7.5% · 30yr · 1.5% tax · 5.0% vac · 8.0% maint · 8.0% mgmt
Financing live
Cash to close
- Down payment
- $47,250
- Closing costs
- $5,670
- Reserves months
- —
- Total cash needed
- —
Loan-product check · same deal, 3 products live
Conventional
25% down · 7.5% · 30yr
- Down + closing
- —
- Monthly P&I
- —
- Monthly cashflow
- —
- DSCR
- —
- Eligible?
- —
Personal DTI + credit; lowest rate.
DSCR
20% down · 8.5% · 30yr
- Down + closing
- —
- Monthly P&I
- —
- Monthly cashflow
- —
- DSCR
- —
- Eligible?
- —
No personal income docs; deal must DSCR.
Hard money
10% down · 12.0% · 12mo
- Down + closing
- —
- Monthly P&I
- —
- Monthly cashflow
- —
- DSCR
- —
- Eligible?
- —
Short-term bridge; refi at stabilization.
Listing history 7 events
-
2026-06-18days on market $189,000 Active 7 DOM
-
2026-06-17days on market $189,000 Active 6 DOM
-
2026-06-16days on market $189,000 Active 5 DOM
-
2026-06-15days on market $189,000 Active 4 DOM
-
2026-06-15days on market $189,000 Active 3 DOM
-
2026-06-13days on market $189,000 Active 2 DOM
-
2026-06-12$189,000 Active 1 DOM
ⓘ Source: listings_history table (triggers on properties + properties_extension) + one-shot
backfill from property_details.listing_events for pre-trigger history.
Tax reassessment forecast WY · Resets to sale price
- Current annual tax
- $777 · $65/mo
- Projected year-2 tax
- $1,153 · $96/mo
- Expected delta
- +$376/yr (+$31/mo · 48.4%)
ⓘ Screening estimate from a state-policy table — verify with the county assessor before closing.
Climate risk First Street
- Flood 1/10 Low FEMA zone X (unshaded) · 0% chance over 30 yrs
- Wildfire 6/10 Major
- Heat 1/10 Low 7 d/yr ≥85°F today · 17 d/yr by 30 yrs out
- Wind 1/10 Low
- Air quality 1/10 Low 0 unhealthy d/yr today · 0 by 30 yrs out
Nearby sold comps map
Loading sold comps map…
Walkable amenities ~0.75 mi
Loading nearby amenities…
Taxation est. · year 1
- Rental income
- $17,026
- − Mortgage interest
- −$10,587
- − Property taxes
- −$777
- − Insurance
- −$945
- − Repairs & maintenance
- −$1,362
- − Management
- −$1,362
- − Depreciation
- −$5,498
- Taxable loss
- −$3,506
- Est. tax savings @ 24.0%
- +$841
- After-tax cash flow
- $676/yr
For passive investors: Depreciation is non-cash, so a rental often shows a tax loss while cash-flowing — sheltering income. Rental losses are passive: they offset passive income freely, and up to $25,000/yr can offset ordinary (W-2) income if you actively participate and your MAGI is under $100k (phasing out to $0 by $150k); unused losses carry forward. On sale, claimed depreciation is recaptured at up to 25%, and gains may owe capital-gains tax (a 1031 exchange can defer both). Figures are a year-1 estimate at your 24.0% rate — not tax advice; consult a CPA.
Schools (NCES district)
- District
- Uinta County School District #1
- NCES district ID
- 5602760
- Math proficiency
- 54% ▼ -1.00%
- Reading proficiency
- 57% ▲ 2.00%
- Median HH income
- $53,206
- Composite
- 47.65/100
- National rank
- #2247
- State rank
- #17 of 41 in WY
Livability — Evanston
- Score
- 61/100
- State rank
- #112
- US rank
- #17873
Category grades
Schools grade is shown separately in the Schools card above.
Census & demographics
- Census place
- Evanston, WY
- Population (ZIP)
- 14,836
Population outlook (Uinta County) Hauer SSP2
- Today (2025)
- 19,871 people
- By 2030
- 19,106 · -3.8%
- By 2040
- 17,394 · -12.5%
- By 2050
- 15,715 · -20.9%
- By 2075
- 12,193 · -38.6%
- By 2100
- 9,429 · -52.5%
Race, ethnicity, and origin ACS 2023
- Neighborhood character
- Predominantly White (86%)
- Race & ethnicity
- White 86% Hispanic / Latino 11% Two or more races 6%
- Hispanic origin (detail)
- Mexican 7%
- Common ancestry
- Slovak 8% Italian 4% Scottish 3%
- Foreign-born
- 2% · Canada
- Languages at home
- 95% English-only · Spanish 5%
Political lean MEDSL · Uinta
- 2024 margin
- Solid R (+63.7) · D 17.4% · R 81.1% · Other 1.6%
- 2008→2024 swing
- -22.6pp toward R · 2008: -41.1pp · 2024: -63.7pp
- All cycles
- 2024: R+63.7 2020: R+62.8 2016: R+61.5 2012: R+59.0 2008: R+41.1
Not yet ingested
- Civics
- —
Market trends
- HPI YoY
- ▲ 16.96%
- Current HPI
- 401.04
- Rent YoY
- —
- Metro
- —
- State GDP YoY
- —
- F500 in state
- 0
Price history
2 events — show timeline
- 2026-06-11 Listed $189,000 WMLS
- 1998-06-25 Sold (Public Records) — Public Records
Property tax history
+3.0%/yrLatest (2025): $777 · -22.5% YoY. Source: county tax records.
Cash-flow waterfall
monthlySold comps — $/sqft
last 12 mo · ≤1 miLoading sold comps…