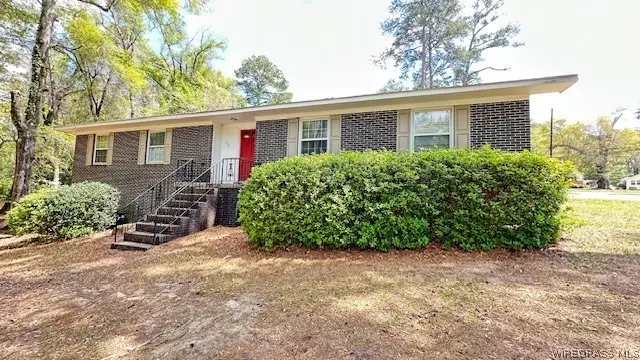
114 Dogwood Cir · Ozark, AL
Flood risk 1/10 · Minimal
- FEMA flood zone
- X (unshaded)
- Chance of flooding over 30 yrs
- 0.0%
- Est. flood insurance / yr
- $473 – $860
Fire risk 3/10 · Minor
- Est. fire insurance / yr
- $916 – $1,700
Heat risk 7/10 · Major
- Hot days now (above 107°F)
- 7 days/yr
- Hot days in 30 yrs
- 19 days/yr
Wind risk 8/10 · Major
- Chance of severe wind over 30 yrs
- 99.0%
Air-quality risk 2/10 · Minimal
- Unhealthy air days now
- 1 days/yr
- Unhealthy air days in 30 yrs
- 1 days/yr
Risk factors via First Street. Map © Google.
Why this score? — see what drove the B- grade
The composite is a weighted blend of 9 inputs, each scored 0–100. Each bar is that input's sub-score; the figure is the points it added to the 100-point composite (weight × sub-score).
- Cash flow +30.0/30.0
- DSCR +10.0/10.0
- 1% rule +8.2/10.0
- ARV discount +7.5/15.0
- Livability +3.1/5.0
- Rent growth +2.5/5.0
- Condition / age +2.5/5.0
- Schools +2.0/10.0
- Appreciation +0.0/10.0
$94,500
🖨 Deal sheet 📄 Offer letter ✓ Due diligence
Listing remarks
This brick ranch features two living areas, kitchen, 3 bedrooms, 2.5 baths, a huge covered back patio and big attached carport with side entry. This ranch sits on a corner lot, in a well established neighborhood, very close to down town Ozark. Location has easy access to services, schools and shopping areas. This is a VA Foreclosure to be sold as is. Home built prior to 1978, lead paint potentially exist. Alabama Right of Redemption may affect this asset. This property may qualify for seller financing (Vendee). Seller does not guarantee or warrant title to the property.
Key facts
- Covered back patio
- Corner lot
- 2 parking spots
Tags
Neighborhood map
What this means for you Summary
Snapshot
- This is a 3-bed/1.0-bath single-family listed at $94k.
Deal economics
- At list price, monthly cash flow is $384 ($5k/yr) — positive.
- The deal already cash-flows at list — no discount required.
- Meets the 1% rule at list price ($1k rent vs $94k).
- Cap rate 11.2% vs local median 4.3% in Ozark — top-decile yield for the area; either an underpriced asset or a hidden risk that comps aren't pricing in. Stress-test before assuming the spread holds.
Location & tenants
- Location reads 62/100 on livability (#224 in AL) — a middle-class / working-renter tenant base. Strengths: cost of living A+, housing A+, health & safety A+; Watch: schools F, crime F, amenities F.
- Ozark City (town): math 11% / reading 36% proficiency, ranked #99 of 129 in AL (top 77%) — low school quality limits family demand, transient renter base, plan for 1-2y turnover.
- Market conditions: 184 active listings in the ZIP; 3 comparable units currently listed for rent nearby; rentals lingering (median 44d on market — plan ~5-8 weeks vacancy on turnover, expect pricing pressure); 100% of comp listings sitting > 30 days — soft ceiling on asking rent; 38 units permitted in Dale County in 2024 (0 in 5+ unit buildings).
Forward outlook
- Local home prices are declining (-3.0%/yr); year-one equity from $653 of loan paydown is wiped out by about $3k of value loss. Plan a longer hold.
- Dale County population projected at -20% by 2050 — secular population decline; favor cash flow + early exit over multi-decade hold.
- At projected returns (-3.0% appreciation + 3.0% rent growth), your $26k cash investment doubles in ~7 years — after that, you're playing with house money.
Negotiation context
- Only 12 days on market — expect competitive offers; lowballing is unlikely to land.
- 11 sale attempts since 19y ago with the ask held roughly flat each time — persistent listings suggest the price (not the market) is what's stuck; bring a comps-based counter.
Risks & watch-outs
- Climate carrying-cost: severe wind risk, 99% chance of damaging wind over 30y; extreme-heat days projected 7→19/yr by 2055 (HVAC capex compounding) — expect insurance premiums to compound above CPI over the hold.
Questions for the listing agent
- Built in 1966 — when were the roof, HVAC, electrical panel, plumbing, and water heater last replaced?
- Is there a deadline driving the sale (1031 exchange, divorce, estate, relocation)? That informs how much negotiation room exists.
- Schools are F-rated, which usually means shorter tenancies and higher turnover. Who's the typical renter profile here, and what's been the actual vacancy rate?
- Crime grade is F in this area — have there been break-ins, vandalism, or insurance claims at this property in the last 3 years? What carrier currently insures it and at what premium?
- What's the average days-on-market for RENTAL listings here right now (not sales)? A rising rental-DOM trend means longer vacancies and softer asking-rent achievability than the comps imply.
- What's the recent tenant-quality profile in this submarket — average credit score on applications, eviction rate, late-payment / NSF rate, and stable-employment percentage? A property-management company in the area should have these aggregated.
- How much new for-sale + rental construction is in the pipeline within 1–3 miles? Heavy new supply typically softens prices + rents 12–24 months out; constrained supply supports both.
Investment metrics
- 1% rule
- 1.32% ✓
- Cap rate
- 11.16%
- Cash-on-cash
- 17.39%
- DSCR
- 1.77
- GRM
- 6.3
CMA / ARV
- ARV (on-the-fly)
- $210,330
- Comps found
- 12
Show comp detail 12 sales within ~0.75 mi
| Address | Dist | Beds/Ba | Sqft | Sold | Price | $/sf | Match |
|---|---|---|---|---|---|---|---|
| 152 Short Pine Ave | 0.09mi | 3/2.0 | 1,880 (+10%) | 7mo | $144,000 | $77 | 69 |
| 430 Newton Ave | 0.30mi | 3/2.0 | 1,635 (-4%) | 11mo | $75,000 | $46 | 66 |
| 127 Edgewood Trl | 0.33mi | 3/2.0 | 1,823 (+7%) | 7mo | $268,900 | $148 | 64 |
| 454 Magnolia St | 0.17mi | 3/2.0 | 1,610 (-6%) | 20mo | $90,000 | $56 | 61 |
| 208 Sandy Hills Ct | 0.23mi | 4/2.0 (+1) | 1,828 (+7%) | 12mo | $256,000 | $140 | 59 |
| 113 Aubrey Ave | 0.57mi | 3/2.0 | 1,618 (-5%) | 4mo | $242,400 | $150 | 57 |
| 180 Sandy Hills Ct | 0.21mi | 3/2.0 | 1,600 (-6%) | 23mo | $273,000 | $171 | 57 |
| 704 Camilla Ave | 0.69mi | 3/2.0 | 1,622 (-5%) | 2mo | $199,900 | $123 | 54 |
| 299 Buena Dr | 0.70mi | 3/2.0 | 1,620 (-5%) | 1mo | $60,000 | $37 | 54 |
| 115 Aubrey Ave | 0.57mi | 4/2.0 (+1) | 1,774 (+4%) | 6mo | $252,400 | $142 | 53 |
| 1092 Newton Ave | 0.47mi | 3/2.0 | 1,556 (-9%) | 11mo | $70,000 | $45 | 50 |
| 120 Del Rio Ter | 0.64mi | 3/2.0 | 1,628 (-5%) | 23mo | $199,500 | $123 | 39 |
Match score weights: distance 35% · size 25% · config 20% · recency 20%. Top-matched comps best support the ARV.
Projected returns pro-forma
-3.0% appreciation · 3.0% rent growth · sell at horizon
- IRR
- 8.8%
- Equity multiple
- 1.34×
- Total profit
- $9,102
- Equity at exit
- $14,090
- IRR
- 18.0%
- Equity multiple
- 2.49×
- Total profit
- $39,323
- Equity at exit
- $8,171
Cash invested: $26,460 (down + closing). Projections, not guarantees.
Landlord ↔ Tenant lean methodology
- Overall (STATE)
- 90 Strongly Landlord-Friendly
- State Alabama
- 90 Strongly Landlord-Friendly · R+15
- County
- — inherits STATE
- City
- — inherits STATE
ZIP-level market 36360
- Home prices YoY
- -6.9%
- Active inventory
- 184
- Price-to-rent
- 6.3×
Monthly cashflow live
- Estimated rent
- $1,244 medium interval (Pro) →
- Mortgage (P&I)
- −$496
- Tax from tax record
- −$64 /mo · $771/yr
- Insurance
- −$39
- HOA
- −$0
- Vacancy / Maint / Mgmt
- −$261
- Net cashflow
- $384
Break-even live
UW: 25.0% down · 7.5% · 30yr · 1.5% tax · 5.0% vac · 8.0% maint · 8.0% mgmt
Financing live
Cash to close
- Down payment
- $23,625
- Closing costs
- $2,835
- Reserves months
- —
- Total cash needed
- —
Loan-product check · same deal, 3 products live
Conventional
25% down · 7.5% · 30yr
- Down + closing
- —
- Monthly P&I
- —
- Monthly cashflow
- —
- DSCR
- —
- Eligible?
- —
Personal DTI + credit; lowest rate.
DSCR
20% down · 8.5% · 30yr
- Down + closing
- —
- Monthly P&I
- —
- Monthly cashflow
- —
- DSCR
- —
- Eligible?
- —
No personal income docs; deal must DSCR.
Hard money
10% down · 12.0% · 12mo
- Down + closing
- —
- Monthly P&I
- —
- Monthly cashflow
- —
- DSCR
- —
- Eligible?
- —
Short-term bridge; refi at stabilization.
Rent comps 3 comps
| Address | Beds | Baths | Sqft | Rent | $/sqft | DOM | Units | Dist |
|---|---|---|---|---|---|---|---|---|
| 310 Stratford Dr Ozark, AL | 2.0 | 2.5 | 1500 | $1,300 | $0.87 | 44d | 1 | 0.49mi |
| 427 Dixie Dr Ozark, AL | 4.0 | 2.0 | 1800 | $1,300 | $0.72 | 44d | 1 | 0.55mi |
| 223 Fair Ave Ozark, AL | 2.0 | 1.0 | 1080 | $950 | $0.88 | 44d | 1 | 0.94mi |
Listing history 24 events
-
2026-05-05status Pending
-
2026-03-26$94,500 Active
-
2025-06-09price $145,000
-
2025-04-30status Active
-
2025-04-21status Pending
-
2025-04-07$149,000 Active
-
2025-04-02price $149,000
-
2025-03-10$155,000 Active
-
2024-12-12price $146,000
-
2024-12-11price $146,000
-
2024-11-23$150,000 Active
-
2024-11-22$150,000 Active
-
2024-10-31price $150,000
-
2024-10-31price $150,000
-
2024-10-12$155,000 Active
-
2024-10-11$155,000 Active
-
2020-04-22soldstatus $102,546
-
2020-04-20soldstatus $98,500
-
2020-04-20soldstatus $98,500
-
2019-09-16$99,900
-
2019-09-16$99,900
-
2007-08-24soldstatus $96,751
-
2007-08-24soldstatus $96,751
-
2007-04-27$109,900
ⓘ Source: listings_history table (triggers on properties + properties_extension) + one-shot
backfill from property_details.listing_events for pre-trigger history.
Tax reassessment forecast AL · Resets to sale price
- Current annual tax
- $771 · $64/mo
- Projected year-2 tax
- $771 · $64/mo
- Expected delta
- $0/yr ($0/mo · 0.0%)
ⓘ Screening estimate from a state-policy table — verify with the county assessor before closing.
Climate risk First Street
- Flood 1/10 Low FEMA zone X (unshaded) · 0% chance over 30 yrs
- Wildfire 3/10 Moderate
- Heat 7/10 Severe 7 d/yr ≥107°F today · 19 d/yr by 30 yrs out
- Wind 8/10 Severe 99% chance of damaging wind over 30 yrs
- Air quality 2/10 Low 1 unhealthy d/yr today · 1 by 30 yrs out
Nearby sold comps map
Loading sold comps map…
Walkable amenities ~0.75 mi
Loading nearby amenities…
Taxation est. · year 1
- Rental income
- $14,927
- − Mortgage interest
- −$5,293
- − Property taxes
- −$771
- − Insurance
- −$472
- − Repairs & maintenance
- −$1,194
- − Management
- −$1,194
- − Depreciation
- −$2,749
- Taxable income
- $3,253
- Est. tax owed @ 24.0%
- −$781
- After-tax cash flow
- $3,822/yr
For passive investors: Depreciation is non-cash, so a rental often shows a tax loss while cash-flowing — sheltering income. Rental losses are passive: they offset passive income freely, and up to $25,000/yr can offset ordinary (W-2) income if you actively participate and your MAGI is under $100k (phasing out to $0 by $150k); unused losses carry forward. On sale, claimed depreciation is recaptured at up to 25%, and gains may owe capital-gains tax (a 1031 exchange can defer both). Figures are a year-1 estimate at your 24.0% rate — not tax advice; consult a CPA.
Schools (NCES district)
- District
- Ozark City
- NCES district ID
- 0102640
- Math proficiency
- 11% ▼ -24.00%
- Reading proficiency
- 36% ▲ 1.00%
- Median HH income
- $39,155
- Composite
- 19.67/100
- National rank
- #8733
- State rank
- #99 of 129 in AL
Livability — Ozark
- Score
- 62/100
- State rank
- #224
- US rank
- #16855
Category grades
Schools grade is shown separately in the Schools card above.
Census & demographics
- Census place
- Ozark, AL
- City population
- 19,461
- Population (ZIP)
- 19,461
Population outlook (Dale County) Hauer SSP2
- Today (2025)
- 46,805 people
- By 2030
- 45,176 · -3.5%
- By 2040
- 41,523 · -11.3%
- By 2050
- 37,575 · -19.7%
- By 2075
- 28,931 · -38.2%
- By 2100
- 22,172 · -52.6%
Race, ethnicity, and origin ACS 2023
- Neighborhood character
- Majority White (65%)
- Race & ethnicity
- White 65% Black 27% Hispanic / Latino 4% Two or more races 3% Asian 1%
- Common ancestry
- Serbian 2% Lithuanian 1% Slovak 1%
- Foreign-born
- 4% · Canada
- Languages at home
- 94% English-only · Spanish 3% German/W. Germanic 1% Other Asian/Pacific 1%
Political lean MEDSL · Dale
- 2024 margin
- Solid R (+52.3) · D 23.5% · R 75.8%
- 2008→2024 swing
- -7.7pp toward R · 2008: -44.6pp · 2024: -52.3pp
- All cycles
- 2024: R+52.3 2020: R+46.3 2016: R+50.4 2012: R+42.2 2008: R+44.6
Not yet ingested
- Civics
- —
Market trends
- HPI YoY
- ▼ -14.80%
- Current HPI
- 198.6765
- Rent YoY
- —
- Metro
- —
- State GDP YoY
- ▲ 2.94%
- F500 in state
- 4
Industry mix (Fortune 500 HQ in AL)
| Industry | F500 HQs | Revenue |
|---|---|---|
| Financial Services | 1 | $8B |
|
||
| Healthcare | 1 | $5B |
|
||
Price history
-14.0% since first listed24 events — show timeline
- 2026-05-05 Pending — WBR
- 2026-03-26 Listed $94,500 WBR
- 2025-06-09 Price Changed $145,000 MAAR
- 2025-04-30 Relisted — MAAR
- 2025-04-21 Pending — MAAR
- 2025-04-07 Listed $149,000 MAAR
- 2025-04-02 Price Changed $149,000 SAMLS
- 2025-03-10 Listed $155,000 SAMLS
- 2024-12-12 Price Changed $146,000 SAMLS
- 2024-12-11 Price Changed $146,000 WBR
- 2024-11-23 Listed $150,000 SAMLS
- 2024-11-22 Listed $150,000 WBR
- 2024-10-31 Price Changed $150,000 WBR
- 2024-10-31 Price Changed $150,000 SAMLS
- 2024-10-12 Listed $155,000 SAMLS
- 2024-10-11 Listed $155,000 WBR
- 2020-04-22 Sold (Public Records) $102,546 Public Records
- 2020-04-20 Sold (MLS) $98,500 WBR
- 2020-04-20 Sold (MLS) $98,500 MAAR
- 2019-09-16 Listed $99,900 WBR
- 2019-09-16 Listed $99,900 MAAR
- 2007-08-24 Sold (Public Records) $96,751 Public Records
- 2007-08-24 Sold (MLS) $96,751 MAAR
- 2007-04-27 Listed $109,900 MAAR
Property tax history
+5.5%/yrLatest (2025): $771 · +14.1% YoY. Source: county tax records.
Cash-flow waterfall
monthlySold comps — $/sqft
last 12 mo · ≤1 miLoading sold comps…