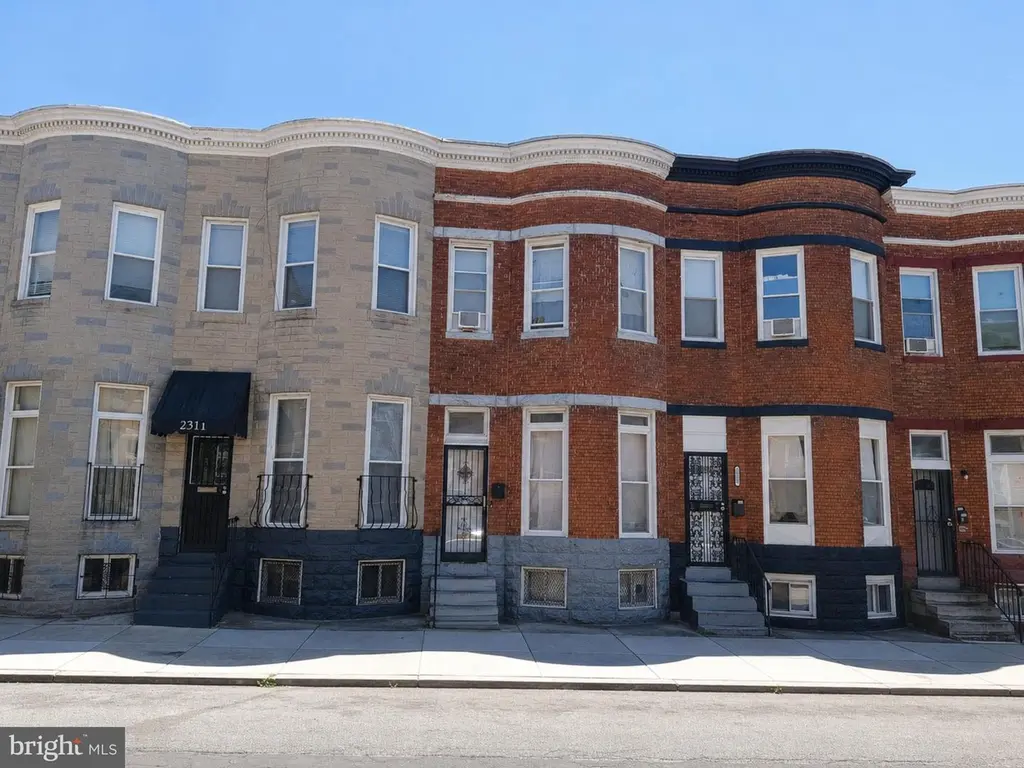
2309 Edgemont Ave · Baltimore, MD
Flood risk 1/10 · Minimal
- FEMA flood zone
- X (unshaded)
- Chance of flooding over 30 yrs
- 0.0%
- Est. flood insurance / yr
- $473 – $860
Fire risk 1/10 · Minimal
- Est. fire insurance / yr
- $755 – $1,403
Heat risk 7/10 · Major
- Hot days now (above 103°F)
- 7 days/yr
- Hot days in 30 yrs
- 15 days/yr
Wind risk 6/10 · Moderate
- Chance of severe wind over 30 yrs
- 27.0%
Air-quality risk 4/10 · Minor
- Unhealthy air days now
- 6 days/yr
- Unhealthy air days in 30 yrs
- 7 days/yr
Risk factors via First Street. Map © Google.
Why this score? — see what drove the B- grade
The composite is a weighted blend of 9 inputs, each scored 0–100. Each bar is that input's sub-score; the figure is the points it added to the 100-point composite (weight × sub-score).
- Cash flow +30.0/30.0
- 1% rule +10.0/10.0
- DSCR +10.0/10.0
- ARV discount +7.5/15.0
- Rent growth +4.2/5.0
- Livability +3.8/5.0
- Condition / age +2.5/5.0
- Schools +1.0/10.0
- Appreciation +0.0/10.0
$40,000
🖨 Deal sheet (PDF) 📄 Offer letter ✓ Due diligence
Listing remarks
ONLINE AUCTION: This auction takes place on the Ashland Auction Group website bidding platform. Bidding begins 6/30/2026 @ 10:00 AM. Bidding ends 7/2/2026 @ 12:30 PM. The list price is the suggested opening bid. Deposit: $5,000. This two-story townhouse is located in the Auchentoroly-Parkwood neighborhood of Baltimore City. Residents can enjoy the nearby attractions and facilities such as the Coppin State University, Mondawmin Mall, and Druid Hill Park. The property is vacant. Conveniently located just moments from Reisterstown Road, a major Baltimore arterial corridor providing quick access to downtown, major commuter routes, shopping, dining, and public transportation.
Key facts
- Druid hill park
- Two story townhouse
- Mondawmin mall
Tags
Property features AI
Finance
- Other: Ownership interest noted as ground rent
- Financial info: Ground rent amount $90, paid semi-annually; Improvement and land assessed values available
Exterior
- Parking: On-street parking
- Utilities: Public water; Public sewer; Natural gas for heating
- Home design: Interior townhouse / rowhouse; Above-grade finished area recorded from assessor
- Construction: Brick construction; Other type of foundation; Above-grade and below-grade structures
- Exterior features: Lot dimensions approximately 15 x 72; Ground rent applies (paid semi-annually)
Interior
- Bedrooms: Two bedrooms on the first upper level
- Bathrooms: One full bathroom (total)
- Heating & cooling: Radiator heating; Electric cooling
- Interior features: Unfinished basement; Living area recorded from assessor
Neighborhood map
What this means for you Summary
Snapshot
- This is a 2-bed/1.0-bath townhouse listed at $40k.
Deal economics
- At list price, monthly cash flow is $901 ($11k/yr) — positive.
- The deal already cash-flows at list — no discount required.
- Meets the 1% rule at list price ($2k rent vs $40k).
- Cap rate 33.3% vs local median 6.0% in Baltimore — top-decile yield for the area; either an underpriced asset or a hidden risk that comps aren't pricing in. Stress-test before assuming the spread holds.
Location & tenants
- Location reads 76/100 on livability (#90 in MD, #3,396 nationally) — a middle-class / working-renter tenant base. Strengths: amenities A+, commute A+, housing A+; Watch: schools D, crime F.
- Baltimore City Public Schools (urban): math 7% / reading 16% proficiency, ranked #24 of 24 in MD (top 100%) — low school quality limits family demand, transient renter base, plan for 1-2y turnover; 79% free/reduced lunch — lower-income household profile, screen leases tightly.
- Market conditions: Rents rising fast (+6.6%/yr); 331 active listings in the ZIP; 40 comparable units currently listed for rent nearby; rentals at typical pace (median 25d on market — plan ~3-4 weeks tenant-placement turnaround); 45% of comp listings sitting > 30 days — soft ceiling on asking rent; lower-income renter base — watch delinquency; 1,273 units permitted in Baltimore city in 2024 (1,104 in 5+ unit buildings).
- At $1,639/mo this rent would consume 51% of the median local household income ($38k/yr) (locally 2921% of renters already pay >50% of income on rent) — very limited rent-growth headroom before tenants either downsize or default.
Forward outlook
- Local home prices are declining (-3.0%/yr); year-one equity from $277 of loan paydown is wiped out by about $1k of value loss. Plan a longer hold.
- Baltimore County population projected to shrink 4% by 2050 — rents likely to lag national; underwrite the cash flow, not the appreciation.
- At projected returns (-3.0% appreciation + 6.6% rent growth), your $11k cash investment doubles in ~2 years — after that, you're playing with house money.
Negotiation context
- Only 9 days on market — expect competitive offers; lowballing is unlikely to land.
Risks & watch-outs
- Watch-outs: property tax is 5.0% of price; built in 1920 — expect roof / HVAC / electrical / plumbing capex.
- Climate carrying-cost: major wind risk, 27% chance of damaging wind over 30y; extreme-heat days projected 7→15/yr by 2055 (HVAC capex compounding) — expect insurance premiums to compound above CPI over the hold.
Questions for the listing agent
- Built in 1920 — when were the roof, HVAC, electrical panel, plumbing, and water heater last replaced?
- Property tax is high relative to price — has the assessment been appealed recently, and will the sale trigger a re-assessment?
- Is there a deadline driving the sale (1031 exchange, divorce, estate, relocation)? That informs how much negotiation room exists.
- Schools are D-rated, which usually means shorter tenancies and higher turnover. Who's the typical renter profile here, and what's been the actual vacancy rate?
- Crime grade is F in this area — have there been break-ins, vandalism, or insurance claims at this property in the last 3 years? What carrier currently insures it and at what premium?
- What's the average days-on-market for RENTAL listings here right now (not sales)? A rising rental-DOM trend means longer vacancies and softer asking-rent achievability than the comps imply.
- What's the recent tenant-quality profile in this submarket — average credit score on applications, eviction rate, late-payment / NSF rate, and stable-employment percentage? A property-management company in the area should have these aggregated.
- How much new for-sale + rental construction is in the pipeline within 1–3 miles? Heavy new supply typically softens prices + rents 12–24 months out; constrained supply supports both.
Investment metrics
- 1% rule
- 4.10% ✓
- Cap rate
- 33.34%
- Cash-on-cash
- 96.58%
- DSCR
- 5.30
- GRM
- 2.0
CMA / ARV
- ARV (on-the-fly)
- $89,552
- Comps found
- 12
Show comp detail 12 sales within ~0.75 mi
| Address | Dist | Beds/Ba | Sqft | Sold | Price | $/sf | Match |
|---|---|---|---|---|---|---|---|
| 2105 Whittier Ave | 0.22mi | 3/1.5 (+1) | 1,587 (+3%) | 1mo | $80,000 | $50 | 77 |
| 2521 Reisterstown Rd | 0.32mi | 3/2.0 (+1) | 1,578 (+2%) | 3mo | $215,000 | $136 | 70 |
| 2453 Mcculloh St | 0.38mi | 3/1.0 (+1) | 1,460 (-5%) | 3mo | $99,900 | $68 | 65 |
| 2863 Woodbrook Ave | 0.07mi | 3/1.0 (+1) | 1,320 (-14%) | 7mo | $55,000 | $42 | 62 |
| 2400 Reisterstown Rd | 0.22mi | 3/2.0 (+1) | 1,752 (+14%) | 5mo | $75,000 | $43 | 55 |
| 1719 Baker St | 0.63mi | 2/1.0 | 1,400 (-9%) | 2mo | $19,250 | $14 | 54 |
| 2117 N Smallwood St | 0.44mi | 3/2.5 (+1) | 1,680 (+9%) | 1mo | $192,000 | $114 | 53 |
| 608 Cumberland St | 0.49mi | 3/2.0 (+1) | 1,700 (+10%) | 2mo | $90,000 | $53 | 49 |
| 2418 Druid Hill Ave | 0.40mi | 3/1.5 (+1) | 1,328 (-14%) | 6mo | $77,000 | $58 | 46 |
| 829 Chauncey Ave | 0.55mi | 3/2.5 (+1) | 1,440 (-7%) | 7mo | $295,000 | $205 | 46 |
| 3104 Tioga Pkwy | 0.74mi | 3/2.0 (+1) | 1,640 (+6%) | 3mo | $217,000 | $132 | 44 |
| 2115 Mcculloh St | 0.68mi | 3/1.5 (+1) | 1,350 (-13%) | 4mo | $77,000 | $57 | 37 |
Match score weights: distance 35% · size 25% · config 20% · recency 20%. Top-matched comps best support the ARV.
Projected returns pro-forma
-3.0% appreciation · 6.63% rent growth · sell at horizon
- IRR
- —
- Equity multiple
- 6.11×
- Total profit
- $57,230
- Equity at exit
- $5,964
- IRR
- —
- Equity multiple
- 14.53×
- Total profit
- $151,582
- Equity at exit
- $3,458
Cash invested: $11,200 (down + closing). Projections, not guarantees.
Landlord ↔ Tenant lean methodology
- Overall (CITY)
- 12 Strongly Tenant-Friendly
- State Maryland
- 27 Tenant-Leaning · D+14
- County
- — inherits STATE
- City Baltimore
- 12 Strongly Tenant-Friendly · D+58
ZIP-level market 21217
- Rents YoY
- 6.6%
- Active inventory
- 331
- Price-to-rent
- 2.0×
Monthly cashflow live
- Estimated rent
- $1,639 high interval (Pro) →
- Mortgage (P&I)
- −$210
- Tax from tax record
- −$167 /mo · $1,999/yr
- Insurance
- −$17
- HOA
- −$0
- Vacancy / Maint / Mgmt
- −$344
- Net cashflow
- $901
Break-even live
Sensitivity live
| Price | -10% $1,046 | -5% $1,032 | +0% $901 | +5% $890 | +10% $879 |
|---|---|---|---|---|---|
| Rent | -10% $772 | -5% $837 | +0% $901 | +5% $966 | +10% $1,031 |
| Rate | -1.0pp $922 | -0.5pp $912 | base $901 | +0.5pp $891 | +1.0pp $881 |
UW: 25.0% down · 7.5% · 30yr · 1.5% tax · 5.0% vac · 8.0% maint · 8.0% mgmt
Financing live
Cash to close
- Down payment
- $10,000
- Closing costs
- $1,200
- Reserves months
- —
- Total cash needed
- —
Loan-product check · same deal, 3 products live
Conventional
25% down · 7.5% · 30yr
- Down + closing
- —
- Monthly P&I
- —
- Monthly cashflow
- —
- DSCR
- —
- Eligible?
- —
Personal DTI + credit; lowest rate.
DSCR
20% down · 8.5% · 30yr
- Down + closing
- —
- Monthly P&I
- —
- Monthly cashflow
- —
- DSCR
- —
- Eligible?
- —
No personal income docs; deal must DSCR.
Hard money
10% down · 12.0% · 12mo
- Down + closing
- —
- Monthly P&I
- —
- Monthly cashflow
- —
- DSCR
- —
- Eligible?
- —
Short-term bridge; refi at stabilization.
Rent comps 40 comps
| Address | Beds | Baths | Sqft | Rent | $/sqft | DOM | Units | Dist |
|---|---|---|---|---|---|---|---|---|
| 2231 Orem Ave Baltimore, MD | 3.0 | 1.5 | 1140 | $1,750 | $1.54 | 18d | 1 | 0.09mi |
| 2301 Whittier Ave Unit 1 Baltimore, MD | 2.0 | 1.0 | 1104 | $1,400 | $1.27 | 44d | 1 | 0.10mi |
| 2301 Whittier Ave Unit 3 Baltimore, MD | 2.0 | 2.0 | 1104 | $1,650 | $1.49 | 44d | 1 | 0.10mi |
| 2301 Whittier Ave Unit 2 Baltimore, MD | 2.0 | 2.0 | 1104 | $1,400 | $1.27 | 44d | 1 | 0.10mi |
| 1507 Retreat St Unit 1 Baltimore, MD | 3.0 | 3.0 | 1098 | $2,500 | $2.28 | 44d | 1 | 0.32mi |
| 1515 Retreat St Baltimore, MD | 3.0 | 2.0 | 1098 | $1,800 | $1.64 | 24d | 1 | 0.32mi |
| 2614 Pennsylvania Ave Baltimore, MD | 1.0–3.0 | 1.0–2.0 | 982 | $876 | $0.89 | 5d | 4 | 0.33mi |
| 2449 Druid Hill Ave Baltimore, MD | 2.0 | 1.0 | 1100 | $1,800 | $1.64 | 44d | 1 | 0.40mi |
| 2511 Madison Ave #2 Baltimore, MD | 3.0 | 1.0 | 1100 | $1,650 | $1.50 | 44d | 1 | 0.41mi |
| 2409 Francis St Baltimore, MD | 3.0 | 1.0 | 1298 | $1,500 | $1.16 | 44d | 1 | 0.42mi |
| 2433 Druid Hill Ave Baltimore, MD | 2.0 | 2.5 | 1092 | $1,999 | $1.83 | 44d | 1 | 0.42mi |
| 1806 N Mount St Baltimore, MD | 3.0 | 3.0 | 1200 | $1,700 | $1.42 | 20d | 1 | 0.48mi |
| 2204 Clifton Ave Baltimore, MD | 3.0 | 1.0 | 1400 | $1,450 | $1.04 | 5d | 1 | 0.49mi |
| 1121 Whitelock St Baltimore, MD | 2.0 | 1.0 | 1180 | $1,300 | $1.10 | 44d | 1 | 0.49mi |
| 1729 N Fulton Ave Baltimore, MD | 3.0 | 2.0 | 1081 | $1,795 | $1.66 | 44d | 1 | 0.51mi |
| 519 Sanford Pl Baltimore, MD | 3.0 | 1.0 | 1300 | $1,650 | $1.27 | 17d | 1 | 0.55mi |
| 1205 Clendenin St Baltimore, MD | 3.0 | 1.5 | 1560 | $800 | $0.51 | 24d | 1 | 0.56mi |
| 2339 Eutaw Pl Ste 1 Baltimore, MD | 2.0 | 1.0 | 1300 | $1,275 | $0.98 | 44d | 1 | 0.58mi |
| 1616 N Fulton Ave Baltimore, MD | 3.0 | 2.0 | 1620 | $1,795 | $1.11 | 5d | 1 | 0.62mi |
| 2910 Reisterstown Rd Baltimore, MD | 1.0–3.0 | 1.0 | 950 | $1,314 | $1.38 | 15d | 4 | 0.62mi |
| 805 Brooks Ln #2 Baltimore, MD | 2.0 | 1.0 | 2120 | $1,500 | $0.71 | 3d | 1 | 0.63mi |
| 1816 N Bentalou St Baltimore, MD | 3.0 | 2.0 | 1350 | $1,700 | $1.26 | 11d | 1 | 0.66mi |
| 1816 N Bentalou St Baltimore, MD | 3.0 | 2.0 | 1350 | $1,700 | $1.26 | 24d | 1 | 0.66mi |
| 2401 Brookfield Ave Baltimore, MD | 2.0–3.0 | 1.0–2.0 | 1102 | $1,500 | $1.36 | 24d | 3 | 0.67mi |
| 2407 Brookfield Ave Unit 4 Baltimore, MD | 2.0 | 2.0 | 1300 | $1,550 | $1.19 | 44d | 1 | 0.67mi |
| 2305 Wichita Ave Unit 1 Baltimore, MD | 3.0 | 1.0 | 1950 | $1,300 | $0.67 | 24d | 1 | 0.69mi |
| 1516 N Mount St Baltimore, MD | 3.0 | 1.5 | 1830 | $1,750 | $0.96 | 15d | 1 | 0.69mi |
| 3104 Tioga Pkwy Baltimore, MD | 3.0 | 2.0 | 1640 | $2,050 | $1.25 | 22d | 1 | 0.71mi |
| 1501 N Payson St Baltimore, MD | 3.0 | 1.0 | 1400 | $1,550 | $1.11 | 44d | 1 | 0.76mi |
| 1433 N Fulton Ave Baltimore, MD | 2.0 | 1.0 | 1200 | $1,500 | $1.25 | 44d | 1 | 0.76mi |
| 2028 Druid Hill Ave Baltimore, MD | 3.0 | 2.5 | 1437 | $1,799 | $1.25 | 11d | 1 | 0.77mi |
| 2028 Druid Hill Ave Unit 1 Baltimore, MD | 3.0 | 2.5 | 1437 | $1,750 | $1.22 | 3d | 1 | 0.77mi |
| 1617-A Moreland Ave Unit 2nd Flr Baltimore, MD | 2.0 | 1.0 | 1500 | $1,400 | $0.93 | 44d | 1 | 0.78mi |
| 2317 Callow Ave Unit E Baltimore, MD | 1.0 | 1.0 | 1100 | $1,600 | $1.45 | 44d | 1 | 0.81mi |
| 1346 N Carey St Baltimore, MD | 2.0 | 1.5 | 1100 | $1,500 | $1.36 | 44d | 1 | 0.86mi |
| 815 Lennox St Baltimore, MD | 3.0 | 3.5 | 1600 | $2,790 | $1.74 | 24d | 1 | 0.89mi |
| 2636 W North Ave Baltimore, MD | 2.0–3.0 | 1.0–2.0 | 975 | $1,300 | $1.33 | 5d | 1 | 0.90mi |
| 1829 Eutaw Pl Unit B Baltimore, MD | 2.0 | 2.0 | 1278 | $2,100 | $1.64 | 5d | 1 | 0.93mi |
| 736 Watts St Baltimore, MD | 3.0 | 3.5 | 2000 | $3,250 | $1.62 | 44d | 1 | 0.96mi |
| 3000 Falls Rd Baltimore, MD | 2.0 | 1.0 | 1646 | $2,499 | $1.52 | 2d | 1 | 0.96mi |
Listing history 8 events
-
2026-06-19remarks 679-char remark
-
2026-06-18days on market $40,000 Active 9 DOM
-
2026-06-17days on market $40,000 Active 8 DOM
-
2026-06-16days on market $40,000 Active 7 DOM
-
2026-06-15days on market $40,000 Active 6 DOM
-
2026-06-13days on market $40,000 Active 4 DOM
-
2026-06-10remarks 678-char remark
-
2026-06-10$40,000 Active 1 DOM
ⓘ Source: listings_history table (triggers on properties + properties_extension) + one-shot
backfill from property_details.listing_events for pre-trigger history.
Tax reassessment forecast MD · Partial reset (capped growth)
- Current annual tax
- $1,999 · $167/mo
- Projected year-2 tax
- $1,999 · $167/mo
- Expected delta
- $0/yr ($0/mo · 0.0%)
ⓘ Screening estimate from a state-policy table — verify with the county assessor before closing.
Climate risk First Street
- Flood 1/10 Low FEMA zone X (unshaded) · 0% chance over 30 yrs
- Wildfire 1/10 Low
- Heat 7/10 Severe 7 d/yr ≥103°F today · 15 d/yr by 30 yrs out
- Wind 6/10 Major 27% chance of damaging wind over 30 yrs
- Air quality 4/10 Moderate 6 unhealthy d/yr today · 7 by 30 yrs out
Nearby sold comps map
Loading sold comps map…
Walkable amenities ~0.75 mi
Loading nearby amenities…
Taxation est. · year 1
- Rental income
- $19,662
- − Mortgage interest
- −$2,241
- − Property taxes
- −$1,999
- − Insurance
- −$200
- − Repairs & maintenance
- −$1,573
- − Management
- −$1,573
- − Depreciation
- −$1,164
- Taxable income
- $10,913
- Est. tax owed @ 24.0%
- −$2,619
- After-tax cash flow
- $8,198/yr
For passive investors: Depreciation is non-cash, so a rental often shows a tax loss while cash-flowing — sheltering income. Rental losses are passive: they offset passive income freely, and up to $25,000/yr can offset ordinary (W-2) income if you actively participate and your MAGI is under $100k (phasing out to $0 by $150k); unused losses carry forward. On sale, claimed depreciation is recaptured at up to 25%, and gains may owe capital-gains tax (a 1031 exchange can defer both). Figures are a year-1 estimate at your 24.0% rate — not tax advice; consult a CPA.
Schools (NCES district)
- District
- Baltimore City Public Schools
- NCES district ID
- 2400090
- Math proficiency
- 7% ▼ -9.00%
- Reading proficiency
- 16% ▼ -5.00%
- Median HH income
- $42,108
- Composite
- 10.08/100
- National rank
- #9805
- State rank
- #24 of 24 in MD
Livability — Baltimore
- Score
- 76/100
- State rank
- #90
- US rank
- #3396
Category grades
Schools grade is shown separately in the Schools card above.
Census & demographics
- Census place
- Baltimore, MD
- County
- Baltimore City · 558,601 people
- City population
- 588,727
- Metro
- Baltimore-Columbia-Towson, MD
- Population (ZIP)
- 30,792
- Household income
- $38,409
- Rent vs Own
- Severe rent burden
- 2921.0
Population outlook (Baltimore County) Hauer SSP2
- Today (2025)
- 624,249 people
- By 2030
- 621,541 · -0.4%
- By 2040
- 609,756 · -2.3%
- By 2050
- 597,249 · -4.3%
- By 2075
- 552,236 · -11.5%
- By 2100
- 513,934 · -17.7%
Race, ethnicity, and origin ACS 2023
- Neighborhood character
- Predominantly Black (81%)
- Race & ethnicity
- Black 81% White 12% Two or more races 4% Hispanic / Latino 2% Asian 2%
- Common ancestry
- Romanian 1% Hispanic 1% Italian 1%
- Foreign-born
- 5% · Canada, China, South Korea
- Languages at home
- 94% English-only · Spanish 2% French/Haitian/Cajun 1% Chinese 1%
Political lean MEDSL · Baltimore
- 2024 margin
- Solid D (+73.0) · D 85.2% · R 12.2% · Other 2.6%
- 2008→2024 swing
- -2.5pp toward R · 2008: 75.5pp · 2024: 73.0pp
- All cycles
- 2024: D+73.0 2020: D+76.6 2016: D+74.6 2012: D+76.4 2008: D+75.5
Not yet ingested
- Civics
- —
Market trends
- HPI YoY
- ▼ -187.20%
- Current HPI
- 104.2102
- Rent YoY
- ▲ 6.63%
- Metro
- Baltimore-Columbia-Towson, MD
- State GDP YoY
- ▲ 2.97%
- F500 in state
- 12
Industry mix (Fortune 500 HQ in MD)
| Industry | F500 HQs | Revenue |
|---|---|---|
| Aerospace / Defense | 1 | $71B |
|
||
| Utilities | 1 | $25B |
|
||
| Hotels | 1 | $24B |
|
||
| Consumer Goods | 1 | $7B |
|
||
| Real Estate | 1 | $6B |
|
||
| Chemicals | 1 | $2B |
|
||
Price history
+5.5% since first listed2 events — show timeline
- 2026-06-09 Listed $40,000 BRIGHT MLS
- 1989-04-28 Sold (Public Records) $37,900 Public Records
Property tax history
+0.5%/yrLatest (2025): $1,999 · +0.0% YoY. Source: county tax records.
Cash-flow waterfall
monthlySold comps — $/sqft
last 12 mo · ≤1 miLoading sold comps…