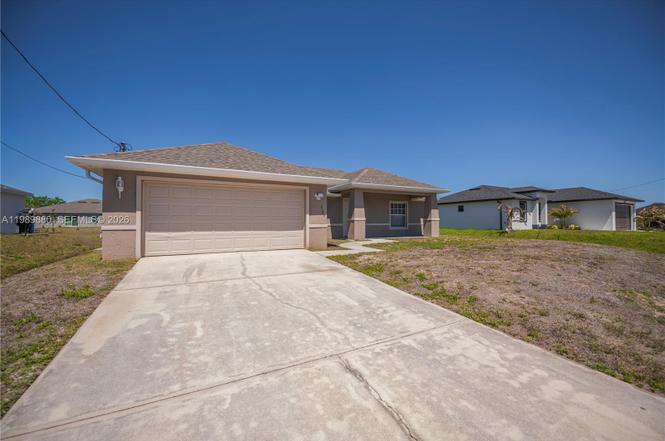
4104 13th St SW · Lehigh Acres, FL
Flood risk 1/10 · Minimal
- FEMA flood zone
- X (unshaded)
- Chance of flooding over 30 yrs
- 0.0%
- Est. flood insurance / yr
- $507 – $1,088
Fire risk 3/10 · Minor
- Est. fire insurance / yr
- $947 – $1,759
Heat risk 10/10 · Severe
- Hot days now (above 107°F)
- 7 days/yr
- Hot days in 30 yrs
- 30 days/yr
Wind risk 10/10 · Severe
- Chance of severe wind over 30 yrs
- 99.0%
Air-quality risk 2/10 · Minimal
- Unhealthy air days now
- 1 days/yr
- Unhealthy air days in 30 yrs
- 1 days/yr
Risk factors via First Street. Map © Google.
Why this score? — see what drove the D grade
The composite is a weighted blend of 9 inputs, each scored 0–100. Each bar is that input's sub-score; the figure is the points it added to the 100-point composite (weight × sub-score).
- ARV discount +11.2/15.0
- Appreciation +10.0/10.0
- Cash flow +7.8/30.0
- Schools +4.1/10.0
- Livability +3.0/5.0
- Condition / age +2.5/5.0
- Rent growth +2.1/5.0
- 1% rule +1.9/10.0
- DSCR +1.9/10.0
$279,000
🖨 Deal sheet (PDF) 📄 Offer letter ✓ Due diligence
Listing remarks MLS
Price Improvement! Seller looking at all offers. Conveniently located in the heart of Lehigh Acres with quick access to shopping, dining, and daily essentials. This home offers fantastic value for the savvy buyer seeking a well-cared-for home in a rapidly growing and stable area. This beautifully maintained 3-bedroom, 2-bath home sits on a spacious 0.25-acre lot, showcasing a split-bedroom floor plan for privacy and functionality. The master suite features a walk-in closet and private bath. You’ll appreciate the open-concept layout and ample feel of its vaulted ceilings. This well-designed home offers a centrally located kitchen that includes a large island with direct sightlines to the Great- room. Sliding glass doors in the dining area lead you out to the screened-in, covered lanai perfect for enjoying a relaxing evening breeze. The spacious backyard is sure to entertain, with plenty room for pets, playground and a pool! This home has been freshly painted inside and out and cleverly color coordinated, including a fully painted garage with a coated epoxy floor. Major newer updates include roof, HVAC system, water heater, and water softener for improved water quality. And, as an added bonus, there are no water or HOA expenses!
Key facts
- Walk-in closet
- Private bath
- Large island
Tags
Property features AI
Exterior
- Parking: 2-car garage; Driveway; Garage door opener
- Utilities: Electric service
- Home design: Single-story; Block construction; Shingle roof; Effective year built
- Construction: Block construction; Shingle roof; Built or updated to an effective year built
- Exterior features: Patio; Room for pool; South-facing
Interior
- Kitchen: Dishwasher; Electric range; Disposal; Microwave
- Flooring: Carpet; Tile
- Bathrooms: 2 full bathrooms
- Heating & cooling: Electric heating; Electric cooling
- Interior features: Built-in features
- Laundry & utility: Washer hookup; Dryer hookup; Laundry / utility room
Neighborhood map
What this means for you Summary
Snapshot
- This is a 3-bed/2.0-bath single-family listed at $279k.
Deal economics
- At list price, monthly cash flow is $-314 ($-4k/yr) — negative.
- To cash-flow at today's rent, offer at most $223k (19.9% below list).
- To meet the 1% rule (rent ≥ 1% of price), the offer needs to be $193k (30.7% below list).
- Recommended offer: $193k (30.7% below list) — sets the bar for 1% rule.
Location & tenants
- Location reads 59/100 on livability (#826 in FL) — a working-class tenant base; expect higher turnover. Strengths: cost of living A+, housing A+; Watch: crime C-, employment D+, amenities F.
- Lee (suburban): math 47% / reading 50% proficiency, ranked #42 of 73 in FL (top 58%) — families likely to look elsewhere, expect single-tenant / working-renter base with shorter leases.
- Zoned schools: Veterans Park Academy For The Arts (math 41% / reading 45%, grade F, #1,366 of 2,144 statewide, top 64%, 2,133 students, 36% FRL); Oak Hammock Middle School (math 43% / reading 41%, grade D-, #340 of 571 statewide, top 61%, 1,563 students, 56% FRL); Lehigh Senior High School (math 23% / reading 45%, grade F, #394 of 667 statewide, top 60%, 2,476 students, 57% FRL).
- Market conditions: Rents soft (-1.5%/yr); 788 active listings in the ZIP; 40 comparable units currently listed for rent nearby; rentals at typical pace (median 26d on market — plan ~3-4 weeks tenant-placement turnaround); 15,411 units permitted in Lee County in 2024 (4,686 in 5+ unit buildings).
- This rent runs 32% of the median local income ($73k/yr) — at the standard rent-burdened threshold; future hikes will face affordability resistance.
Forward outlook
- In year one you build about $30k of equity ($2k loan paydown + $28k appreciation (10.0% local appreciation)).
- Lee County population projected at +44% by 2050 — long-run rental-demand tailwind backs the buy-and-hold thesis.
- By year 2, paydown + projected appreciation supports a ~$48k cash-out refi (75% LTV) — recoverable capital for the next deal without selling this one.
Negotiation context
- It's been on market 89 days — a 6% lower offer ($262k) is reasonable based on typical stale-listing flexibility.
- 10 sale attempts since 3y ago with the ask held roughly flat each time — persistent listings suggest the price (not the market) is what's stuck; bring a comps-based counter.
- Current owner paid $48k; list at $279k implies a 481% gain — meaningful room to come down on a strong offer.
Risks & watch-outs
- Climate carrying-cost: severe wind risk, 99% chance of damaging wind over 30y; extreme-heat days projected 7→30/yr by 2055 (HVAC capex compounding) — expect insurance premiums to compound above CPI over the hold.
Questions for the listing agent
- What do current leases actually rent for vs. the listed asking? Can we see a recent rent roll and the last 12 months of T-12 income?
- It's been on market 89 days. Have you received any prior offers? Is the seller open to a 31% concession, seller financing, or rate buy-down credit?
- Why hasn't it sold? Are there any deal-killer items the seller is aware of (foundation, flood, title, zoning, code violations)?
- Is there a deadline driving the sale (1031 exchange, divorce, estate, relocation)? That informs how much negotiation room exists.
- Schools are D-rated, which usually means shorter tenancies and higher turnover. Who's the typical renter profile here, and what's been the actual vacancy rate?
- The area grade is low — what's the realistic commute time and amenity access for the typical tenant pool here? Any planned neighborhood developments (good or bad) we should know about?
- What's the average days-on-market for RENTAL listings here right now (not sales)? A rising rental-DOM trend means longer vacancies and softer asking-rent achievability than the comps imply.
- What's the recent tenant-quality profile in this submarket — average credit score on applications, eviction rate, late-payment / NSF rate, and stable-employment percentage? A property-management company in the area should have these aggregated.
- How much new for-sale + rental construction is in the pipeline within 1–3 miles? Heavy new supply typically softens prices + rents 12–24 months out; constrained supply supports both.
Investment metrics
- 1% rule
- 0.69% ✗
- Cap rate
- 4.94%
- Cash-on-cash
- -4.83%
- DSCR
- 0.79
- GRM
- 12.0
CMA / ARV
- ARV (on-the-fly)
- $304,344
- Comps found
- 11
Show comp detail 11 sales within ~0.75 mi
| Address | Dist | Beds/Ba | Sqft | Sold | Price | $/sf | Match |
|---|---|---|---|---|---|---|---|
| 4109 11th St SW | 0.10mi | 3/2.0 | 1,426 (+1%) | 11mo | $288,000 | $202 | 85 |
| 4203 11th St SW | 0.17mi | 3/2.0 | 1,392 (-1%) | 10mo | $285,000 | $205 | 82 |
| 4000 10th St SW | 0.27mi | 3/2.0 | 1,407 (-0%) | 12mo | $270,000 | $192 | 77 |
| 3913 16th St W | 0.38mi | 3/2.0 | 1,328 (-6%) | 1mo | $279,999 | $211 | 72 |
| 4000 17th St SW | 0.36mi | 4/2.0 (+1) | 1,426 (+1%) | 23mo | $323,990 | $227 | 57 |
| 4208 17th St SW | 0.34mi | 3/2.0 | 1,272 (-10%) | 19mo | $275,000 | $216 | 52 |
| 3914 9th St SW | 0.35mi | 4/2.0 (+1) | 1,491 (+6%) | 24mo | $349,999 | $235 | 49 |
| 812 Floyd Ave S | 0.47mi | 3/2.0 | 1,247 (-12%) | 22mo | $277,000 | $222 | 41 |
| 4012 19th St SW | 0.44mi | 3/2.0 | 1,240 (-12%) | 23mo | $305,000 | $246 | 40 |
| 4012 22nd St SW | 0.61mi | 3/2.0 | 1,550 (+10%) | 22mo | $313,990 | $203 | 36 |
| 3810 21st St SW | 0.69mi | 4/2.0 (+1) | 1,532 (+9%) | 23mo | $365,000 | $238 | 29 |
Match score weights: distance 35% · size 25% · config 20% · recency 20%. Top-matched comps best support the ARV.
Projected returns pro-forma
10.0% appreciation · 0.0% rent growth · sell at horizon
- IRR
- 20.1%
- Equity multiple
- 2.62×
- Total profit
- $126,238
- Equity at exit
- $251,345
- IRR
- 17.8%
- Equity multiple
- 5.83×
- Total profit
- $377,304
- Equity at exit
- $542,036
Cash invested: $78,120 (down + closing). Projections, not guarantees.
Landlord ↔ Tenant lean methodology
- Overall (STATE)
- 87 Strongly Landlord-Friendly
- State Florida
- 87 Strongly Landlord-Friendly · R+3
- County
- — inherits STATE
- City
- — inherits STATE
ZIP-level market 33976
- Home prices YoY
- 6.8%
- Rents YoY
- -1.5%
- Active inventory
- 788
- Price-to-rent
- 12.0×
Monthly cashflow live
- Estimated rent
- $1,933 high interval (Pro) →
- Mortgage (P&I)
- −$1,463
- Tax from tax record
- −$262 /mo · $3,148/yr
- Insurance
- −$116
- HOA
- −$0
- Vacancy / Maint / Mgmt
- −$406
- Net cashflow
- $-314
Break-even live
Sensitivity live
| Price | -10% $-156 | -5% $-235 | +0% $-314 | +5% $-393 | +10% $-472 |
|---|---|---|---|---|---|
| Rent | -10% $-467 | -5% $-391 | +0% $-314 | +5% $-238 | +10% $-162 |
| Rate | -1.0pp $-174 | -0.5pp $-243 | base $-314 | +0.5pp $-387 | +1.0pp $-460 |
UW: 25.0% down · 7.5% · 30yr · 1.5% tax · 5.0% vac · 8.0% maint · 8.0% mgmt
Financing live
Cash to close
- Down payment
- $69,750
- Closing costs
- $8,370
- Reserves months
- —
- Total cash needed
- —
Loan-product check · same deal, 3 products live
Conventional
25% down · 7.5% · 30yr
- Down + closing
- —
- Monthly P&I
- —
- Monthly cashflow
- —
- DSCR
- —
- Eligible?
- —
Personal DTI + credit; lowest rate.
DSCR
20% down · 8.5% · 30yr
- Down + closing
- —
- Monthly P&I
- —
- Monthly cashflow
- —
- DSCR
- —
- Eligible?
- —
No personal income docs; deal must DSCR.
Hard money
10% down · 12.0% · 12mo
- Down + closing
- —
- Monthly P&I
- —
- Monthly cashflow
- —
- DSCR
- —
- Eligible?
- —
Short-term bridge; refi at stabilization.
Rent comps 40 comps
| Address | Beds | Baths | Sqft | Rent | $/sqft | DOM | Units | Dist |
|---|---|---|---|---|---|---|---|---|
| 4005 12th St SW Lehigh Acres, FL | 3.0 | 2.0 | 1122 | $1,610 | $1.43 | 21d | 1 | 0.18mi |
| 4218 8th St SW Lehigh Acres, FL | 3.0 | 2.0 | 1408 | $1,800 | $1.28 | 25d | 1 | 0.41mi |
| 4221 18th St SW Lehigh Acres, FL | 3.0 | 2.5 | 1600 | $2,600 | $1.62 | 16d | 1 | 0.45mi |
| 3820 7th St SW Lehigh Acres, FL | 4.0 | 2.0 | 1841 | $2,500 | $1.36 | 13d | 1 | 0.50mi |
| 3818 7th St SW Lehigh Acres, FL | 3.0 | 2.0 | 1422 | $1,695 | $1.19 | 25d | 1 | 0.51mi |
| 1502 Gretchen Ave S Lehigh Acres, FL | 3.0 | 2.0 | 1270 | $2,000 | $1.57 | 5d | 1 | 0.54mi |
| 610 Floyd Ave S Lehigh Acres, FL | 3.0 | 2.0 | 1400 | $2,100 | $1.50 | 25d | 1 | 0.56mi |
| 1117 Gordon Ave S Lehigh Acres, FL | 3.0 | 2.0 | 1170 | $1,750 | $1.50 | 23d | 1 | 0.61mi |
| 1544 Gretchen Ave S Lehigh Acres, FL | 2.0 | 2.0 | 1221 | $1,800 | $1.47 | 25d | 1 | 0.64mi |
| 4503 15th St SW Lehigh Acres, FL | 3.0 | 2.0 | 1200 | $1,800 | $1.50 | 25d | 1 | 0.65mi |
| 3714 17th St SW Lehigh Acres, FL | 4.0 | 2.0 | 1833 | $1,890 | $1.03 | 25d | 1 | 0.65mi |
| 1504 Gary Ln Lehigh Acres, FL | 3.0 | 2.0 | 1198 | $1,660 | $1.39 | 25d | 1 | 0.65mi |
| 1506 Gary Ln Lehigh Acres, FL | 3.0 | 2.0 | 1198 | $1,660 | $1.39 | 25d | 1 | 0.66mi |
| 3702 14th St SW Lehigh Acres, FL | 4.0 | 2.0 | 1472 | $1,995 | $1.36 | 25d | 1 | 0.66mi |
| 4001 22nd St SW Lehigh Acres, FL | 3.0 | 2.0 | 1055 | $1,950 | $1.85 | 4d | 1 | 0.67mi |
| 1105 Harold Ave S Lehigh Acres, FL | 3.0 | 2.0 | 988 | $1,250 | $1.27 | 25d | 1 | 0.67mi |
| 3705 9th St SW Lehigh Acres, FL | 3.0 | 2.0 | 1272 | $1,695 | $1.33 | 16d | 1 | 0.69mi |
| 4203 23rd St SW Lehigh Acres, FL | 4.0 | 2.0 | 1833 | $1,850 | $1.01 | 21d | 1 | 0.69mi |
| 704 Gilbert Ave S Lehigh Acres, FL | 3.0 | 2.0 | 1203 | $1,475 | $1.23 | 21d | 1 | 0.69mi |
| 716 Gordon Ave S Lehigh Acres, FL | 3.0 | 2.0 | 1175 | $1,595 | $1.36 | 5d | 1 | 0.71mi |
| 1113 Harry Ave S Lehigh Acres, FL | 2.0 | 2.0 | 1180 | $1,646 | $1.39 | 5d | 1 | 0.72mi |
| 4307 2nd St SW Lehigh Acres, FL | 4.0 | 2.0 | 1843 | $2,191 | $1.19 | 5d | 1 | 0.73mi |
| 745 Harry Ave S Lehigh Acres, FL | 3.0 | 2.0 | 1200 | $1,699 | $1.42 | 12d | 1 | 0.74mi |
| 1578 Gretchen Ave S Lehigh Acres, FL | 3.0 | 2.0 | 1728 | $2,000 | $1.16 | 25d | 1 | 0.74mi |
| 729 Harry Ave S Lehigh Acres, FL | 3.0 | 2.0 | 1125 | $1,500 | $1.33 | 25d | 1 | 0.76mi |
| 1509 Haviland Ave S Lehigh Acres, FL | 3.0 | 2.0 | 1200 | $1,550 | $1.29 | 25d | 1 | 0.77mi |
| 1511 Haviland Ave S Lehigh Acres, FL | 3.0 | 2.0 | 1200 | $1,550 | $1.29 | 25d | 1 | 0.77mi |
| 3704 6th St SW Lehigh Acres, FL | 3.0 | 2.0 | 1100 | $1,575 | $1.43 | 21d | 1 | 0.79mi |
| 4507 20th St SW Lehigh Acres, FL | 2.0 | 2.0 | 1135 | $1,400 | $1.23 | 25d | 1 | 0.79mi |
| 4401 22nd St SW Lehigh Acres, FL | 3.0 | 2.0 | 1109 | $1,345 | $1.21 | 25d | 1 | 0.82mi |
| 1110 Hightower Ave S Lehigh Acres, FL | 3.0 | 2.0 | 1227 | $1,325 | $1.08 | 25d | 1 | 0.83mi |
| 310 Gordon Ave S Lehigh Acres, FL | 2.0 | 2.0 | 1166 | $1,599 | $1.37 | 5d | 1 | 0.87mi |
| 310 Gordon Ave S Lehigh Acres, FL | 2.0 | 2.0 | 1166 | $1,599 | $1.37 | 25d | 1 | 0.87mi |
| 4541 20th St SW Lehigh Acres, FL | 2.0 | 1.0 | 924 | $1,195 | $1.29 | 25d | 1 | 0.87mi |
| 3615 6th St SW Lehigh Acres, FL | 3.0 | 2.0 | 1378 | $1,825 | $1.32 | 25d | 1 | 0.88mi |
| 305 Harold Ave S Lehigh Acres, FL | 3.0 | 2.0 | 1175 | $1,650 | $1.40 | 18d | 1 | 0.90mi |
| 4543 21st St SW Lehigh Acres, FL | 3.0 | 2.0 | 1228 | $1,600 | $1.30 | 5d | 1 | 0.91mi |
| 4543 21st St SW Lehigh Acres, FL | 3.0 | 2.0 | 1228 | $1,600 | $1.30 | 5d | 1 | 0.91mi |
| 4523 22nd St SW Lehigh Acres, FL | 3.0 | 2.0 | 1125 | $1,700 | $1.51 | 25d | 1 | 0.91mi |
| 4545 21st St SW Lehigh Acres, FL | 3.0 | 2.0 | 1200 | $1,500 | $1.25 | 25d | 1 | 0.92mi |
Listing history 41 events
-
2026-06-22days on market $279,000 Active 89 DOM
-
2026-06-17days on market $279,000 Active 85 DOM
-
2026-06-16days on market $279,000 Active 84 DOM
-
2026-06-16days on market $279,000 Active 83 DOM
-
2026-06-15days on market $279,000 Active 81 DOM
-
2026-06-13days on market $279,000 Active 79 DOM
-
2026-06-10days on market $279,000 Active 76 DOM
-
2026-06-09days on market $279,000 Active 75 DOM
-
2026-06-07days on market $279,000 Active 73 DOM
-
2026-06-03days on market $279,000 Active 69 DOM
-
2026-06-02days on market $279,000 Active 68 DOM
-
2026-06-01days on market $279,000 Active 67 DOM
-
2026-06-01days on market $279,000 Active 66 DOM
-
2026-05-19price $279,000
-
2026-05-18price $279,000 1252-char remark
Show marketing remark (1252 chars)
Price Improvement! Seller looking at all offers. Conveniently located in the heart of Lehigh Acres with quick access to shopping, dining, and daily essentials. This home offers fantastic value for the savvy buyer seeking a well-cared-for home in a rapidly growing and stable area. This beautifully maintained 3-bedroom, 2-bath home sits on a spacious 0.25-acre lot, showcasing a split-bedroom floor plan for privacy and functionality. The master suite features a walk-in closet and private bath. You’ll appreciate the open-concept layout and ample feel of its vaulted ceilings. This well-designed home offers a centrally located kitchen that includes a large island with direct sightlines to the Great- room. Sliding glass doors in the dining area lead you out to the screened-in, covered lanai perfect for enjoying a relaxing evening breeze. The spacious backyard is sure to entertain, with plenty room for pets, playground and a pool! This home has been freshly painted inside and out and cleverly color coordinated, including a fully painted garage with a coated epoxy floor. Major newer updates include roof, HVAC system, water heater, and water softener for improved water quality. And, as an added bonus, there are no water or HOA expenses!
-
2026-05-14price $283,000
-
2026-05-13price $283,000 1252-char remark
Show marketing remark (1252 chars)
Price Improvement! Seller looking at all offers. Conveniently located in the heart of Lehigh Acres with quick access to shopping, dining, and daily essentials. This home offers fantastic value for the savvy buyer seeking a well-cared-for home in a rapidly growing and stable area. This beautifully maintained 3-bedroom, 2-bath home sits on a spacious 0.25-acre lot, showcasing a split-bedroom floor plan for privacy and functionality. The master suite features a walk-in closet and private bath. You’ll appreciate the open-concept layout and ample feel of its vaulted ceilings. This well-designed home offers a centrally located kitchen that includes a large island with direct sightlines to the Great- room. Sliding glass doors in the dining area lead you out to the screened-in, covered lanai perfect for enjoying a relaxing evening breeze. The spacious backyard is sure to entertain, with plenty room for pets, playground and a pool! This home has been freshly painted inside and out and cleverly color coordinated, including a fully painted garage with a coated epoxy floor. Major newer updates include roof, HVAC system, water heater, and water softener for improved water quality. And, as an added bonus, there are no water or HOA expenses!
-
2026-03-21$284,000 Active
Show marketing remark (1252 chars)
Price Improvement! Seller looking at all offers. Conveniently located in the heart of Lehigh Acres with quick access to shopping, dining, and daily essentials. This home offers fantastic value for the savvy buyer seeking a well-cared-for home in a rapidly growing and stable area. This beautifully maintained 3-bedroom, 2-bath home sits on a spacious 0.25-acre lot, showcasing a split-bedroom floor plan for privacy and functionality. The master suite features a walk-in closet and private bath. You’ll appreciate the open-concept layout and ample feel of its vaulted ceilings. This well-designed home offers a centrally located kitchen that includes a large island with direct sightlines to the Great- room. Sliding glass doors in the dining area lead you out to the screened-in, covered lanai perfect for enjoying a relaxing evening breeze. The spacious backyard is sure to entertain, with plenty room for pets, playground and a pool! This home has been freshly painted inside and out and cleverly color coordinated, including a fully painted garage with a coated epoxy floor. Major newer updates include roof, HVAC system, water heater, and water softener for improved water quality. And, as an added bonus, there are no water or HOA expenses!
-
2026-03-21$284,000 Active 1252-char remark
Show marketing remark (1252 chars)
Price Improvement! Seller looking at all offers. Conveniently located in the heart of Lehigh Acres with quick access to shopping, dining, and daily essentials. This home offers fantastic value for the savvy buyer seeking a well-cared-for home in a rapidly growing and stable area. This beautifully maintained 3-bedroom, 2-bath home sits on a spacious 0.25-acre lot, showcasing a split-bedroom floor plan for privacy and functionality. The master suite features a walk-in closet and private bath. You’ll appreciate the open-concept layout and ample feel of its vaulted ceilings. This well-designed home offers a centrally located kitchen that includes a large island with direct sightlines to the Great- room. Sliding glass doors in the dining area lead you out to the screened-in, covered lanai perfect for enjoying a relaxing evening breeze. The spacious backyard is sure to entertain, with plenty room for pets, playground and a pool! This home has been freshly painted inside and out and cleverly color coordinated, including a fully painted garage with a coated epoxy floor. Major newer updates include roof, HVAC system, water heater, and water softener for improved water quality. And, as an added bonus, there are no water or HOA expenses!
-
2025-11-01$293,000 Active
-
2025-09-01historical $2,000
-
2025-07-31$2,000
-
2025-07-26historical $1,975
-
2025-06-25$1,975
-
2025-06-14historical $1,975
-
2025-05-24price $1,975
-
2025-05-13$2,075
-
2025-05-01historical $2,175
-
2025-04-30price $2,175
-
2025-04-14historical $2,250
-
2025-04-13$2,250
-
2025-04-11price $2,250
-
2025-04-02price $1,900
-
2025-03-28$2,250
-
2023-11-22historical $2,250
-
2023-10-29$2,250
-
2023-10-23historical $2,250
-
2023-09-03$2,000
-
2010-08-02price $55,595
-
2010-07-27soldstatus $48,000
-
2010-07-19soldstatus $48,000
ⓘ Source: listings_history table (triggers on properties + properties_extension) + one-shot
backfill from property_details.listing_events for pre-trigger history.
Tax reassessment forecast FL · Resets to sale price
- Current annual tax
- $3,148 · $262/mo
- Projected year-2 tax
- $3,148 · $262/mo
- Expected delta
- $0/yr ($0/mo · 0.0%)
ⓘ Screening estimate from a state-policy table — verify with the county assessor before closing.
Climate risk First Street
- Flood 1/10 Low FEMA zone X (unshaded) · 0% chance over 30 yrs
- Wildfire 3/10 Moderate
- Heat 10/10 Extreme 7 d/yr ≥107°F today · 30 d/yr by 30 yrs out
- Wind 10/10 Extreme 99% chance of damaging wind over 30 yrs
- Air quality 2/10 Low 1 unhealthy d/yr today · 1 by 30 yrs out
Nearby sold comps map
Loading sold comps map…
Walkable amenities ~0.75 mi
Loading nearby amenities…
Taxation est. · year 1
- Rental income
- $23,200
- − Mortgage interest
- −$15,628
- − Property taxes
- −$3,148
- − Insurance
- −$1,395
- − Repairs & maintenance
- −$1,856
- − Management
- −$1,856
- − Depreciation
- −$8,116
- Taxable loss
- −$8,800
- Est. tax savings @ 24.0%
- +$2,112
- After-tax cash flow
- $-1,661/yr
For passive investors: Depreciation is non-cash, so a rental often shows a tax loss while cash-flowing — sheltering income. Rental losses are passive: they offset passive income freely, and up to $25,000/yr can offset ordinary (W-2) income if you actively participate and your MAGI is under $100k (phasing out to $0 by $150k); unused losses carry forward. On sale, claimed depreciation is recaptured at up to 25%, and gains may owe capital-gains tax (a 1031 exchange can defer both). Figures are a year-1 estimate at your 24.0% rate — not tax advice; consult a CPA.
Schools (NCES district)
- District
- Lee
- NCES district ID
- 1201080
- Math proficiency
- 47% ▼ -11.00%
- Reading proficiency
- 50% ▼ -4.00%
- Median HH income
- $49,518
- Composite
- 41.49/100
- National rank
- #3458
- State rank
- #42 of 73 in FL
Livability — Lehigh Acres
- Score
- 59/100
- State rank
- #826
- US rank
- #20055
Category grades
Schools grade is shown separately in the Schools card above.
Census & demographics
- Census place
- Lehigh Acres, FL
- County
- Lee County · 788,662 people
- City population
- 130,638
- Metro
- Cape Coral-Fort Myers, FL
- Population (ZIP)
- 20,277
- Household income
- $72,679
- Rent vs Own
- Severe rent burden
- 574.0
Population outlook (Lee County) Hauer SSP2
- Today (2025)
- 871,946 people
- By 2030
- 955,468 · +9.6%
- By 2040
- 1,113,587 · +27.7%
- By 2050
- 1,256,891 · +44.1%
- By 2075
- 1,560,270 · +78.9%
- By 2100
- 1,726,848 · +98.0%
Race, ethnicity, and origin ACS 2023
- Neighborhood character
- Diverse neighborhood (Simpson 0.65)
- Race & ethnicity
- Hispanic / Latino 50% Two or more races 30% White 24% Black 20% Asian 3%
- Hispanic origin (detail)
- Mexican 8% Puerto Rican 8% Cuban 18% Dominican 4%
- Common ancestry
- Hispanic 8% Slovak 1% Lithuanian 1%
- Foreign-born
- 35% · Canada, Jamaica, Vietnam
- Languages at home
- 46% English-only · Spanish 43% French/Haitian/Cajun 8% Vietnamese 1%
Political lean MEDSL · Lee
- 2024 margin
- Strong R (+28.4) · D 35.5% · R 63.9%
- 2008→2024 swing
- -18.0pp toward R · 2008: -10.4pp · 2024: -28.4pp
- All cycles
- 2024: R+28.4 2020: R+19.2 2016: R+20.4 2012: R+16.6 2008: R+10.4
Not yet ingested
- Civics
- —
Market trends
- HPI YoY
- ▲ 21.77%
- Current HPI
- 340.4255
- Rent YoY
- ▼ -1.54%
- Metro
- Cape Coral-Fort Myers, FL
- State GDP YoY
- ▲ 3.28%
- F500 in state
- 36
Industry mix (Fortune 500 HQ in FL)
| Industry | F500 HQs | Revenue |
|---|---|---|
| Industrial Technology | 2 | $29B |
|
||
| Insurance | 2 | $17B |
|
||
| Retail | 1 | $60B |
|
||
| Technology Distribution | 1 | $58B |
|
||
| Homebuilding | 1 | $35B |
|
||
| Technology Manufacturing | 1 | $35B |
|
||
Price history
+481.2% since first listed28 events — show timeline
- 2026-05-19 Price Changed $279,000 MARMLS
- 2026-05-18 Price Changed $279,000 FORTMLS
- 2026-05-14 Price Changed $283,000 MARMLS
- 2026-05-13 Price Changed $283,000 FORTMLS
- 2026-03-21 Listed $284,000 FORTMLS
- 2026-03-21 Listed $284,000 MARMLS
- 2025-11-01 Listed $293,000 BEARMLS
- 2025-09-01 Rental Removed $2,000 Avail
- 2025-07-31 Listed for Rent $2,000 Avail
- 2025-07-26 Rental Removed $1,975 Avail
- 2025-06-25 Listed for Rent $1,975 Avail
- 2025-06-14 Rental Removed $1,975 Avail
- 2025-05-24 Price Changed $1,975 Avail
- 2025-05-13 Listed for Rent $2,075 Avail
- 2025-05-01 Rental Removed $2,175 RENT.
- 2025-04-30 Price Changed $2,175 RENT.
- 2025-04-14 Rental Removed $2,250 Avail
- 2025-04-13 Listed for Rent $2,250 RENT.
- 2025-04-11 Price Changed $2,250 Avail
- 2025-04-02 Price Changed $1,900 Avail
- 2025-03-28 Listed for Rent $2,250 Avail
- 2023-11-22 Rental Removed $2,250 Avail
- 2023-10-29 Listed for Rent $2,250 Avail
- 2023-10-23 Rental Removed $2,250 Avail
- 2023-09-03 Listed for Rent $2,000 Avail
- 2010-08-02 Price Changed $55,595 FORTMLS
- 2010-07-27 Sold (Public Records) $48,000 Public Records
- 2010-07-19 Sold (MLS) $48,000 FORTMLS
Property tax history
+7.6%/yrLatest (2025): $3,148 · -0.2% YoY. Source: county tax records.
Cash-flow waterfall
monthlySold comps — $/sqft
last 12 mo · ≤1 miLoading sold comps…