10631 W Lakewood Dr · Poland, IN
Flood risk 9/10 · Severe
- FEMA flood zone
- X (unshaded)
- Chance of flooding over 30 yrs
- 0.99%
- Est. flood insurance / yr
- $507 – $1,088
Fire risk 1/10 · Minimal
- Est. fire insurance / yr
- $717 – $1,331
Heat risk 3/10 · Minor
- Hot days now (above 103°F)
- 7 days/yr
- Hot days in 30 yrs
- 18 days/yr
Wind risk 2/10 · Minimal
- Chance of severe wind over 30 yrs
- 1.0%
Air-quality risk 2/10 · Minimal
- Unhealthy air days now
- 1 days/yr
- Unhealthy air days in 30 yrs
- 2 days/yr
Risk factors via First Street. Map © Google.
Why this score? — see what drove the C- grade
The composite is a weighted blend of 9 inputs, each scored 0–100. Each bar is that input's sub-score; the figure is the points it added to the 100-point composite (weight × sub-score).
- Cash flow +15.0/30.0
- Appreciation +10.0/10.0
- ARV discount +7.5/15.0
- 1% rule +5.0/10.0
- DSCR +5.0/10.0
- Schools +3.2/10.0
- Rent growth +2.5/5.0
- Livability +2.5/5.0
- Condition / age +2.5/5.0
$12,000
🖨 Deal sheet 📄 Offer letter ✓ Due diligence
Listing remarks MLS
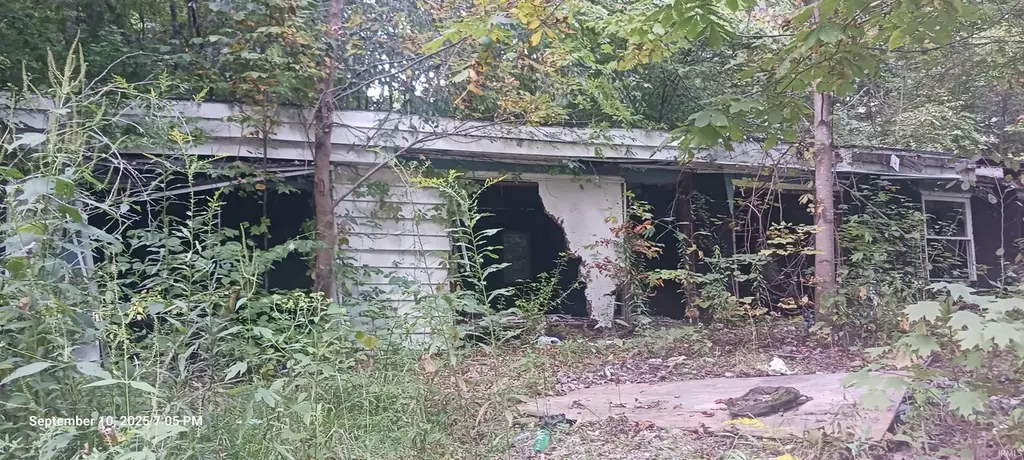
Concrete floors, Great start for you to rebuild as you desire.
Key facts
- 0.26 acre lot
- Built 1971
- Listed 117 days
Neighborhood map
What this means for you Summary
Snapshot
- This is a 1-bed/1.0-bath single-family listed at $12k.
Deal economics
- At list price, monthly cash flow is $463 ($6k/yr) — positive.
- The deal already cash-flows at list — no discount required.
- Meets the 1% rule at list price ($780 rent vs $12k).
- Recommended offer: $11k (9.0% below list) — sets the bar for market timing.
Location & tenants
- Location reads: area grade C — affects rentability + tenant quality, not the cash-flow math above.
- Cloverdale Community Schools (rural): math 36% / reading 40% proficiency, ranked #167 of 301 in IN (top 56%) — families likely to look elsewhere, expect single-tenant / working-renter base with shorter leases.
- Market conditions: 29 active listings in the ZIP; 120 units permitted in Owen County in 2024 (0 in 5+ unit buildings).
Forward outlook
- In year one you build about $1k of equity ($83 loan paydown + $1k appreciation (10.0% local appreciation)).
- Owen County population projected at -30% by 2050 — secular population decline; favor cash flow + early exit over multi-decade hold.
- At projected returns (10.0% appreciation + 3.0% rent growth), your $3k cash investment doubles in ~1 year — after that, you're playing with house money.
Negotiation context
- It's been on market 117 days — a 9% lower offer ($11k) is reasonable based on typical stale-listing flexibility.
Risks & watch-outs
- Watch-outs: flood insurance adds $66/mo.
- Climate carrying-cost: severe flood risk — expect insurance premiums to compound above CPI over the hold.
Questions for the listing agent
- It's been on market 117 days. Have you received any prior offers? Is the seller open to a 9% concession, seller financing, or rate buy-down credit?
- Built in 1971 — when were the roof, HVAC, electrical panel, plumbing, and water heater last replaced?
- What's the actual annual flood-insurance premium (NFIP or private), and is the property in a SFHA with mandatory coverage?
- Why hasn't it sold? Are there any deal-killer items the seller is aware of (foundation, flood, title, zoning, code violations)?
- Is there a deadline driving the sale (1031 exchange, divorce, estate, relocation)? That informs how much negotiation room exists.
- What's the average days-on-market for RENTAL listings here right now (not sales)? A rising rental-DOM trend means longer vacancies and softer asking-rent achievability than the comps imply.
- What's the recent tenant-quality profile in this submarket — average credit score on applications, eviction rate, late-payment / NSF rate, and stable-employment percentage? A property-management company in the area should have these aggregated.
- How much new for-sale + rental construction is in the pipeline within 1–3 miles? Heavy new supply typically softens prices + rents 12–24 months out; constrained supply supports both.
Investment metrics
- 1% rule
- 6.50% ✓
- Cap rate
- 59.27%
- Cash-on-cash
- 189.19%
- DSCR
- 9.42
- GRM
- 1.3
CMA / ARV
- ARV (median comp)
- $69,938
- List price
- $12,000
- Delta
- -82.84%
- Verdict
- UNDERPRICED
- Comps
- 2 within 2.0 mi
Projected returns pro-forma
10.0% appreciation · 3.0% rent growth · sell at horizon
- IRR
- —
- Equity multiple
- 11.74×
- Total profit
- $36,096
- Equity at exit
- $10,811
- IRR
- —
- Equity multiple
- 25.76×
- Total profit
- $83,202
- Equity at exit
- $23,313
Cash invested: $3,360 (down + closing). Projections, not guarantees.
Landlord ↔ Tenant lean methodology
- Overall (STATE)
- 90 Strongly Landlord-Friendly
- State Indiana
- 90 Strongly Landlord-Friendly · R+11
- County
- — inherits STATE
- City
- — inherits STATE
ZIP-level market 47868
- Home prices YoY
- 9.8%
- Active inventory
- 29
- Price-to-rent
- 1.3×
Monthly cashflow live
- Estimated rent
- $780 medium interval (Pro) →
- Mortgage (P&I)
- −$63
- Tax from tax record
- −$18 /mo · $218/yr
- Insurance
- −$5
- Flood insurance flood zone
- −$66 /mo · $798/yr
- HOA
- −$0
- Vacancy / Maint / Mgmt
- −$164
- Net cashflow
- $463
Break-even live
UW: 25.0% down · 7.5% · 30yr · 1.5% tax · 5.0% vac · 8.0% maint · 8.0% mgmt
Financing live
Cash to close
- Down payment
- $3,000
- Closing costs
- $360
- Reserves months
- —
- Total cash needed
- —
Loan-product check · same deal, 3 products live
Conventional
25% down · 7.5% · 30yr
- Down + closing
- —
- Monthly P&I
- —
- Monthly cashflow
- —
- DSCR
- —
- Eligible?
- —
Personal DTI + credit; lowest rate.
DSCR
20% down · 8.5% · 30yr
- Down + closing
- —
- Monthly P&I
- —
- Monthly cashflow
- —
- DSCR
- —
- Eligible?
- —
No personal income docs; deal must DSCR.
Hard money
10% down · 12.0% · 12mo
- Down + closing
- —
- Monthly P&I
- —
- Monthly cashflow
- —
- DSCR
- —
- Eligible?
- —
Short-term bridge; refi at stabilization.
Listing history 13 events
-
2026-06-18days on market $12,000 Active 117 DOM
-
2026-06-17days on market $12,000 Active 116 DOM
-
2026-06-16days on market $12,000 Active 115 DOM
-
2026-06-15days on market $12,000 Active 114 DOM
-
2026-06-13days on market $12,000 Active 112 DOM
-
2026-06-09days on market $12,000 Active 108 DOM
-
2026-06-08days on market $12,000 Active 107 DOM
-
2026-06-07days on market $12,000 Active 106 DOM
-
2026-06-03days on market $12,000 Active 102 DOM
-
2026-06-02days on market $12,000 Active 101 DOM
-
2026-06-01days on market $12,000 Active 100 DOM
-
2026-05-31days on market $12,000 Active 99 DOM
-
2026-02-22$12,000 Active 62-char remark
Show marketing remark (62 chars)
Concrete floors, Great start for you to rebuild as you desire.
ⓘ Source: listings_history table (triggers on properties + properties_extension) + one-shot
backfill from property_details.listing_events for pre-trigger history.
Tax reassessment forecast IN · Partial reset (capped growth)
- Current annual tax
- $218 · $18/mo
- Projected year-2 tax
- $218 · $18/mo
- Expected delta
- $0/yr ($0/mo · 0.0%)
ⓘ Screening estimate from a state-policy table — verify with the county assessor before closing.
Climate risk First Street
- Flood 9/10 Extreme FEMA zone X (unshaded) · 99% chance over 30 yrs
- Wildfire 1/10 Low
- Heat 3/10 Moderate 7 d/yr ≥103°F today · 18 d/yr by 30 yrs out
- Wind 2/10 Low 100% chance of damaging wind over 30 yrs
- Air quality 2/10 Low 1 unhealthy d/yr today · 2 by 30 yrs out
Nearby sold comps map
Loading sold comps map…
Walkable amenities ~0.75 mi
Loading nearby amenities…
Taxation est. · year 1
- Rental income
- $9,354
- − Mortgage interest
- −$672
- − Property taxes
- −$218
- − Insurance
- −$858
- − Repairs & maintenance
- −$748
- − Management
- −$748
- − Depreciation
- −$349
- Taxable income
- $5,761
- Est. tax owed @ 24.0%
- −$1,383
- After-tax cash flow
- $4,177/yr
For passive investors: Depreciation is non-cash, so a rental often shows a tax loss while cash-flowing — sheltering income. Rental losses are passive: they offset passive income freely, and up to $25,000/yr can offset ordinary (W-2) income if you actively participate and your MAGI is under $100k (phasing out to $0 by $150k); unused losses carry forward. On sale, claimed depreciation is recaptured at up to 25%, and gains may owe capital-gains tax (a 1031 exchange can defer both). Figures are a year-1 estimate at your 24.0% rate — not tax advice; consult a CPA.
Schools (NCES district)
- District
- Cloverdale Community Schools
- NCES district ID
- 1802220
- Math proficiency
- 36% ▼ -16.00%
- Reading proficiency
- 40% ▼ -14.00%
- Median HH income
- $44,267
- Composite
- 32.28/100
- National rank
- #5753
- State rank
- #167 of 301 in IN
Livability — Poland
No livability data for this city. (Only ~50 U.S. cities are tracked.)
Census & demographics
- Population (ZIP)
- 2,870
Population outlook (Owen County) Hauer SSP2
- Today (2025)
- 19,045 people
- By 2030
- 17,930 · -5.9%
- By 2040
- 15,507 · -18.6%
- By 2050
- 13,253 · -30.4%
- By 2075
- 9,364 · -50.8%
- By 2100
- 6,686 · -64.9%
Race, ethnicity, and origin ACS 2023
- Neighborhood character
- Predominantly White (95%)
- Race & ethnicity
- White 95% Black 3% Two or more races 1%
- Common ancestry
- Iranian 2% Slovak 2% Lithuanian 1%
- Foreign-born
- 1%
- Languages at home
- 99% English-only · Tagalog/Filipino 1%
Political lean MEDSL · Owen
- 2024 margin
- Solid R (+50.7) · D 23.8% · R 74.5% · Other 1.6%
- 2008→2024 swing
- -40.3pp toward R · 2008: -10.3pp · 2024: -50.7pp
- All cycles
- 2024: R+50.7 2020: R+49.1 2016: R+49.4 2012: R+27.6 2008: R+10.3
Not yet ingested
- Civics
- —
Market trends
- HPI YoY
- ▲ 21.99%
- Current HPI
- 246.3509
- Rent YoY
- —
- Metro
- —
- State GDP YoY
- ▲ 2.90%
- F500 in state
- 18
Industry mix (Fortune 500 HQ in IN)
| Industry | F500 HQs | Revenue |
|---|---|---|
| Industrial Machinery | 2 | $37B |
|
||
| Healthcare | 1 | $177B |
|
||
| Pharmaceuticals | 1 | $45B |
|
||
| Metals / Steel | 1 | $18B |
|
||
| Agriculture | 1 | $17B |
|
||
| Packaging | 1 | $12B |
|
||
Price history
1 event — show timeline
- 2026-02-22 Listed $12,000 IRMLS
Property tax history
-7.5%/yrLatest (2024): $218 · -11.3% YoY. Source: county tax records.
Cash-flow waterfall
monthlySold comps — $/sqft
last 12 mo · ≤1 miLoading sold comps…