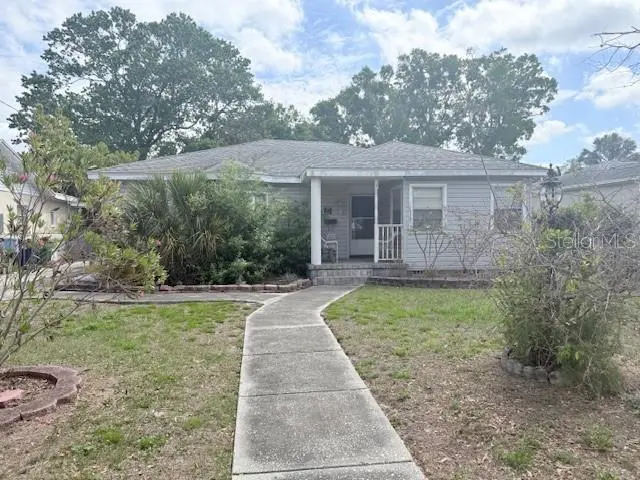
212 S Bradford Ave · Tampa, FL
Flood risk 1/10 · Minimal
- FEMA flood zone
- X (unshaded)
- Chance of flooding over 30 yrs
- 0.0%
- Est. flood insurance / yr
- $507 – $1,088
Fire risk 1/10 · Minimal
- Est. fire insurance / yr
- $947 – $1,759
Heat risk 10/10 · Severe
- Hot days now (above 107°F)
- 7 days/yr
- Hot days in 30 yrs
- 28 days/yr
Wind risk 9/10 · Severe
- Chance of severe wind over 30 yrs
- 99.0%
Air-quality risk 4/10 · Minor
- Unhealthy air days now
- 4 days/yr
- Unhealthy air days in 30 yrs
- 4 days/yr
Risk factors via First Street. Map © Google.
Why this score? — see what drove the D grade
The composite is a weighted blend of 9 inputs, each scored 0–100. Each bar is that input's sub-score; the figure is the points it added to the 100-point composite (weight × sub-score).
- Cash flow +14.0/30.0
- ARV discount +7.5/15.0
- DSCR +4.3/10.0
- Schools +4.2/10.0
- Livability +4.0/5.0
- 1% rule +2.9/10.0
- Condition / age +2.5/5.0
- Rent growth +2.4/5.0
- Appreciation +0.0/10.0
$575,000
🖨 Deal sheet 📄 Offer letter ✓ Due diligence
Listing remarks
Under contract-accepting backup offers. Builders! Investors! South Tampa 4br/3ba home on a 60 x 138' ft Lot. No tree issues. No rear neighbor directly in the back. Sold As Is, Cash Only. Spacious 4 bedroom home with original hardwood floors, huge living room, dining area off the kitchen. Spacious eat-in kitchen with tons of cabinets, 2 sinks, double ovens. Large family room in the back with french doors leading out to the big backyard. Huge Shed. Carport. No rear neighbor directly in the back. School district: Mitchell Elem, Wilson Middle & Plant High. Close to Hyde Park, Downtown, Midtown, & more!
Key facts
- Huge living room
- Tons of cabinets
- Double ovens
Tags
Neighborhood map
What this means for you Summary
Snapshot
- This is a 4-bed/3.0-bath single-family listed at $575k.
Deal economics
- At list price, monthly cash flow is $76 ($913/yr) — positive.
- The deal already cash-flows at list — no discount required.
- To meet the 1% rule (rent ≥ 1% of price), the offer needs to be $452k (21.4% below list).
- Recommended offer: $452k (21.4% below list) — sets the bar for 1% rule.
Location & tenants
- Location reads 79/100 on livability (#142 in FL, #2,135 nationally) — a middle-class / working-renter tenant base. Strengths: commute A+, housing A+, health & safety A+; Watch: schools C-, crime D+.
- Hillsborough (suburban): math 47% / reading 50% proficiency, ranked #41 of 73 in FL (top 56%) — families likely to look elsewhere, expect single-tenant / working-renter base with shorter leases.
- Market conditions: Rents soft (-0.5%/yr); 253 active listings in the ZIP; 40 comparable units currently listed for rent nearby; rentals at typical pace (median 18d on market — plan ~3-4 weeks tenant-placement turnaround); high-income renter base; 9,053 units permitted in Hillsborough County in 2024 (4,555 in 5+ unit buildings).
- At $4,517/mo this rent would consume 47% of the median local household income ($116k/yr) (locally 661% of renters already pay >50% of income on rent) — very limited rent-growth headroom before tenants either downsize or default.
Forward outlook
- Local home prices are declining (-3.0%/yr); year-one equity from $4k of loan paydown is wiped out by about $17k of value loss. Plan a longer hold.
- Hillsborough County population projected at +37% by 2050 — long-run rental-demand tailwind backs the buy-and-hold thesis.
Negotiation context
- Only 6 days on market — expect competitive offers; lowballing is unlikely to land.
- Current owner paid $73k; list at $575k implies a 688% gain — meaningful room to come down on a strong offer.
Risks & watch-outs
- Watch-outs: built in 1947 — expect roof / HVAC / electrical / plumbing capex.
- Climate carrying-cost: severe wind risk, 99% chance of damaging wind over 30y; extreme-heat days projected 7→28/yr by 2055 (HVAC capex compounding) — expect insurance premiums to compound above CPI over the hold.
Questions for the listing agent
- Built in 1947 — when were the roof, HVAC, electrical panel, plumbing, and water heater last replaced?
- Is there a deadline driving the sale (1031 exchange, divorce, estate, relocation)? That informs how much negotiation room exists.
- Crime grade is D in this area — have there been break-ins, vandalism, or insurance claims at this property in the last 3 years? What carrier currently insures it and at what premium?
- The area grade is low — what's the realistic commute time and amenity access for the typical tenant pool here? Any planned neighborhood developments (good or bad) we should know about?
- What's the average days-on-market for RENTAL listings here right now (not sales)? A rising rental-DOM trend means longer vacancies and softer asking-rent achievability than the comps imply.
- What's the recent tenant-quality profile in this submarket — average credit score on applications, eviction rate, late-payment / NSF rate, and stable-employment percentage? A property-management company in the area should have these aggregated.
- How much new for-sale + rental construction is in the pipeline within 1–3 miles? Heavy new supply typically softens prices + rents 12–24 months out; constrained supply supports both.
Investment metrics
- 1% rule
- 0.79% ✗
- Cap rate
- 6.45%
- Cash-on-cash
- 0.57%
- DSCR
- 1.03
- GRM
- 10.6
CMA / ARV
No comps found within radius.
Projected returns pro-forma
-3.0% appreciation · 0.0% rent growth · sell at horizon
- IRR
- -18.5%
- Equity multiple
- 0.37×
- Total profit
- $-101,795
- Equity at exit
- $85,734
- IRR
- -17.3%
- Equity multiple
- 0.16×
- Total profit
- $-134,488
- Equity at exit
- $49,715
Cash invested: $161,000 (down + closing). Projections, not guarantees.
Landlord ↔ Tenant lean methodology
- Overall (STATE)
- 87 Strongly Landlord-Friendly
- State Florida
- 87 Strongly Landlord-Friendly · R+3
- County
- — inherits STATE
- City
- — inherits STATE
ZIP-level market 33609
- Rents YoY
- -0.5%
- Active inventory
- 253
- Price-to-rent
- 10.6×
Monthly cashflow live
- Estimated rent
- $4,517 high interval (Pro) →
- Mortgage (P&I)
- −$3,015
- Tax from tax record
- −$238 /mo · $2,852/yr
- Insurance
- −$240
- HOA
- −$0
- Vacancy / Maint / Mgmt
- −$949
- Net cashflow
- $76
Break-even live
UW: 25.0% down · 7.5% · 30yr · 1.5% tax · 5.0% vac · 8.0% maint · 8.0% mgmt
Financing live
Cash to close
- Down payment
- $143,750
- Closing costs
- $17,250
- Reserves months
- —
- Total cash needed
- —
Loan-product check · same deal, 3 products live
Conventional
25% down · 7.5% · 30yr
- Down + closing
- —
- Monthly P&I
- —
- Monthly cashflow
- —
- DSCR
- —
- Eligible?
- —
Personal DTI + credit; lowest rate.
DSCR
20% down · 8.5% · 30yr
- Down + closing
- —
- Monthly P&I
- —
- Monthly cashflow
- —
- DSCR
- —
- Eligible?
- —
No personal income docs; deal must DSCR.
Hard money
10% down · 12.0% · 12mo
- Down + closing
- —
- Monthly P&I
- —
- Monthly cashflow
- —
- DSCR
- —
- Eligible?
- —
Short-term bridge; refi at stabilization.
Rent comps 40 comps
| Address | Beds | Baths | Sqft | Rent | $/sqft | DOM | Units | Dist |
|---|---|---|---|---|---|---|---|---|
| 3126 W Azeele St #1 Tampa, FL | 4.0 | 3.5 | 2262 | $4,750 | $2.10 | 5d | 1 | 0.09mi |
| 3120 W Azeele St Tampa, FL | 4.0 | 4.0 | 2274 | $5,500 | $2.42 | 3d | 1 | 0.09mi |
| 3120 W Azeele St #1 Tampa, FL | 4.0 | 3.5 | 2274 | $5,500 | $2.42 | 16d | 1 | 0.12mi |
| 3227 W Horatio St Tampa, FL | 3.0 | 4.0 | 2022 | $4,500 | $2.23 | 5d | 1 | 0.15mi |
| 210 S New Jersey Ave Unit A Tampa, FL | 3.0 | 2.5 | 1888 | $3,600 | $1.91 | 24d | 1 | 0.25mi |
| 606 S Lincoln Ave #3 Tampa, FL | 4.0 | 2.5 | 2564 | $5,000 | $1.95 | 5d | 1 | 0.27mi |
| 3015 W North B St Tampa, FL | 3.0 | 2.0 | 1469 | $3,495 | $2.38 | 5d | 1 | 0.41mi |
| 2706 W Horatio St Tampa, FL | 3.0 | 2.5 | 2116 | $4,400 | $2.08 | 18d | 1 | 0.47mi |
| 3005 W Gray St Tampa, FL | 3.0 | 2.0 | 1428 | $3,860 | $2.70 | 24d | 1 | 0.53mi |
| 3301 W Morrison Ave Tampa, FL | 3.0 | 4.0 | 2580 | $8,900 | $3.45 | 5d | 1 | 0.55mi |
| 2601 W Cleveland St Tampa, FL | 3.0 | 1.0 | 1551 | $3,100 | $2.00 | 24d | 1 | 0.56mi |
| 204 S Audubon Ave Tampa, FL | 4.0 | 3.0 | 2300 | $6,250 | $2.72 | 3d | 1 | 0.56mi |
| 204 S Audubon Ave Unit NA Tampa, FL | 4.0 | 3.0 | 2300 | $6,250 | $2.72 | 24d | 1 | 0.56mi |
| 115 N Arrawana Ave #7 Tampa, FL | 3.0 | 2.5 | 1677 | $4,200 | $2.50 | 14d | 1 | 0.58mi |
| 115 N Arrawana Ave #7 Tampa, FL | 3.0 | 2.5 | 1671 | $4,200 | $2.51 | 24d | 1 | 0.58mi |
| 2506 W Cleveland St #9 Tampa, FL | 3.0 | 3.5 | 2314 | $5,500 | $2.38 | 24d | 1 | 0.63mi |
| 3803 W Cleveland St Tampa, FL | 3.0 | 3.5 | 1818 | $4,500 | $2.48 | 3d | 1 | 0.67mi |
| 727 N Himes Ave Tampa, FL | 3.0 | 2.5 | 1778 | $3,500 | $1.97 | 24d | 1 | 0.68mi |
| 207 S Moody Ave Unit B Tampa, FL | 3.0 | 2.5 | 2160 | $5,500 | $2.55 | 14d | 1 | 0.72mi |
| 2411 W Fig St #1 Tampa, FL | 3.0 | 2.5 | 1914 | $3,650 | $1.91 | 2d | 1 | 0.73mi |
| 2411 W Fig St #1 Tampa, FL | 3.0 | 2.5 | 1914 | $3,650 | $1.91 | 11d | 1 | 0.73mi |
| 2403 W North B St #2 Tampa, FL | 3.0 | 2.5 | 1983 | $4,200 | $2.12 | 14d | 1 | 0.74mi |
| 409 S Westland Ave #3 Tampa, FL | 3.0 | 2.5 | 1710 | $3,650 | $2.13 | 20d | 1 | 0.85mi |
| 3421 W Arch St Tampa, FL | 3.0 | 3.5 | 1547 | $3,899 | $2.52 | 5d | 1 | 0.92mi |
| 3418 W La Salle St Unit 3 Tampa, FL | 4.0 | 3.5 | 2110 | $4,995 | $2.37 | 24d | 1 | 0.93mi |
| 2007 W De Leon St Unit A Tampa, FL | 3.0 | 3.0 | 1504 | $3,795 | $2.52 | 24d | 1 | 0.96mi |
| 2208 Soho Bay Ct Tampa, FL | 3.0 | 2.5 | 1605 | $3,950 | $2.46 | 18d | 1 | 0.98mi |
| 2113 W Cass St #2 Tampa, FL | 3.0 | 2.5 | 1995 | $3,995 | $2.00 | 24d | 1 | 1.02mi |
| 4108 W Azeele St Tampa, FL | 4.0 | 2.0 | 2525 | $4,995 | $1.98 | 11d | 1 | 1.03mi |
| 4120 W North A St Unit 60 Tampa, FL | 4.0 | 3.5 | 2038 | $4,949 | $2.43 | 24d | 1 | 1.10mi |
| 107 S Packwood Ave Unit D Tampa, FL | 3.0 | 2.5 | 1674 | $3,600 | $2.15 | 24d | 1 | 1.10mi |
| 1903 W Bristol Ave #2 Tampa, FL | 3.0 | 2.0 | 1564 | $4,900 | $3.13 | 3d | 1 | 1.11mi |
| 2416 W Chicago Ave Tampa, FL | 3.0 | 2.5 | 1511 | $4,400 | $2.91 | 18d | 1 | 1.15mi |
| 1039 S Frankland Rd Tampa, FL | 3.0 | 2.0 | 1552 | $3,300 | $2.13 | 18d | 1 | 1.18mi |
| 3007 W Chestnut St Tampa, FL | 3.0 | 1.0 | 1608 | $2,000 | $1.24 | 18d | 1 | 1.20mi |
| 1412 S Moody Ave Unit A Tampa, FL | 4.0 | 4.5 | 2850 | $8,900 | $3.12 | 24d | 1 | 1.20mi |
| 4016 W Nassau St Tampa, FL | 4.0 | 2.0 | 2156 | $3,000 | $1.39 | 18d | 1 | 1.21mi |
| 2907 W Chestnut St Tampa, FL | 3.0 | 2.5 | 1780 | $2,650 | $1.49 | 5d | 1 | 1.23mi |
| 2907 W Chestnut St Tampa, FL | 3.0 | 3.0 | 1780 | $2,650 | $1.49 | 14d | 1 | 1.23mi |
| 4200 W Beachway Dr Tampa, FL | 4.0 | 3.0 | 2352 | $6,950 | $2.95 | 5d | 1 | 1.25mi |
Listing history 3 events
-
2026-04-06status Pending
-
2026-03-31$575,000 Active
-
1997-04-04soldstatus $73,000
ⓘ Source: listings_history table (triggers on properties + properties_extension) + one-shot
backfill from property_details.listing_events for pre-trigger history.
Tax reassessment forecast FL · Resets to sale price
- Current annual tax
- $2,852 · $238/mo
- Projected year-2 tax
- $4,772 · $398/mo
- Expected delta
- +$1,920/yr (+$160/mo · 67.3%)
ⓘ Screening estimate from a state-policy table — verify with the county assessor before closing.
Climate risk First Street
- Flood 1/10 Low FEMA zone X (unshaded) · 0% chance over 30 yrs
- Wildfire 1/10 Low
- Heat 10/10 Extreme 7 d/yr ≥107°F today · 28 d/yr by 30 yrs out
- Wind 9/10 Extreme 99% chance of damaging wind over 30 yrs
- Air quality 4/10 Moderate 4 unhealthy d/yr today · 4 by 30 yrs out
Nearby sold comps map
Loading sold comps map…
Walkable amenities ~0.75 mi
Loading nearby amenities…
Taxation est. · year 1
- Rental income
- $54,208
- − Mortgage interest
- −$32,209
- − Property taxes
- −$2,852
- − Insurance
- −$2,875
- − Repairs & maintenance
- −$4,337
- − Management
- −$4,337
- − Depreciation
- −$16,727
- Taxable loss
- −$9,128
- Est. tax savings @ 24.0%
- +$2,191
- After-tax cash flow
- $3,104/yr
For passive investors: Depreciation is non-cash, so a rental often shows a tax loss while cash-flowing — sheltering income. Rental losses are passive: they offset passive income freely, and up to $25,000/yr can offset ordinary (W-2) income if you actively participate and your MAGI is under $100k (phasing out to $0 by $150k); unused losses carry forward. On sale, claimed depreciation is recaptured at up to 25%, and gains may owe capital-gains tax (a 1031 exchange can defer both). Figures are a year-1 estimate at your 24.0% rate — not tax advice; consult a CPA.
Schools (NCES district)
- District
- Hillsborough
- NCES district ID
- 1200870
- Math proficiency
- 47% ▼ -8.00%
- Reading proficiency
- 50% ▼ -4.00%
- Median HH income
- $50,622
- Composite
- 41.6/100
- National rank
- #3435
- State rank
- #41 of 73 in FL
Livability — Tampa
- Score
- 79/100
- State rank
- #142
- US rank
- #2135
Category grades
Schools grade is shown separately in the Schools card above.
Census & demographics
- Census place
- Tampa, FL
- County
- Hillsborough County · 1,540,968 people
- City population
- 523,346
- Metro
- Tampa-St. Petersburg-Clearwater, FL
- Population (ZIP)
- 18,535
- Household income
- $115,844
- Rent vs Own
- Severe rent burden
- 661.0
Population outlook (Hillsborough County) Hauer SSP2
- Today (2025)
- 1,607,022 people
- By 2030
- 1,733,968 · +7.9%
- By 2040
- 1,979,565 · +23.2%
- By 2050
- 2,203,427 · +37.1%
- By 2075
- 2,667,893 · +66.0%
- By 2100
- 2,891,558 · +79.9%
Race, ethnicity, and origin ACS 2023
- Neighborhood character
- Majority White (63%)
- Race & ethnicity
- White 63% Hispanic / Latino 26% Two or more races 14% Asian 5% Black 3%
- Hispanic origin (detail)
- Mexican 2% Puerto Rican 4% Cuban 8%
- Common ancestry
- Slovak 3% Lithuanian 2% Romanian 2%
- Foreign-born
- 17% · Canada, China, Jamaica
- Languages at home
- 77% English-only · Spanish 17% Other Indo-European 2% Chinese 1%
Political lean MEDSL · Hillsborough
- 2024 margin
- Toss-up / Even · D 47.8% · R 50.9% · Other 1.3%
- 2008→2024 swing
- -10.2pp toward R · 2008: 7.1pp · 2024: -3.1pp
- All cycles
- 2024: R+3.1 2020: D+6.9 2016: D+6.8 2012: D+6.7 2008: D+7.1
Not yet ingested
- Civics
- —
Market trends
- HPI YoY
- ▼ -317.85%
- Current HPI
- 372.5939
- Rent YoY
- ▼ -0.49%
- Metro
- Tampa-St. Petersburg-Clearwater, FL
- State GDP YoY
- ▲ 3.28%
- F500 in state
- 36
Industry mix (Fortune 500 HQ in FL)
| Industry | F500 HQs | Revenue |
|---|---|---|
| Industrial Technology | 2 | $29B |
|
||
| Insurance | 2 | $17B |
|
||
| Retail | 1 | $60B |
|
||
| Technology Distribution | 1 | $58B |
|
||
| Homebuilding | 1 | $35B |
|
||
| Technology Manufacturing | 1 | $35B |
|
||
Price history
+687.7% since first listed3 events — show timeline
- 2026-04-06 Pending — Stellar MLS as Distributed by MLS Grid
- 2026-03-31 Listed $575,000 Stellar MLS as Distributed by MLS Grid
- 1997-04-04 Sold (Public Records) $73,000 Public Records
Property tax history
+2.4%/yrLatest (2025): $2,852 · +8.0% YoY. Source: county tax records.
Cash-flow waterfall
monthlySold comps — $/sqft
last 12 mo · ≤1 miLoading sold comps…