1212 W State Road 18 Rd · Roll, IN
Flood risk 1/10 · Minimal
- FEMA flood zone
- X (unshaded)
- Chance of flooding over 30 yrs
- 0.0%
- Est. flood insurance / yr
- $507 – $1,088
Fire risk 1/10 · Minimal
- Est. fire insurance / yr
- $717 – $1,331
Heat risk 3/10 · Minor
- Hot days now (above 99°F)
- 7 days/yr
- Hot days in 30 yrs
- 18 days/yr
Wind risk 2/10 · Minimal
- Chance of severe wind over 30 yrs
- 1.0%
Air-quality risk 3/10 · Minor
- Unhealthy air days now
- 2 days/yr
- Unhealthy air days in 30 yrs
- 3 days/yr
Risk factors via First Street. Map © Google.
Why this score? — see what drove the C- grade
The composite is a weighted blend of 9 inputs, each scored 0–100. Each bar is that input's sub-score; the figure is the points it added to the 100-point composite (weight × sub-score).
- Cash flow +15.0/30.0
- ARV discount +15.0/15.0
- 1% rule +5.0/10.0
- DSCR +5.0/10.0
- Schools +3.3/10.0
- Rent growth +2.5/5.0
- Livability +2.5/5.0
- Condition / age +2.5/5.0
- Appreciation +0.0/10.0
$18,900
🖨 Deal sheet 📄 Offer letter ✓ Due diligence
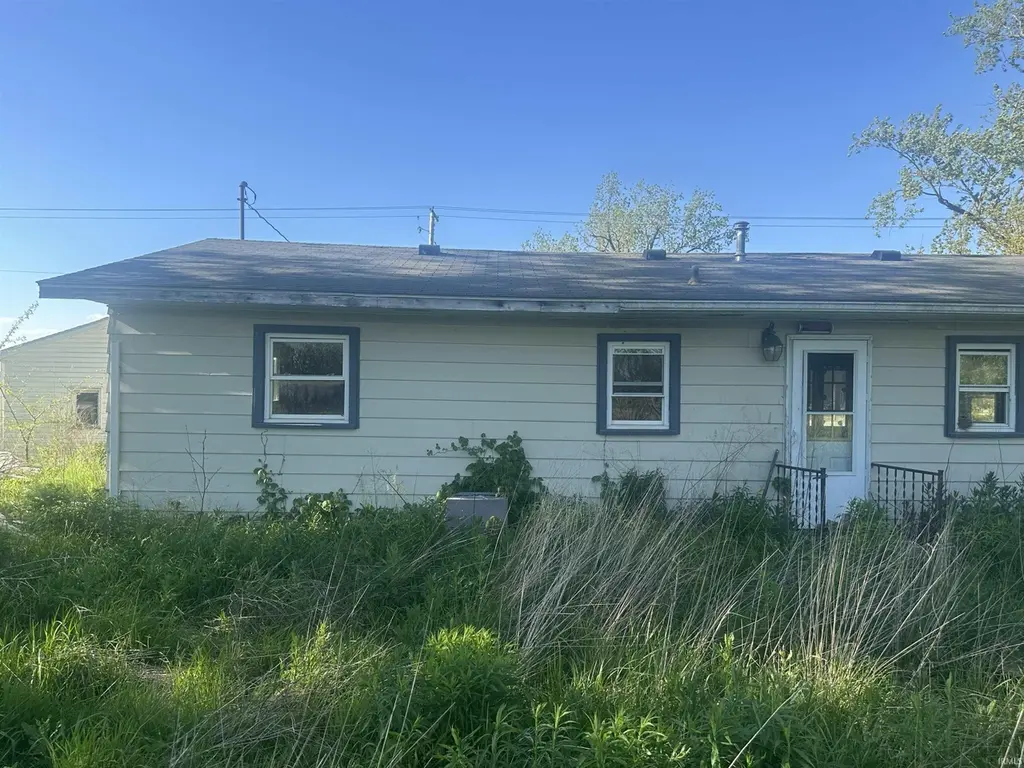
Listing remarks
House down to the studs. Beware there are holes in the floors. Enter at your own risk.
Key facts
- 0.78 acre lot
- Garage
- Built 1963
Property features AI
Exterior
- Parking: Detached 1-car garage
- Utilities: Private well water; Septic tank sewer
- Home design: Single-family residence; Site-built home; One story
- Construction: Aluminum siding
- Exterior features: Level lot
Interior
- Bedrooms: Total of 5 rooms (includes bedrooms and living spaces); Main-level laundry
- Bathrooms: One full bathroom on the main level
- Heating & cooling: No heating specified; No cooling specified
- Interior features: Crawl space basement
- Laundry & utility: Laundry located on the main level
Neighborhood map
What this means for you Summary
Snapshot
- This is a 3-bed/1.0-bath single-family listed at $19k.
Deal economics
- At list price, monthly cash flow is $677 ($8k/yr) — positive.
- The deal already cash-flows at list — no discount required.
- Meets the 1% rule at list price ($1k rent vs $19k).
Location & tenants
- Location reads: area grade C — affects rentability + tenant quality, not the cash-flow math above.
- Blackford County Schools (town): math 37% / reading 41% proficiency, ranked #164 of 301 in IN (top 54%) — families likely to look elsewhere, expect single-tenant / working-renter base with shorter leases.
- Zoned schools: Blackford Primary School (352 students, 65% FRL); Blackford Jr-Sr High School (math 25% / reading 43%, grade F, #285 of 369 statewide, top 78%, 717 students, 50% FRL).
- Market conditions: 55 active listings in the ZIP; 9 units permitted in Blackford County in 2024 (0 in 5+ unit buildings).
Forward outlook
- Local home prices are declining (-3.0%/yr); year-one equity from $131 of loan paydown is wiped out by about $567 of value loss. Plan a longer hold.
- Blackford County population projected at -27% by 2050 — secular population decline; favor cash flow + early exit over multi-decade hold.
- At projected returns (-3.0% appreciation + 3.0% rent growth), your $5k cash investment doubles in ~1 year — after that, you're playing with house money.
Negotiation context
- Only 5 days on market — expect competitive offers; lowballing is unlikely to land.
- 2 sale attempts since 10y ago with the ask held roughly flat each time — persistent listings suggest the price (not the market) is what's stuck; bring a comps-based counter.
Questions for the listing agent
- Built in 1963 — when were the roof, HVAC, electrical panel, plumbing, and water heater last replaced?
- Is there a deadline driving the sale (1031 exchange, divorce, estate, relocation)? That informs how much negotiation room exists.
- What's the average days-on-market for RENTAL listings here right now (not sales)? A rising rental-DOM trend means longer vacancies and softer asking-rent achievability than the comps imply.
- What's the recent tenant-quality profile in this submarket — average credit score on applications, eviction rate, late-payment / NSF rate, and stable-employment percentage? A property-management company in the area should have these aggregated.
- How much new for-sale + rental construction is in the pipeline within 1–3 miles? Heavy new supply typically softens prices + rents 12–24 months out; constrained supply supports both.
Investment metrics
- 1% rule
- 5.41% ✓
- Cap rate
- 49.29%
- Cash-on-cash
- 153.57%
- DSCR
- 7.83
- GRM
- 1.5
CMA / ARV
- ARV (median comp)
- $36,000
- List price
- $18,900
- Delta
- -47.50%
- Verdict
- UNDERPRICED
- Comps
- 3 within 1.0 mi
Show comp detail 2 sales within ~0.75 mi
| Address | Dist | Beds/Ba | Sqft | Sold | Price | $/sf | Match |
|---|---|---|---|---|---|---|---|
| 1212 W State Road 18 Rd | 0.00mi | 3/1.0 | 1,108 (+10%) | 1mo | $18,900 | $17 | 83 |
| 1010 W State Road 18 | 0.20mi | 2/1.0 (-1) | 888 (-12%) | 2mo | $36,000 | $41 | 64 |
Match score weights: distance 35% · size 25% · config 20% · recency 20%. Top-matched comps best support the ARV.
Projected returns pro-forma
-3.0% appreciation · 3.0% rent growth · sell at horizon
- IRR
- —
- Equity multiple
- 8.57×
- Total profit
- $40,086
- Equity at exit
- $2,818
- IRR
- —
- Equity multiple
- 18.10×
- Total profit
- $90,509
- Equity at exit
- $1,634
Cash invested: $5,292 (down + closing). Projections, not guarantees.
Landlord ↔ Tenant lean methodology
- Overall (STATE)
- 90 Strongly Landlord-Friendly
- State Indiana
- 90 Strongly Landlord-Friendly · R+11
- County
- — inherits STATE
- City
- — inherits STATE
ZIP-level market 47348
- Home prices YoY
- -17.5%
- Active inventory
- 55
- Price-to-rent
- 1.5×
Monthly cashflow live
- Estimated rent
- $1,023 medium interval (Pro) →
- Mortgage (P&I)
- −$99
- Tax est. 1.5%
- −$24 /mo · $284/yr
- Insurance
- −$8
- HOA
- −$0
- Vacancy / Maint / Mgmt
- −$215
- Net cashflow
- $677
Break-even live
UW: 25.0% down · 7.5% · 30yr · 1.5% tax · 5.0% vac · 8.0% maint · 8.0% mgmt
Financing live
Cash to close
- Down payment
- $4,725
- Closing costs
- $567
- Reserves months
- —
- Total cash needed
- —
Loan-product check · same deal, 3 products live
Conventional
25% down · 7.5% · 30yr
- Down + closing
- —
- Monthly P&I
- —
- Monthly cashflow
- —
- DSCR
- —
- Eligible?
- —
Personal DTI + credit; lowest rate.
DSCR
20% down · 8.5% · 30yr
- Down + closing
- —
- Monthly P&I
- —
- Monthly cashflow
- —
- DSCR
- —
- Eligible?
- —
No personal income docs; deal must DSCR.
Hard money
10% down · 12.0% · 12mo
- Down + closing
- —
- Monthly P&I
- —
- Monthly cashflow
- —
- DSCR
- —
- Eligible?
- —
Short-term bridge; refi at stabilization.
Listing history 3 events
-
2026-05-18historical Active Under Contract 86-char remark
-
2026-05-14$18,900 Active 86-char remark
-
2016-08-19$14,000
ⓘ Source: listings_history table (triggers on properties + properties_extension) + one-shot
backfill from property_details.listing_events for pre-trigger history.
Climate risk First Street
- Flood 1/10 Low FEMA zone X (unshaded) · 0% chance over 30 yrs
- Wildfire 1/10 Low
- Heat 3/10 Moderate 7 d/yr ≥99°F today · 18 d/yr by 30 yrs out
- Wind 2/10 Low 100% chance of damaging wind over 30 yrs
- Air quality 3/10 Moderate 2 unhealthy d/yr today · 3 by 30 yrs out
Nearby sold comps map
Loading sold comps map…
Walkable amenities ~0.75 mi
Loading nearby amenities…
Taxation est. · year 1
- Rental income
- $12,271
- − Mortgage interest
- −$1,059
- − Property taxes
- −$284
- − Insurance
- −$94
- − Repairs & maintenance
- −$982
- − Management
- −$982
- − Depreciation
- −$550
- Taxable income
- $8,321
- Est. tax owed @ 24.0%
- −$1,997
- After-tax cash flow
- $6,130/yr
For passive investors: Depreciation is non-cash, so a rental often shows a tax loss while cash-flowing — sheltering income. Rental losses are passive: they offset passive income freely, and up to $25,000/yr can offset ordinary (W-2) income if you actively participate and your MAGI is under $100k (phasing out to $0 by $150k); unused losses carry forward. On sale, claimed depreciation is recaptured at up to 25%, and gains may owe capital-gains tax (a 1031 exchange can defer both). Figures are a year-1 estimate at your 24.0% rate — not tax advice; consult a CPA.
Schools (NCES district)
- District
- Blackford County Schools
- NCES district ID
- 1800570
- Math proficiency
- 37% ▼ -12.00%
- Reading proficiency
- 41% ▼ -5.00%
- Median HH income
- $39,653
- Composite
- 32.67/100
- National rank
- #5656
- State rank
- #164 of 301 in IN
Livability — Roll
No livability data for this city. (Only ~50 U.S. cities are tracked.)
Census & demographics
- Census place
- Roll, IN
- Population (ZIP)
- 8,986
Population outlook (Blackford County) Hauer SSP2
- Today (2025)
- 11,183 people
- By 2030
- 10,542 · -5.7%
- By 2040
- 9,292 · -16.9%
- By 2050
- 8,176 · -26.9%
- By 2075
- 6,549 · -41.4%
- By 2100
- 5,636 · -49.6%
Race, ethnicity, and origin ACS 2023
- Neighborhood character
- Predominantly White (96%)
- Race & ethnicity
- White 96% Two or more races 3% Hispanic / Latino 2%
- Common ancestry
- Slovak 3% Lithuanian 3% Scotch-Irish 1%
- Foreign-born
- 1% · Canada
- Languages at home
- 98% English-only · Spanish 1%
Political lean MEDSL · Blackford
- 2024 margin
- Solid R (+50.3) · D 23.9% · R 74.2% · Other 1.9%
- 2008→2024 swing
- -50.1pp toward R · 2008: -0.2pp · 2024: -50.3pp
- All cycles
- 2024: R+50.3 2020: R+46.1 2016: R+43.7 2012: R+16.5 2008: R+0.2
Not yet ingested
- Civics
- —
Market trends
- HPI YoY
- ▼ -47.19%
- Current HPI
- 223.0485
- Rent YoY
- —
- Metro
- —
- State GDP YoY
- ▲ 2.90%
- F500 in state
- 18
Industry mix (Fortune 500 HQ in IN)
| Industry | F500 HQs | Revenue |
|---|---|---|
| Industrial Machinery | 2 | $37B |
|
||
| Healthcare | 1 | $177B |
|
||
| Pharmaceuticals | 1 | $45B |
|
||
| Metals / Steel | 1 | $18B |
|
||
| Agriculture | 1 | $17B |
|
||
| Packaging | 1 | $12B |
|
||
Price history
+35.0% since first listed5 events — show timeline
- 2026-06-03 Sold (MLS) $18,900 IRMLS
- 2026-05-20 Pending — IRMLS
- 2026-05-18 Contingent — IRMLS
- 2026-05-14 Listed $18,900 IRMLS
- 2016-08-19 Listed $14,000 IRMLS
Property tax history
+78.7%/yrLatest (2025): $1,857 · +2.8% YoY. Source: county tax records.
Cash-flow waterfall
monthlySold comps — $/sqft
last 12 mo · ≤1 miLoading sold comps…