110 E Washington St · Northboro, IA
Flood risk 1/10 · Minimal
- FEMA flood zone
- X (unshaded)
- Chance of flooding over 30 yrs
- 0.0%
- Est. flood insurance / yr
- $473 – $860
Fire risk 1/10 · Minimal
- Est. fire insurance / yr
- $902 – $1,676
Heat risk 3/10 · Minor
- Hot days now (above 105°F)
- 7 days/yr
- Hot days in 30 yrs
- 15 days/yr
Wind risk 2/10 · Minimal
- Chance of severe wind over 30 yrs
- —
Air-quality risk 1/10 · Minimal
- Unhealthy air days now
- 0 days/yr
- Unhealthy air days in 30 yrs
- 0 days/yr
Risk factors via First Street. Map © Google.
Why this score? — see what drove the C- grade
The composite is a weighted blend of 9 inputs, each scored 0–100. Each bar is that input's sub-score; the figure is the points it added to the 100-point composite (weight × sub-score).
- Cash flow +17.9/30.0
- ARV discount +7.5/15.0
- DSCR +5.6/10.0
- Schools +5.6/10.0
- Appreciation +5.0/10.0
- 1% rule +3.9/10.0
- Rent growth +2.5/5.0
- Condition / age +2.5/5.0
- Livability +2.2/5.0
$125,000
🖨 Deal sheet 📄 Offer letter ✓ Due diligence
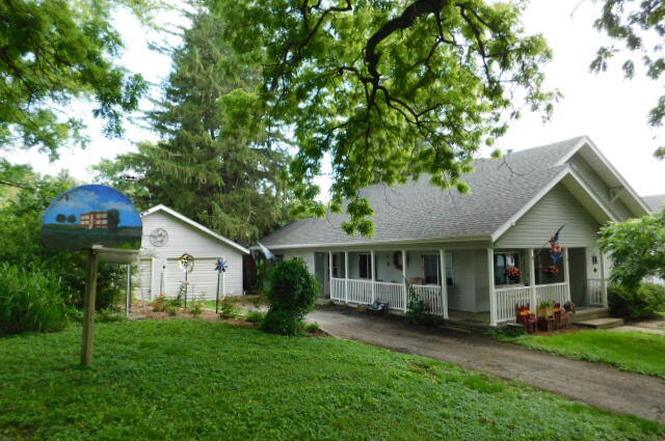
Listing remarks
There is this quiet and peaceful feeling when you are at this property. I can see the back yard barn looking shed being made into the cutest and tranquil artist studio. All the plants and landscaping you can work on is cheaper than therapy. There's xtra space in the garage that is a workshop so you can make things for your park like setting in the xtra lot with trees that you can't replace in our lifetime. This home has had 50 years of love, care and memories by the same owner. The wrap around porch with the porch swing has been a place of many laughs and conversations over the years and a shaded cool place to just be still for awhile. There is a screened in back porch also for your mornin
Key facts
- Wrap around porch
- Landscaping
- Back yard barn
Tags
Property features AI
Exterior
- Parking: Attached or detached garage with 2-car capacity; Asphalt driveway; Garage door opener
- Security: Smoke detectors installed
- Utilities: Private well water; Septic tank; Electricity available; Propane available
- Home design: Single-family residence; One-story home; Frame construction
- Construction: Frame construction; Composition roof; Full basement with walk-out access (partially finished)
- Exterior features: Front porch; Waterfront lot; Gravel road access; Other detached/outbuilding on the property
Interior
- Heating & cooling: Central air conditioning; Ceiling fan(s) for additional cooling; Forced air heating; Propane heating
- Interior features: Ceiling fans throughout; Eat-in kitchen
- Laundry & utility: Main-level laundry
Neighborhood map
What this means for you Summary
Snapshot
- This is a 3-bed/1.0-bath single-family listed at $125k.
Deal economics
- At list price, monthly cash flow is $105 ($1k/yr) — positive.
- The deal already cash-flows at list — no discount required.
- To meet the 1% rule (rent ≥ 1% of price), the offer needs to be $111k (10.9% below list).
- Recommended offer: $111k (10.9% below list) — sets the bar for 1% rule.
Location & tenants
- Location reads 45/100 on livability (#974 in IA) — a working-class tenant base; expect higher turnover. Strengths: cost of living A+, crime A; Watch: amenities F, commute F, employment F.
- Shenandoah Community School District (town): math 64% / reading 69% proficiency, ranked #190 of 289 in IA (top 66%) — acceptable for families but not a draw, mixed tenant base, ~2y average lease.
- Zoned schools: Shenandoah Elementary School (math 77% / reading 57%, grade B+, #273 of 616 statewide, top 51%, 375 students, 39% FRL); Shenandoah Middle School (math 61% / reading 74%, grade A-, #133 of 246 statewide, top 56%, 296 students, 38% FRL); Shenandoah High School (math 61% / reading 68%, grade B-, #211 of 336 statewide, top 70%, 259 students, 38% FRL) — zoned schools at 38% FRL track the district average.
- Market conditions: 3 active listings in the ZIP; 25 units permitted in Page County in 2024 (0 in 5+ unit buildings).
Forward outlook
- In year one you build about $5k of equity ($864 loan paydown + $4k appreciation (3.0% local appreciation)).
- Page County population projected at -12% by 2050 — secular population decline; favor cash flow + early exit over multi-decade hold.
- At projected returns (3.0% appreciation + 3.0% rent growth), your $35k cash investment doubles in ~6 years — after that, you're playing with house money.
- By year 8, paydown + projected appreciation supports a ~$34k cash-out refi (75% LTV) — recoverable capital for the next deal without selling this one.
Negotiation context
- Only 4 days on market — expect competitive offers; lowballing is unlikely to land.
Risks & watch-outs
- Watch-outs: built in 1928 — expect roof / HVAC / electrical / plumbing capex.
Questions for the listing agent
- Built in 1928 — when were the roof, HVAC, electrical panel, plumbing, and water heater last replaced?
- Is there a deadline driving the sale (1031 exchange, divorce, estate, relocation)? That informs how much negotiation room exists.
- Schools are D-rated, which usually means shorter tenancies and higher turnover. Who's the typical renter profile here, and what's been the actual vacancy rate?
- What's the average days-on-market for RENTAL listings here right now (not sales)? A rising rental-DOM trend means longer vacancies and softer asking-rent achievability than the comps imply.
- What's the recent tenant-quality profile in this submarket — average credit score on applications, eviction rate, late-payment / NSF rate, and stable-employment percentage? A property-management company in the area should have these aggregated.
- How much new for-sale + rental construction is in the pipeline within 1–3 miles? Heavy new supply typically softens prices + rents 12–24 months out; constrained supply supports both.
Investment metrics
- 1% rule
- 0.89% ✗
- Cap rate
- 7.30%
- Cash-on-cash
- 3.59%
- DSCR
- 1.16
- GRM
- 9.4
CMA / ARV
No comps found within radius.
Projected returns pro-forma
3.0% appreciation · 3.0% rent growth · sell at horizon
- IRR
- 10.8%
- Equity multiple
- 1.62×
- Total profit
- $21,695
- Equity at exit
- $56,205
- IRR
- 13.1%
- Equity multiple
- 2.94×
- Total profit
- $67,846
- Equity at exit
- $86,619
Cash invested: $35,000 (down + closing). Projections, not guarantees.
Landlord ↔ Tenant lean methodology
- Overall (STATE)
- 83 Strongly Landlord-Friendly
- State Iowa
- 83 Strongly Landlord-Friendly · R+6
- County
- — inherits STATE
- City
- — inherits STATE
ZIP-level market 51647
- Active inventory
- 3
- Price-to-rent
- 9.4×
Monthly cashflow live
- Estimated rent
- $1,114 medium interval (Pro) →
- Mortgage (P&I)
- −$656
- Tax from tax record
- −$68 /mo · $812/yr
- Insurance
- −$52
- HOA
- −$0
- Vacancy / Maint / Mgmt
- −$234
- Net cashflow
- $105
Break-even live
UW: 25.0% down · 7.5% · 30yr · 1.5% tax · 5.0% vac · 8.0% maint · 8.0% mgmt
Financing live
Cash to close
- Down payment
- $31,250
- Closing costs
- $3,750
- Reserves months
- —
- Total cash needed
- —
Loan-product check · same deal, 3 products live
Conventional
25% down · 7.5% · 30yr
- Down + closing
- —
- Monthly P&I
- —
- Monthly cashflow
- —
- DSCR
- —
- Eligible?
- —
Personal DTI + credit; lowest rate.
DSCR
20% down · 8.5% · 30yr
- Down + closing
- —
- Monthly P&I
- —
- Monthly cashflow
- —
- DSCR
- —
- Eligible?
- —
No personal income docs; deal must DSCR.
Hard money
10% down · 12.0% · 12mo
- Down + closing
- —
- Monthly P&I
- —
- Monthly cashflow
- —
- DSCR
- —
- Eligible?
- —
Short-term bridge; refi at stabilization.
Listing history 5 events
-
2026-06-18days on market $125,000 Active 4 DOM
-
2026-06-17days on market $125,000 Active 3 DOM
-
2026-06-16days on market $125,000 Active 2 DOM
-
2026-06-15remarks 699-char remark
-
2026-06-15$125,000 Active 1 DOM
ⓘ Source: listings_history table (triggers on properties + properties_extension) + one-shot
backfill from property_details.listing_events for pre-trigger history.
Tax reassessment forecast IA · Partial reset (capped growth)
- Current annual tax
- $812 · $68/mo
- Projected year-2 tax
- $1,387 · $116/mo
- Expected delta
- +$575/yr (+$48/mo · 70.8%)
ⓘ Screening estimate from a state-policy table — verify with the county assessor before closing.
Climate risk First Street
- Flood 1/10 Low FEMA zone X (unshaded) · 0% chance over 30 yrs
- Wildfire 1/10 Low
- Heat 3/10 Moderate 7 d/yr ≥105°F today · 15 d/yr by 30 yrs out
- Wind 2/10 Low
- Air quality 1/10 Low 0 unhealthy d/yr today · 0 by 30 yrs out
Nearby sold comps map
Loading sold comps map…
Walkable amenities ~0.75 mi
Loading nearby amenities…
Taxation est. · year 1
- Rental income
- $13,368
- − Mortgage interest
- −$7,002
- − Property taxes
- −$812
- − Insurance
- −$625
- − Repairs & maintenance
- −$1,069
- − Management
- −$1,069
- − Depreciation
- −$3,636
- Taxable loss
- −$846
- Est. tax savings @ 24.0%
- +$203
- After-tax cash flow
- $1,461/yr
For passive investors: Depreciation is non-cash, so a rental often shows a tax loss while cash-flowing — sheltering income. Rental losses are passive: they offset passive income freely, and up to $25,000/yr can offset ordinary (W-2) income if you actively participate and your MAGI is under $100k (phasing out to $0 by $150k); unused losses carry forward. On sale, claimed depreciation is recaptured at up to 25%, and gains may owe capital-gains tax (a 1031 exchange can defer both). Figures are a year-1 estimate at your 24.0% rate — not tax advice; consult a CPA.
Schools (NCES district)
- District
- Shenandoah Community School District
- NCES district ID
- 1926070
- Math proficiency
- 64% ▼ -10.00%
- Reading proficiency
- 69% ▼ -5.00%
- Median HH income
- $41,835
- Composite
- 55.67/100
- National rank
- #1225
- State rank
- #190 of 289 in IA
Livability — Northboro
- Score
- 45/100
- State rank
- #974
- US rank
- #26595
Category grades
Schools grade is shown separately in the Schools card above.
Census & demographics
- Census place
- Northboro, IA
- Population (ZIP)
- 154
Population outlook (Page County) Hauer SSP2
- Today (2025)
- 15,052 people
- By 2030
- 14,709 · -2.3%
- By 2040
- 13,981 · -7.1%
- By 2050
- 13,302 · -11.6%
- By 2075
- 11,678 · -22.4%
- By 2100
- 9,213 · -38.8%
Race, ethnicity, and origin ACS 2023
- Neighborhood character
- Predominantly White (99%)
- Race & ethnicity
- White 99% Hispanic / Latino 1%
- Common ancestry
- Italian 9% Portuguese 1%
Political lean MEDSL · Page
- 2024 margin
- Solid R (+42.4) · D 28.2% · R 70.6% · Other 1.1%
- 2008→2024 swing
- -22.7pp toward R · 2008: -19.7pp · 2024: -42.4pp
- All cycles
- 2024: R+42.4 2020: R+43.0 2016: R+44.1 2012: R+24.9 2008: R+19.7
Not yet ingested
- Civics
- —
Market trends
- HPI YoY
- —
- Current HPI
- —
- Rent YoY
- —
- Metro
- —
- State GDP YoY
- ▲ 2.48%
- F500 in state
- 4
Industry mix (Fortune 500 HQ in IA)
| Industry | F500 HQs | Revenue |
|---|---|---|
| Financial Services | 1 | $16B |
|
||
| Retail / Convenience | 1 | $15B |
|
||
Price history
1 event — show timeline
- 2026-06-12 Listed $125,000 SWIAR
Property tax history
+3.1%/yrLatest (2025): $812 · -8.4% YoY. Source: county tax records.
Cash-flow waterfall
monthlySold comps — $/sqft
last 12 mo · ≤1 miLoading sold comps…