311 Grande Ave · Middle, NJ
Flood risk No data
- FEMA flood zone
- —
- Chance of flooding over 30 yrs
- —
- Est. flood insurance / yr
- —
Fire risk No data
- Est. fire insurance / yr
- —
Heat risk No data
- Hot days now (above threshold)
- —
- Hot days in 30 yrs
- —
Wind risk No data
- Chance of severe wind over 30 yrs
- —
Air-quality risk No data
- Unhealthy air days now
- —
- Unhealthy air days in 30 yrs
- —
Risk factors via First Street. Map © Google.
Why this score? — see what drove the D+ grade
The composite is a weighted blend of 9 inputs, each scored 0–100. Each bar is that input's sub-score; the figure is the points it added to the 100-point composite (weight × sub-score).
- Cash flow +23.7/30.0
- DSCR +7.6/10.0
- 1% rule +6.2/10.0
- Condition / age +3.8/5.0
- Rent growth +2.5/5.0
- Livability +2.5/5.0
- Schools +2.4/10.0
- ARV discount +0.0/15.0
- Appreciation +0.0/10.0
$189,999
🖨 Deal sheet 📄 Offer letter ✓ Due diligence
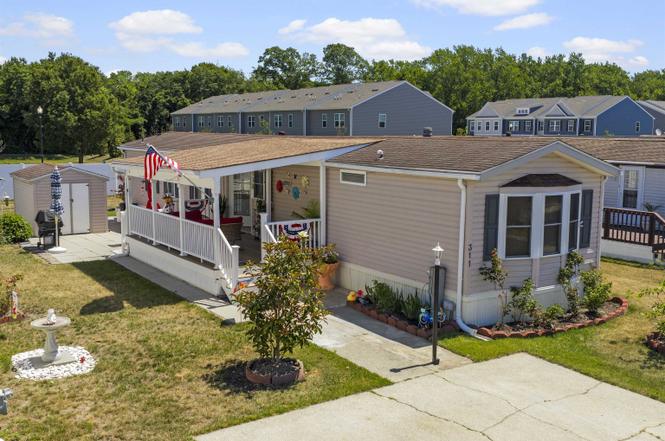
Listing remarks
Rare Opportunity in a Year-Round Community! Welcome to Grande Woods North—a premier, all-ages Manufactured Home Community where pride of ownership shines throughout. This exceptional neighborhood offers year-round living with each home set on a spacious 40' x 100' lot. Enjoy the convenience of off-street parking for two vehicles, individual mailboxes, and underground utilities. This well-maintained home boasts an open floor plan with vaulted ceilings and a spacious, eat-in kitchen that flows into a comfortable living room—ideal for year-round living or a seasonal getaway. The primary bedroom includes a private, bathroom and walk in closet, while the second bedroom, located on th
Key facts
- Open floor plan
- Off street parking
- Eat in kitchen
Tags
Property features AI
Exterior
- Parking: Parking pad for 2 cars
- Utilities: Public water; Public sewer; Electric water heater
- Home design: Single-family property; For sale
- Construction: Vinyl construction
- Exterior features: Patio; Porch; Storage building; In-ground pool; Vinyl exterior
Interior
- Kitchen: Range; Oven; Microwave; Refrigerator; Dishwasher
- Bedrooms: 2 bedrooms
- Flooring: Laminate flooring
- Bathrooms: 2 full bathrooms
- Heating & cooling: Natural gas heating; Central air conditioning; Ceiling fan(s)
- Interior features: Bar; Cathedral ceilings; Smoke/fire alarm; Curtains, shades and other window treatments; 6 total rooms; Living room; Eat-in kitchen; First-floor primary bedroom; Laundry closet; Crawl space basement with outside entrance
- Laundry & utility: Washer; Dryer; Electric hot water
Neighborhood map
What this means for you Summary
Snapshot
- This is a 2-bed/2.0-bath manufactured listed at $190k. Condition is rated good.
Deal economics
- At list price, monthly cash flow is $363 ($4k/yr) — positive.
- The deal already cash-flows at list — no discount required.
- Meets the 1% rule at list price ($2k rent vs $190k).
Location & tenants
- Location reads: area grade D — affects rentability + tenant quality, not the cash-flow math above.
- Middle Township Public School District (suburban): math 15% / reading 38% proficiency, ranked #372 of 472 in NJ (top 79%) — low school quality limits family demand, transient renter base, plan for 1-2y turnover.
- Market conditions: 144 active listings in the ZIP; 877 units permitted in Cape May County in 2024 (35 in 5+ unit buildings).
Forward outlook
- Local home prices are declining (-3.0%/yr); year-one equity from $1k of loan paydown is wiped out by about $6k of value loss. Plan a longer hold.
- Cape May County population projected at -24% by 2050 — secular population decline; favor cash flow + early exit over multi-decade hold.
Negotiation context
- Only 1 days on market — expect competitive offers; lowballing is unlikely to land.
Questions for the listing agent
- Is there a deadline driving the sale (1031 exchange, divorce, estate, relocation)? That informs how much negotiation room exists.
- The area grade is low — what's the realistic commute time and amenity access for the typical tenant pool here? Any planned neighborhood developments (good or bad) we should know about?
- What's the average days-on-market for RENTAL listings here right now (not sales)? A rising rental-DOM trend means longer vacancies and softer asking-rent achievability than the comps imply.
- What's the recent tenant-quality profile in this submarket — average credit score on applications, eviction rate, late-payment / NSF rate, and stable-employment percentage? A property-management company in the area should have these aggregated.
- How much new for-sale + rental construction is in the pipeline within 1–3 miles? Heavy new supply typically softens prices + rents 12–24 months out; constrained supply supports both.
Investment metrics
- 1% rule
- 1.12% ✓
- Cap rate
- 8.58%
- Cash-on-cash
- 8.18%
- DSCR
- 1.36
- GRM
- 7.5
CMA / ARV
- ARV (on-the-fly)
- $157,780
- Comps found
- 6
Show comp detail 6 sales within ~0.75 mi
| Address | Dist | Beds/Ba | Sqft | Sold | Price | $/sf | Match |
|---|---|---|---|---|---|---|---|
| 68 Priest Blvd | 0.09mi | 2/2.0 | 980 (0%) | 2mo | $140,000 | $143 | 94 |
| 322 Grande Blvd | 0.10mi | 3/2.0 (+1) | 980 (0%) | 19mo | $178,000 | $182 | 74 |
| 71 Priest Blvd | 0.08mi | 2/1.5 | 900 (-8%) | 18mo | $145,000 | $161 | 66 |
| 2 Priest Blvd | 0.17mi | 2/2.0 | 896 (-9%) | 23mo | $115,000 | $128 | 58 |
| 233 Maurice Blvd | 0.14mi | 2/2.0 | 840 (-14%) | 15mo | $135,000 | $161 | 57 |
| 229 Maurice Blvd | 0.14mi | 2/2.0 | 840 (-14%) | 19mo | $160,000 | $190 | 54 |
Match score weights: distance 35% · size 25% · config 20% · recency 20%. Top-matched comps best support the ARV.
Projected returns pro-forma
-3.0% appreciation · 3.0% rent growth · sell at horizon
- IRR
- -3.8%
- Equity multiple
- 0.86×
- Total profit
- $-7,657
- Equity at exit
- $28,329
- IRR
- 5.9%
- Equity multiple
- 1.44×
- Total profit
- $23,205
- Equity at exit
- $16,428
Cash invested: $53,200 (down + closing). Projections, not guarantees.
Landlord ↔ Tenant lean methodology
- Overall (STATE)
- 21 Tenant-Leaning
- State New Jersey
- 21 Tenant-Leaning · D+6
- County
- — inherits STATE
- City
- — inherits STATE
ZIP-level market 08210
- Home prices YoY
- -22.3%
- Active inventory
- 144
- Price-to-rent
- 7.5×
Monthly cashflow live
- Estimated rent
- $2,121 medium interval (Pro) →
- Mortgage (P&I)
- −$996
- Tax est. 1.5%
- −$237 /mo · $2,850/yr
- Insurance
- −$79
- HOA
- −$0
- Vacancy / Maint / Mgmt
- −$445
- Net cashflow
- $363
Break-even live
UW: 25.0% down · 7.5% · 30yr · 1.5% tax · 5.0% vac · 8.0% maint · 8.0% mgmt
Financing live
Cash to close
- Down payment
- $47,500
- Closing costs
- $5,700
- Reserves months
- —
- Total cash needed
- —
Loan-product check · same deal, 3 products live
Conventional
25% down · 7.5% · 30yr
- Down + closing
- —
- Monthly P&I
- —
- Monthly cashflow
- —
- DSCR
- —
- Eligible?
- —
Personal DTI + credit; lowest rate.
DSCR
20% down · 8.5% · 30yr
- Down + closing
- —
- Monthly P&I
- —
- Monthly cashflow
- —
- DSCR
- —
- Eligible?
- —
No personal income docs; deal must DSCR.
Hard money
10% down · 12.0% · 12mo
- Down + closing
- —
- Monthly P&I
- —
- Monthly cashflow
- —
- DSCR
- —
- Eligible?
- —
Short-term bridge; refi at stabilization.
Listing history 2 events
-
2026-06-18remarks 687-char remark
-
2026-06-18$189,999 Active 1 DOM
ⓘ Source: listings_history table (triggers on properties + properties_extension) + one-shot
backfill from property_details.listing_events for pre-trigger history.
Nearby sold comps map
Loading sold comps map…
Walkable amenities ~0.75 mi
Loading nearby amenities…
Taxation est. · year 1
- Rental income
- $25,454
- − Mortgage interest
- −$10,643
- − Property taxes
- −$2,850
- − Insurance
- −$950
- − Repairs & maintenance
- −$2,036
- − Management
- −$2,036
- − Depreciation
- −$5,527
- Taxable income
- $1,411
- Est. tax owed @ 24.0%
- −$339
- After-tax cash flow
- $4,013/yr
For passive investors: Depreciation is non-cash, so a rental often shows a tax loss while cash-flowing — sheltering income. Rental losses are passive: they offset passive income freely, and up to $25,000/yr can offset ordinary (W-2) income if you actively participate and your MAGI is under $100k (phasing out to $0 by $150k); unused losses carry forward. On sale, claimed depreciation is recaptured at up to 25%, and gains may owe capital-gains tax (a 1031 exchange can defer both). Figures are a year-1 estimate at your 24.0% rate — not tax advice; consult a CPA.
Condition & rehab AI · 12 photos
This manufactured home is in good condition with a good condition score of 75. It has a cosmetic rehab level and requires minor maintenance and repairs. The home has a good resale and rental value and can be improved with a fresh coat of paint and a clean gutter system.
Value-add opportunities
- Both Paint the exterior siding — Painting the exterior siding can enhance the home's curb appeal and increase its value.
- Both Clean the gutters — A clean and clear gutter system can prevent water damage and improve the home's overall appearance.
Renovation cost estimate screening
Value-add ROI direction
- Both Paint the exterior siding — Painting the exterior siding can enhance the home's curb appeal and increase its value. ↑
- Both Clean the gutters — A clean and clear gutter system can prevent water damage and improve the home's overall appearance. ↑
ⓘ Cost ranges are severity-bucket heuristics (US national rule-of-thumb). Get contractor quotes + a written scope before underwriting a rehab budget.
Schools (NCES district)
- District
- Middle Township Public School District
- NCES district ID
- 3410020
- Math proficiency
- 15% ▼ -18.00%
- Reading proficiency
- 38% ▼ -7.00%
- Median HH income
- $59,228
- Composite
- 24.09/100
- National rank
- #7754
- State rank
- #372 of 472 in NJ
Livability — Middle
No livability data for this city. (Only ~50 U.S. cities are tracked.)
Census & demographics
- Census place
- Rio Grande, NJ
- Population (ZIP)
- 17,278
Population outlook (Cape May County) Hauer SSP2
- Today (2025)
- 88,234 people
- By 2030
- 84,144 · -4.6%
- By 2040
- 75,146 · -14.8%
- By 2050
- 67,389 · -23.6%
- By 2075
- 55,732 · -36.8%
- By 2100
- 44,972 · -49.0%
Race, ethnicity, and origin ACS 2023
- Neighborhood character
- Predominantly White (80%)
- Race & ethnicity
- White 80% Hispanic / Latino 8% Black 7% Two or more races 6% Asian 2%
- Hispanic origin (detail)
- Puerto Rican 2%
- Common ancestry
- Romanian 6% Subsaharan African 1% Lithuanian 1%
- Foreign-born
- 4% · Canada
- Languages at home
- 91% English-only · Spanish 4% Other Indo-European 2% Russian/Polish/Slavic 1%
Political lean MEDSL · Cape May
- 2024 margin
- R (+19.2) · D 39.7% · R 58.9% · Other 1.4%
- 2008→2024 swing
- -10.6pp toward R · 2008: -8.7pp · 2024: -19.2pp
- All cycles
- 2024: R+19.2 2020: R+15.9 2016: R+19.9 2012: R+8.9 2008: R+8.7
Not yet ingested
- Civics
- —
Market trends
- HPI YoY
- ▼ -100.23%
- Current HPI
- 349.1624
- Rent YoY
- —
- Metro
- —
- State GDP YoY
- ▲ 2.05%
- F500 in state
- 34
Industry mix (Fortune 500 HQ in NJ)
| Industry | F500 HQs | Revenue |
|---|---|---|
| Consumer Goods | 3 | $31B |
|
||
| Pharmaceuticals | 2 | $153B |
|
||
| Technology | 2 | $21B |
|
||
| Insurance | 2 | $20B |
|
||
| Healthcare | 2 | $19B |
|
||
| Financial Services | 1 | $70B |
|
||
Price history
1 event — show timeline
- 2026-06-18 Listed $189,999 CMCMLS
Cash-flow waterfall
monthlySold comps — $/sqft
last 12 mo · ≤1 miLoading sold comps…