811 Long Point Rd · Tall Timbers, MD
Flood risk 7/10 · Major
- FEMA flood zone
- X (unshaded)
- Chance of flooding over 30 yrs
- 0.88%
- Est. flood insurance / yr
- $507 – $1,088
Fire risk 4/10 · Minor
- Est. fire insurance / yr
- $666 – $1,236
Heat risk 9/10 · Severe
- Hot days now (above 102°F)
- 7 days/yr
- Hot days in 30 yrs
- 17 days/yr
Wind risk 6/10 · Moderate
- Chance of severe wind over 30 yrs
- 41.0%
Air-quality risk 2/10 · Minimal
- Unhealthy air days now
- 0 days/yr
- Unhealthy air days in 30 yrs
- 1 days/yr
Risk factors via First Street. Map © Google.
Why this score? — see what drove the D- grade
The composite is a weighted blend of 9 inputs, each scored 0–100. Each bar is that input's sub-score; the figure is the points it added to the 100-point composite (weight × sub-score).
- ARV discount +15.0/15.0
- Appreciation +10.0/10.0
- Schools +4.0/10.0
- Cash flow +2.9/30.0
- Rent growth +2.5/5.0
- Condition / age +2.5/5.0
- Livability +2.4/5.0
- 1% rule +0.0/10.0
- DSCR +0.0/10.0
$399,985
🖨 Deal sheet 📄 Offer letter ✓ Due diligence
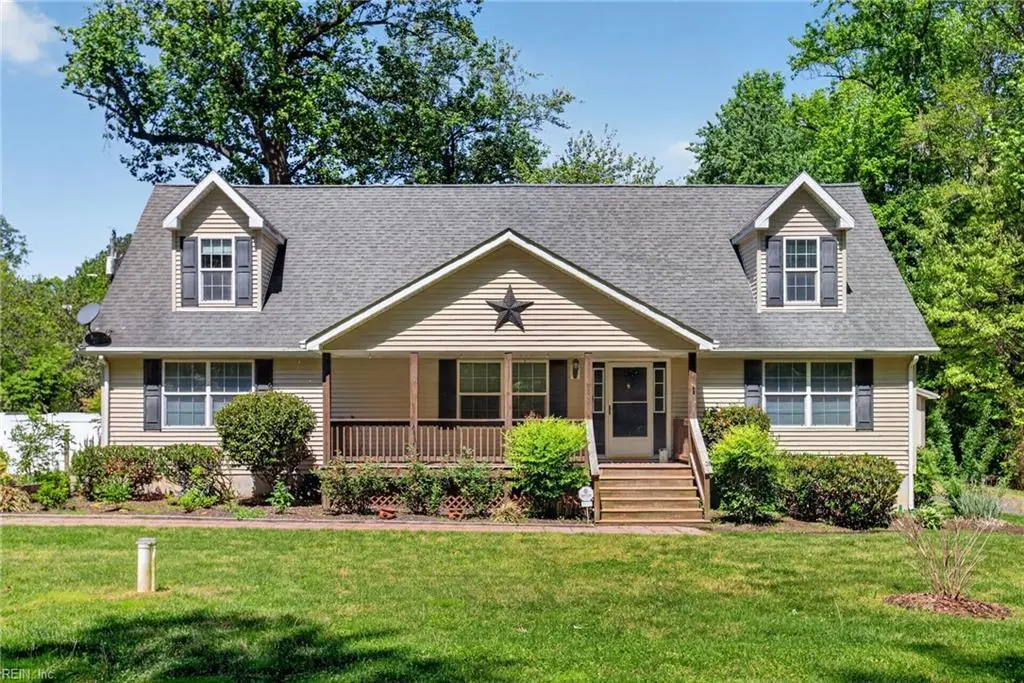
Listing remarks
Check out the PRICE IMPROVEMENT!! Welcome to 811 Long Point Drive in Hague, VA. This charming Cape Cod-style home sits on a spacious, private lot surrounded by mature trees, creating a peaceful setting just minutes from the water. Inside, enjoy a bright open floor plan with updated flooring and a beautifully renovated kitchen featuring butcher block countertops, farmhouse sink, stainless appliances, and an oversized gas range. The flexible layout includes spacious bedrooms and a large upper-level area that could be a huge primary suite or bonus space. Outdoor features include a welcoming front porch, rear deck, and an impressive detached garage/workshop with electric, high ceilings, and amp
Key facts
- 0.4 acre lot
- Garage
- Built 2006
Property features AI
Finance
- HOA & community: No HOA
Exterior
- Parking: Has garage; Oversized garage; Off-street parking
- Utilities: Well water; City/County sewer; Electric water heater; Electric power
- Home design: Detached Cape Cod; 1.5 stories with 2 living levels; Crawlspace foundation; Vinyl siding
- Construction: Asphalt shingle roof; Crawl foundation; Vinyl exterior siding; Detached workshop and storage shed
- Exterior features: Deck; Wooded yard; Back privacy fence
Interior
- Kitchen: Gas range; Microwave; Dishwasher; Garbage disposal; Refrigerator; Breakfast area
- Bedrooms: Master bedroom; Additional bedroom; Two bedrooms have ensuite baths
- Flooring: Carpet; Wood
- Bathrooms: Three full bathrooms
- Heating & cooling: Heat pump; Oil heating; Central air conditioning
- Interior features: Ceiling fan; Satellite dish; Double primary sink; Walk-in closet; Main floor bedroom with full bathroom; Office/Study; Pantry; Utility closet; Workshop
- Laundry & utility: Washer and dryer included; Main floor laundry; Utility room
Neighborhood map
What this means for you Summary
Snapshot
- This is a 3-bed/2.0-bath single-family listed at $400k.
Deal economics
- At list price, monthly cash flow is $-1k ($-17k/yr) — negative.
- To cash-flow at today's rent, offer at most $155k (61.3% below list).
- To meet the 1% rule (rent ≥ 1% of price), the offer needs to be $139k (65.2% below list).
- Recommended offer: $139k (65.2% below list) — sets the bar for 1% rule.
Location & tenants
- Location reads 47/100 on livability (#466 in MD) — a working-class tenant base; expect higher turnover. Strengths: housing A+, crime A, schools B+; Watch: amenities F, commute F, employment F.
- Westmoreland County Public School District (rural): math 34% / reading 59% proficiency, ranked #105 of 131 in VA (top 80%) — families likely to look elsewhere, expect single-tenant / working-renter base with shorter leases; 64% free/reduced lunch — lower-income household profile, screen leases tightly.
- Market conditions: 220 units permitted in Westmoreland County in 2024 (0 in 5+ unit buildings).
Forward outlook
- In year one you build about $43k of equity ($3k loan paydown + $40k appreciation (10.0% local appreciation)).
- Westmoreland County population projected to shrink 7% by 2050 — rents likely to lag national; underwrite the cash flow, not the appreciation.
- By year 2, paydown + projected appreciation supports a ~$69k cash-out refi (75% LTV) — recoverable capital for the next deal without selling this one.
Negotiation context
- It's been on market 42 days — a 3% lower offer ($388k) is reasonable based on typical stale-listing flexibility.
- 5 sale attempts since 3y ago; this cycle's ask has dropped $25k (6%) from the opening price — seller is motivated, your offer sets the floor, not the list.
- Current owner paid $345k; 16% above their basis — modest negotiation headroom, anchor on the comps not their cost.
Risks & watch-outs
- Watch-outs: flood insurance adds $66/mo.
- Climate carrying-cost: major flood risk; major wind risk, 41% chance of damaging wind over 30y; extreme-heat days projected 7→17/yr by 2055 (HVAC capex compounding) — expect insurance premiums to compound above CPI over the hold.
Questions for the listing agent
- What do current leases actually rent for vs. the listed asking? Can we see a recent rent roll and the last 12 months of T-12 income?
- It's been on market 42 days. Have you received any prior offers? Is the seller open to a 65% concession, seller financing, or rate buy-down credit?
- What's the actual annual flood-insurance premium (NFIP or private), and is the property in a SFHA with mandatory coverage?
- Is there a deadline driving the sale (1031 exchange, divorce, estate, relocation)? That informs how much negotiation room exists.
- Schools are B-rated — typically a magnet for longer-tenancy family renters. What's the average tenant stay here, and is there a school-zone premium baked into asking?
- The area grade is low — what's the realistic commute time and amenity access for the typical tenant pool here? Any planned neighborhood developments (good or bad) we should know about?
- What's the average days-on-market for RENTAL listings here right now (not sales)? A rising rental-DOM trend means longer vacancies and softer asking-rent achievability than the comps imply.
- What's the recent tenant-quality profile in this submarket — average credit score on applications, eviction rate, late-payment / NSF rate, and stable-employment percentage? A property-management company in the area should have these aggregated.
- How much new for-sale + rental construction is in the pipeline within 1–3 miles? Heavy new supply typically softens prices + rents 12–24 months out; constrained supply supports both.
Investment metrics
- 1% rule
- 0.35% ✗
- Cap rate
- 2.33%
- Cash-on-cash
- -14.16%
- DSCR
- 0.37
- GRM
- 24.0
CMA / ARV
- ARV (median comp)
- $532,713
- List price
- $399,985
- Delta
- -24.92%
- Verdict
- UNDERPRICED
- Comps
- 7 within 1.0 mi
Show comp detail 1 sale within ~0.75 mi
| Address | Dist | Beds/Ba | Sqft | Sold | Price | $/sf | Match |
|---|---|---|---|---|---|---|---|
| 630 Warner Ln | 0.36mi | 4/2.0 (+1) | 2,436 (-7%) | 20mo | $484,900 | $199 | 50 |
Match score weights: distance 35% · size 25% · config 20% · recency 20%. Top-matched comps best support the ARV.
Projected returns pro-forma
10.0% appreciation · 3.0% rent growth · sell at horizon
- IRR
- 13.9%
- Equity multiple
- 2.15×
- Total profit
- $129,290
- Equity at exit
- $360,338
- IRR
- 14.0%
- Equity multiple
- 5.02×
- Total profit
- $449,958
- Equity at exit
- $777,083
Cash invested: $111,996 (down + closing). Projections, not guarantees.
Landlord ↔ Tenant lean methodology
- Overall (STATE)
- 27 Tenant-Leaning
- State Maryland
- 27 Tenant-Leaning · D+14
- County
- — inherits STATE
- City
- — inherits STATE
ZIP-level market 22469
- Home prices YoY
- 22.9%
- Price-to-rent
- 24.0×
Monthly cashflow live
- Estimated rent
- $1,390 medium interval (Pro) →
- Mortgage (P&I)
- −$2,098
- Tax from tax record
- −$155 /mo · $1,866/yr
- Insurance
- −$167
- Flood insurance flood zone
- −$66 /mo · $798/yr
- HOA
- −$0
- Vacancy / Maint / Mgmt
- −$292
- Net cashflow
- $-1,388
Break-even live
UW: 25.0% down · 7.5% · 30yr · 1.5% tax · 5.0% vac · 8.0% maint · 8.0% mgmt
Financing live
Cash to close
- Down payment
- $99,996
- Closing costs
- $12,000
- Reserves months
- —
- Total cash needed
- —
Loan-product check · same deal, 3 products live
Conventional
25% down · 7.5% · 30yr
- Down + closing
- —
- Monthly P&I
- —
- Monthly cashflow
- —
- DSCR
- —
- Eligible?
- —
Personal DTI + credit; lowest rate.
DSCR
20% down · 8.5% · 30yr
- Down + closing
- —
- Monthly P&I
- —
- Monthly cashflow
- —
- DSCR
- —
- Eligible?
- —
No personal income docs; deal must DSCR.
Hard money
10% down · 12.0% · 12mo
- Down + closing
- —
- Monthly P&I
- —
- Monthly cashflow
- —
- DSCR
- —
- Eligible?
- —
Short-term bridge; refi at stabilization.
Listing history 30 events
-
2026-06-18days on market $399,985 Active 42 DOM
-
2026-06-17days on market $399,985 Active 41 DOM
-
2026-06-16days on market $399,985 Active 40 DOM
-
2026-06-15days on market $399,985 Active 39 DOM
-
2026-06-14days on market $399,985 Active 37 DOM
-
2026-06-13days on market $399,985 Active 36 DOM
-
2026-06-10days on market $399,985 Active 34 DOM
-
2026-06-09days on market $399,985 Active 33 DOM
-
2026-06-08days on market $399,985 Active 32 DOM
-
2026-06-07days on market $399,985 Active 31 DOM
-
2026-06-03days on market $399,985 Active 27 DOM
-
2026-06-03price $399,985 Active 26 DOM
-
2026-06-02days on market $425,000 Active 26 DOM
-
2026-06-01days on market $425,000 Active 25 DOM
-
2026-05-31days on market $425,000 Active 24 DOM
-
2026-05-31days on market $425,000 Active 23 DOM
-
2026-05-08$425,000 Active 791-char remark
-
2026-05-02$425,000 791-char remark
-
2026-03-03historical
-
2025-11-10$425,000 Active
-
2025-08-30$425,000 Active
-
2025-08-25historical
-
2023-06-21soldstatus $345,000
-
2023-06-16soldstatus $345,000 Closed
-
2023-05-22historical Active Under Contract
-
2023-04-22price $354,900
-
2023-04-02price $359,900
-
2023-03-16$369,900 Active
-
2017-03-24soldstatus $185,000
-
2007-04-12soldstatus $207,000
ⓘ Source: listings_history table (triggers on properties + properties_extension) + one-shot
backfill from property_details.listing_events for pre-trigger history.
Tax reassessment forecast MD · Partial reset (capped growth)
- Current annual tax
- $1,866 · $155/mo
- Projected year-2 tax
- $3,113 · $259/mo
- Expected delta
- +$1,247/yr (+$104/mo · 66.8%)
ⓘ Screening estimate from a state-policy table — verify with the county assessor before closing.
Climate risk First Street
- Flood 7/10 Severe FEMA zone X (unshaded) · 88% chance over 30 yrs
- Wildfire 4/10 Moderate
- Heat 9/10 Extreme 7 d/yr ≥102°F today · 17 d/yr by 30 yrs out
- Wind 6/10 Major 41% chance of damaging wind over 30 yrs
- Air quality 2/10 Low 0 unhealthy d/yr today · 1 by 30 yrs out
Nearby sold comps map
Loading sold comps map…
Walkable amenities ~0.75 mi
Loading nearby amenities…
Taxation est. · year 1
- Rental income
- $16,681
- − Mortgage interest
- −$22,405
- − Property taxes
- −$1,866
- − Insurance
- −$2,797
- − Repairs & maintenance
- −$1,334
- − Management
- −$1,334
- − Depreciation
- −$11,636
- Taxable loss
- −$24,693
- Est. tax savings @ 24.0%
- +$5,926
- After-tax cash flow
- $-10,730/yr
For passive investors: Depreciation is non-cash, so a rental often shows a tax loss while cash-flowing — sheltering income. Rental losses are passive: they offset passive income freely, and up to $25,000/yr can offset ordinary (W-2) income if you actively participate and your MAGI is under $100k (phasing out to $0 by $150k); unused losses carry forward. On sale, claimed depreciation is recaptured at up to 25%, and gains may owe capital-gains tax (a 1031 exchange can defer both). Figures are a year-1 estimate at your 24.0% rate — not tax advice; consult a CPA.
Schools (NCES district)
- District
- Westmoreland County Public School District
- NCES district ID
- 5103980
- Math proficiency
- 34% ▼ -47.00%
- Reading proficiency
- 59% ▼ -11.00%
- Median HH income
- $51,665
- Composite
- 39.94/100
- National rank
- #3845
- State rank
- #105 of 131 in VA
Livability — Tall Timbers
- Score
- 47/100
- State rank
- #466
- US rank
- #26296
Category grades
Schools grade is shown separately in the Schools card above.
Census & demographics
- City population
- 1,046
- Population (ZIP)
- 1,986
Population outlook (Westmoreland County) Hauer SSP2
- Today (2025)
- 17,643 people
- By 2030
- 17,520 · -0.7%
- By 2040
- 17,041 · -3.4%
- By 2050
- 16,397 · -7.1%
- By 2075
- 15,012 · -14.9%
- By 2100
- 12,917 · -26.8%
Race, ethnicity, and origin ACS 2023
- Neighborhood character
- Majority Black (55%)
- Race & ethnicity
- Black 55% White 41% Two or more races 4% Hispanic / Latino 4%
- Common ancestry
- Scottish 2% Romanian 1% Lithuanian 1%
- Foreign-born
- 4% · Canada
- Languages at home
- 99% English-only · German/W. Germanic 1%
Political lean MEDSL · Westmoreland
- 2024 margin
- R (+14.3) · D 42.4% · R 56.7%
- 2008→2024 swing
- -24.5pp toward R · 2008: 10.2pp · 2024: -14.3pp
- All cycles
- 2024: R+14.3 2020: R+8.2 2016: R+7.3 2012: D+0.5 2008: D+10.2
Not yet ingested
- Civics
- —
Market trends
- HPI YoY
- ▲ 56.12%
- Current HPI
- 300.9225
- Rent YoY
- —
- Metro
- —
- State GDP YoY
- ▲ 2.97%
- F500 in state
- 12
Industry mix (Fortune 500 HQ in MD)
| Industry | F500 HQs | Revenue |
|---|---|---|
| Aerospace / Defense | 1 | $71B |
|
||
| Utilities | 1 | $25B |
|
||
| Hotels | 1 | $24B |
|
||
| Consumer Goods | 1 | $7B |
|
||
| Real Estate | 1 | $6B |
|
||
| Chemicals | 1 | $2B |
|
||
Price history
+93.2% since first listed15 events — show timeline
- 2026-06-02 Price Changed $399,985 REINMLS
- 2026-05-08 Listed $425,000 REINMLS
- 2026-05-02 Listed $425,000 REINMLS
- 2026-03-03 Listing Removed — BRIGHT MLS
- 2025-11-10 Listed $425,000 NNAR
- 2025-08-30 Listed $425,000 BRIGHT MLS
- 2025-08-25 Coming Soon — BRIGHT MLS
- 2023-06-21 Sold (Public Records) $345,000 Public Records
- 2023-06-16 Sold (MLS) $345,000 BRIGHT MLS
- 2023-05-22 Contingent — BRIGHT MLS
- 2023-04-22 Price Changed $354,900 BRIGHT MLS
- 2023-04-02 Price Changed $359,900 BRIGHT MLS
- 2023-03-16 Listed $369,900 BRIGHT MLS
- 2017-03-24 Sold (Public Records) $185,000 Public Records
- 2007-04-12 Sold (Public Records) $207,000 Public Records
Property tax history
+4.9%/yrLatest (2025): $1,866 · +0.0% YoY. Source: county tax records.
Cash-flow waterfall
monthlySold comps — $/sqft
last 12 mo · ≤1 miLoading sold comps…