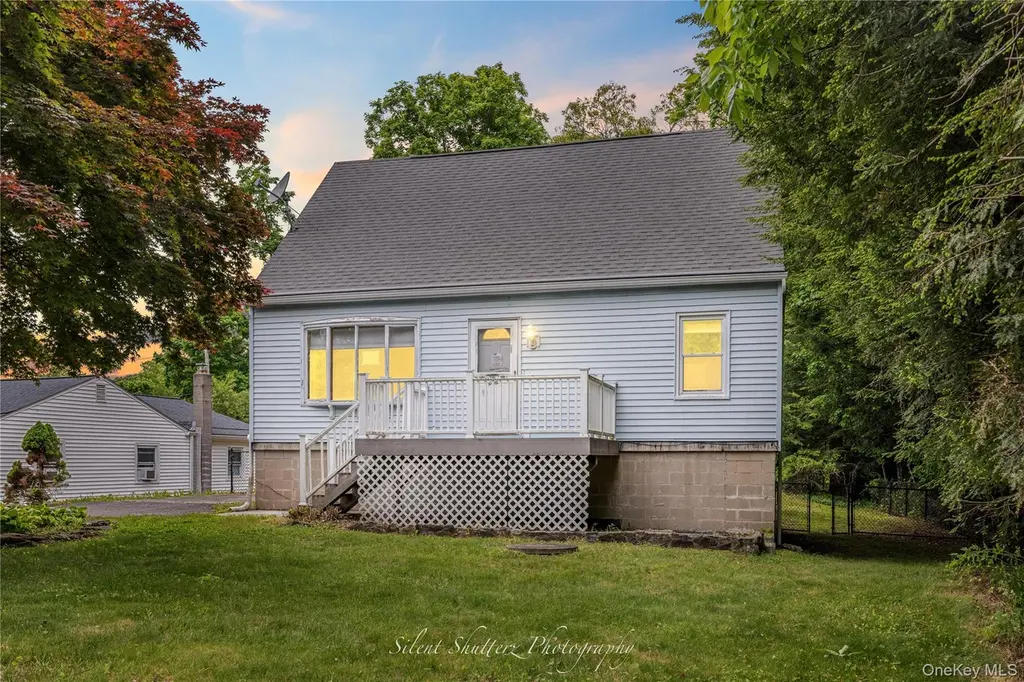
7 Hazel Dr · Putnam Lake, NY
Flood risk 1/10 · Minimal
- FEMA flood zone
- X (unshaded)
- Chance of flooding over 30 yrs
- 0.0%
- Est. flood insurance / yr
- $473 – $860
Fire risk 3/10 · Minor
- Est. fire insurance / yr
- $691 – $1,283
Heat risk 4/10 · Minor
- Hot days now (above 96°F)
- 7 days/yr
- Hot days in 30 yrs
- 15 days/yr
Wind risk 5/10 · Moderate
- Chance of severe wind over 30 yrs
- 26.0%
Air-quality risk 3/10 · Minor
- Unhealthy air days now
- 2 days/yr
- Unhealthy air days in 30 yrs
- 3 days/yr
Risk factors via First Street. Map © Google.
Why this score? — see what drove the C+ grade
The composite is a weighted blend of 9 inputs, each scored 0–100. Each bar is that input's sub-score; the figure is the points it added to the 100-point composite (weight × sub-score).
- Cash flow +20.5/30.0
- ARV discount +15.0/15.0
- 1% rule +7.2/10.0
- DSCR +6.5/10.0
- Schools +6.3/10.0
- Livability +3.3/5.0
- Rent growth +2.5/5.0
- Condition / age +2.5/5.0
- Appreciation +0.0/10.0
$329,900
🖨 Deal sheet 📄 Offer letter ✓ Due diligence
Listing remarks MLS
HUD OWNED, SOLD AS IS. SB MUST BE HUD APPROVED TO SUBMIT BID VIA INTERNET. CASE#374-293272, 203K, IF TERMITE TREATMENT NEEDED, AT BUYERS EXPENSE. BUYER TO VERIFY SCHOOLS & TAXES. WELL & SEPTIC NOT TESTED - INSPECTION NEEDED. CHARMING CAPE NEAR LAKE COMMUNITY.
Key facts
- Large flat lot
- 0.68 acre lot
- Built 1956
Tags
Property features AI
Exterior
- Parking: Driveway; No carport
- Utilities: Septic tank; Electricity available
- Home design: Single family residence
- Construction: Frame construction
- Exterior features: Frame construction; Not waterfront
Interior
- Kitchen: Range
- Bathrooms: 1 full bathroom; 1 half bathroom
- Heating & cooling: Baseboard heating; No central cooling
- Interior features: First-floor full bathroom; 6 total rooms; Full basement with walk-out access; No attic
Neighborhood map
What this means for you Summary
Snapshot
- This is a 4-bed/1.5-bath single-family listed at $330k.
Deal economics
- At list price, monthly cash flow is $435 ($5k/yr) — positive.
- The deal already cash-flows at list — no discount required.
- Meets the 1% rule at list price ($4k rent vs $330k).
- Recommended offer: $325k (1.5% below list) — sets the bar for market timing.
- Cap rate 7.9% vs local median 3.3% in Putnam Lake — top-decile yield for the area; either an underpriced asset or a hidden risk that comps aren't pricing in. Stress-test before assuming the spread holds.
Location & tenants
- Location reads 66/100 on livability (#654 in NY) — a middle-class / working-renter tenant base. Strengths: employment A+, housing A+, crime A; Watch: amenities F, commute F, cost of living F.
- Brewster Central School District (rural): math 73% / reading 68% proficiency, ranked #107 of 590 in NY (top 18%) — strong family-tenant draw, lease renewals of 3-5y typical; only 17% free/reduced lunch — higher-income household profile.
- Zoned schools: John F Kennedy Elementary School (599 students, 41% FRL); Henry H Wells Middle School (math 52% / reading 57%, grade B-, #214 of 729 statewide, top 31%, 668 students, 37% FRL); Brewster High School (math 95% / reading 92%, grade A+, #131 of 1,100 statewide, top 13%, 1,035 students, 36% FRL) — zoned schools average 38% FRL vs 17% district-wide (21 pts higher); higher-poverty schools than district average — tighter screening recommended.
- Market conditions: 49 active listings in the ZIP; 142 units permitted in Putnam County in 2024 (75 in 5+ unit buildings).
Forward outlook
- Local home prices are declining (-3.0%/yr); year-one equity from $2k of loan paydown is wiped out by about $10k of value loss. Plan a longer hold.
- Putnam County population projected to shrink 3% by 2050 — rents likely to lag national; underwrite the cash flow, not the appreciation.
Negotiation context
- It's been on market 19 days — a 2% lower offer ($325k) is reasonable based on typical stale-listing flexibility.
- 3 sale attempts since 23y ago with the ask held roughly flat each time — persistent listings suggest the price (not the market) is what's stuck; bring a comps-based counter.
- Current owner paid $210k; list at $330k implies a 57% gain — meaningful room to come down on a strong offer.
Risks & watch-outs
- Watch-outs: property tax is 3.1% of price; built in 1956 — expect roof / HVAC / electrical / plumbing capex.
- Climate carrying-cost: moderate wind risk, 26% chance of damaging wind over 30y — expect insurance premiums to compound above CPI over the hold.
Questions for the listing agent
- Built in 1956 — when were the roof, HVAC, electrical panel, plumbing, and water heater last replaced?
- Property tax is high relative to price — has the assessment been appealed recently, and will the sale trigger a re-assessment?
- Is there a deadline driving the sale (1031 exchange, divorce, estate, relocation)? That informs how much negotiation room exists.
- Schools are F-rated, which usually means shorter tenancies and higher turnover. Who's the typical renter profile here, and what's been the actual vacancy rate?
- What's the average days-on-market for RENTAL listings here right now (not sales)? A rising rental-DOM trend means longer vacancies and softer asking-rent achievability than the comps imply.
- What's the recent tenant-quality profile in this submarket — average credit score on applications, eviction rate, late-payment / NSF rate, and stable-employment percentage? A property-management company in the area should have these aggregated.
- How much new for-sale + rental construction is in the pipeline within 1–3 miles? Heavy new supply typically softens prices + rents 12–24 months out; constrained supply supports both.
Investment metrics
- 1% rule
- 1.22% ✓
- Cap rate
- 7.88%
- Cash-on-cash
- 5.66%
- DSCR
- 1.25
- GRM
- 6.9
CMA / ARV
- ARV (on-the-fly)
- $429,800
- Comps found
- 2
Show comp detail 2 sales within ~0.75 mi
| Address | Dist | Beds/Ba | Sqft | Sold | Price | $/sf | Match |
|---|---|---|---|---|---|---|---|
| 102 Haviland Dr | 0.47mi | 3/2.0 (-1) | 1,302 (-7%) | 18mo | $400,000 | $307 | 44 |
| 11 Orleans Rd | 0.69mi | 3/2.0 (-1) | 1,544 (+10%) | 6mo | $440,000 | $285 | 39 |
Match score weights: distance 35% · size 25% · config 20% · recency 20%. Top-matched comps best support the ARV.
Projected returns pro-forma
-3.0% appreciation · 3.0% rent growth · sell at horizon
- IRR
- -7.4%
- Equity multiple
- 0.73×
- Total profit
- $-25,387
- Equity at exit
- $49,189
- IRR
- 2.3%
- Equity multiple
- 1.16×
- Total profit
- $14,981
- Equity at exit
- $28,524
Cash invested: $92,372 (down + closing). Projections, not guarantees.
Landlord ↔ Tenant lean methodology
- Overall (STATE)
- 15 Strongly Tenant-Friendly
- State New York
- 15 Strongly Tenant-Friendly · D+10
- County
- — inherits STATE
- City
- — inherits STATE
ZIP-level market 12563
- Home prices YoY
- -12.7%
- Active inventory
- 49
- Price-to-rent
- 6.9×
Monthly cashflow live
- Estimated rent
- $4,011 medium interval (Pro) →
- Mortgage (P&I)
- −$1,730
- Tax from tax record
- −$866 /mo · $10,389/yr
- Insurance
- −$137
- HOA
- −$0
- Vacancy / Maint / Mgmt
- −$842
- Net cashflow
- $435
Break-even live
UW: 25.0% down · 7.5% · 30yr · 1.5% tax · 5.0% vac · 8.0% maint · 8.0% mgmt
Financing live
Cash to close
- Down payment
- $82,475
- Closing costs
- $9,897
- Reserves months
- —
- Total cash needed
- —
Loan-product check · same deal, 3 products live
Conventional
25% down · 7.5% · 30yr
- Down + closing
- —
- Monthly P&I
- —
- Monthly cashflow
- —
- DSCR
- —
- Eligible?
- —
Personal DTI + credit; lowest rate.
DSCR
20% down · 8.5% · 30yr
- Down + closing
- —
- Monthly P&I
- —
- Monthly cashflow
- —
- DSCR
- —
- Eligible?
- —
No personal income docs; deal must DSCR.
Hard money
10% down · 12.0% · 12mo
- Down + closing
- —
- Monthly P&I
- —
- Monthly cashflow
- —
- DSCR
- —
- Eligible?
- —
Short-term bridge; refi at stabilization.
Listing history 17 events
-
2026-06-13statusdays on market $329,900 Pending 19 DOM
-
2026-06-10days on market $329,900 Active 18 DOM
-
2026-06-09days on market $329,900 Active 17 DOM
-
2026-06-08days on market $329,900 Active 16 DOM
-
2026-06-07days on market $329,900 Active 15 DOM
-
2026-06-03days on market $329,900 Active 11 DOM
-
2026-06-03days on market $329,900 Active 10 DOM
-
2026-06-01days on market $329,900 Active 9 DOM
-
2026-05-31days on market $329,900 Active 8 DOM
-
2026-05-22$329,900 Active
-
2013-12-18price $195,000 272-char remark
Show marketing remark (272 chars)
HUD OWNED, SOLD AS IS. SB MUST BE HUD APPROVED TO SUBMIT BID VIA INTERNET. CASE#374-293272, 203K, IF TERMITE TREATMENT NEEDED, AT BUYERS EXPENSE. BUYER TO VERIFY SCHOOLS & TAXES. WELL & SEPTIC NOT TESTED - INSPECTION NEEDED. CHARMING CAPE NEAR LAKE COMMUNITY.
-
2008-05-02historical
-
2008-01-30
-
2003-09-10soldstatus $210,000 272-char remark
Show marketing remark (272 chars)
HUD OWNED, SOLD AS IS. SB MUST BE HUD APPROVED TO SUBMIT BID VIA INTERNET. CASE#374-293272, 203K, IF TERMITE TREATMENT NEEDED, AT BUYERS EXPENSE. BUYER TO VERIFY SCHOOLS & TAXES. WELL & SEPTIC NOT TESTED - INSPECTION NEEDED. CHARMING CAPE NEAR LAKE COMMUNITY.
-
2003-05-29historical 272-char remark
Show marketing remark (272 chars)
HUD OWNED, SOLD AS IS. SB MUST BE HUD APPROVED TO SUBMIT BID VIA INTERNET. CASE#374-293272, 203K, IF TERMITE TREATMENT NEEDED, AT BUYERS EXPENSE. BUYER TO VERIFY SCHOOLS & TAXES. WELL & SEPTIC NOT TESTED - INSPECTION NEEDED. CHARMING CAPE NEAR LAKE COMMUNITY.
-
2003-05-15$210,000 272-char remark
Show marketing remark (272 chars)
HUD OWNED, SOLD AS IS. SB MUST BE HUD APPROVED TO SUBMIT BID VIA INTERNET. CASE#374-293272, 203K, IF TERMITE TREATMENT NEEDED, AT BUYERS EXPENSE. BUYER TO VERIFY SCHOOLS & TAXES. WELL & SEPTIC NOT TESTED - INSPECTION NEEDED. CHARMING CAPE NEAR LAKE COMMUNITY.
-
1999-02-04soldstatus $154,000
ⓘ Source: listings_history table (triggers on properties + properties_extension) + one-shot
backfill from property_details.listing_events for pre-trigger history.
Tax reassessment forecast NY · Partial reset (capped growth)
- Current annual tax
- $10,389 · $866/mo
- Projected year-2 tax
- $10,389 · $866/mo
- Expected delta
- $0/yr ($0/mo · 0.0%)
ⓘ Screening estimate from a state-policy table — verify with the county assessor before closing.
Climate risk First Street
- Flood 1/10 Low FEMA zone X (unshaded) · 0% chance over 30 yrs
- Wildfire 3/10 Moderate
- Heat 4/10 Moderate 7 d/yr ≥96°F today · 15 d/yr by 30 yrs out
- Wind 5/10 Major 26% chance of damaging wind over 30 yrs
- Air quality 3/10 Moderate 2 unhealthy d/yr today · 3 by 30 yrs out
Nearby sold comps map
Loading sold comps map…
Walkable amenities ~0.75 mi
Loading nearby amenities…
Taxation est. · year 1
- Rental income
- $48,132
- − Mortgage interest
- −$18,480
- − Property taxes
- −$10,389
- − Insurance
- −$1,650
- − Repairs & maintenance
- −$3,851
- − Management
- −$3,851
- − Depreciation
- −$9,597
- Taxable income
- $315
- Est. tax owed @ 24.0%
- −$76
- After-tax cash flow
- $5,149/yr
For passive investors: Depreciation is non-cash, so a rental often shows a tax loss while cash-flowing — sheltering income. Rental losses are passive: they offset passive income freely, and up to $25,000/yr can offset ordinary (W-2) income if you actively participate and your MAGI is under $100k (phasing out to $0 by $150k); unused losses carry forward. On sale, claimed depreciation is recaptured at up to 25%, and gains may owe capital-gains tax (a 1031 exchange can defer both). Figures are a year-1 estimate at your 24.0% rate — not tax advice; consult a CPA.
Schools (NCES district)
- District
- Brewster Central School District
- NCES district ID
- 3605310
- Math proficiency
- 73% ▲ 20.00%
- Reading proficiency
- 68% ▲ 20.00%
- Median HH income
- $87,515
- Composite
- 63.4/100
- National rank
- #622
- State rank
- #107 of 590 in NY
Livability — Putnam Lake
- Score
- 66/100
- State rank
- #654
- US rank
- #12186
Category grades
Schools grade is shown separately in the Schools card above.
Census & demographics
- Census place
- Putnam Lake, NY
- Population (ZIP)
- 7,456
Population outlook (Putnam County) Hauer SSP2
- Today (2025)
- 99,705 people
- By 2030
- 99,650 · -0.1%
- By 2040
- 98,641 · -1.1%
- By 2050
- 96,348 · -3.4%
- By 2075
- 94,412 · -5.3%
- By 2100
- 88,728 · -11.0%
Race, ethnicity, and origin ACS 2023
- Neighborhood character
- Predominantly White (69%)
- Race & ethnicity
- White 69% Hispanic / Latino 17% Black 9% Two or more races 6% Asian 2%
- Hispanic origin (detail)
- Mexican 4% Puerto Rican 3% Cuban 1% Dominican 3%
- Common ancestry
- Romanian 5% Portuguese 2% Slovak 1%
- Foreign-born
- 14% · Canada, South Korea, Dominican Republic
- Languages at home
- 79% English-only · Spanish 12% Other Indo-European 3% Russian/Polish/Slavic 2%
Political lean MEDSL · Putnam
- 2024 margin
- R (+13.7) · D 43.2% · R 56.8%
- 2008→2024 swing
- -6.2pp toward R · 2008: -7.5pp · 2024: -13.7pp
- All cycles
- 2024: R+13.7 2020: R+7.9 2016: R+17.8 2012: R+11.2 2008: R+7.5
Not yet ingested
- Civics
- —
Market trends
- HPI YoY
- ▼ -36.07%
- Current HPI
- 247.1582
- Rent YoY
- —
- Metro
- —
- State GDP YoY
- ▲ 2.60%
- F500 in state
- 92
Industry mix (Fortune 500 HQ in NY)
| Industry | F500 HQs | Revenue |
|---|---|---|
| Financial Services | 10 | $950B |
|
||
| Consumer Goods | 9 | $162B |
|
||
| Insurance | 4 | $225B |
|
||
| Telecommunications | 2 | $144B |
|
||
| Pharmaceuticals | 2 | $112B |
|
||
| Media / Entertainment | 2 | $69B |
|
||
Price history
+114.2% since first listed8 events — show timeline
- 2026-05-22 Listed $329,900 OneKey® MLS as Distributed by MLS Grid
- 2013-12-18 Price Changed $195,000 HGMLS
- 2008-05-02 Delisted — HGMLS
- 2008-01-30 Listed — HGMLS
- 2003-09-10 Sold (MLS) $210,000 HGMLS
- 2003-05-29 Delisted — HGMLS
- 2003-05-15 Listed $210,000 HGMLS
- 1999-02-04 Sold (Public Records) $154,000 Public Records
Property tax history
+9.8%/yrLatest (2025): $10,389 · +1.1% YoY. Source: county tax records.
Cash-flow waterfall
monthlySold comps — $/sqft
last 12 mo · ≤1 miLoading sold comps…