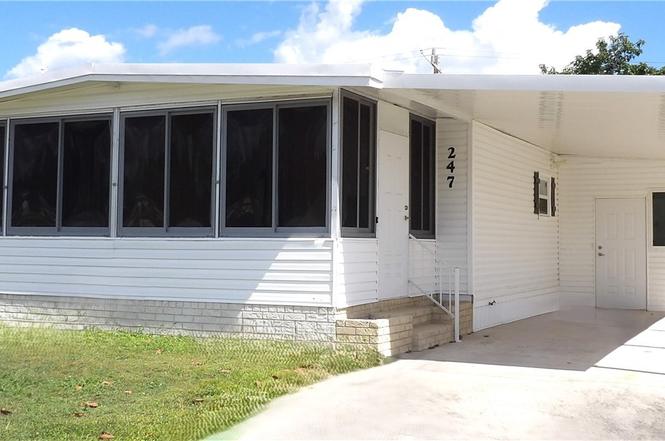
247 Shrub Ln N · North Fort Myers, FL
Flood risk 4/10 · Minor
- FEMA flood zone
- AE
- Chance of flooding over 30 yrs
- 0.2%
- Est. flood insurance / yr
- $1,737 – $8,500
Fire risk 2/10 · Minimal
- Est. fire insurance / yr
- $947 – $1,759
Heat risk 10/10 · Severe
- Hot days now (above 107°F)
- 7 days/yr
- Hot days in 30 yrs
- 30 days/yr
Wind risk 10/10 · Severe
- Chance of severe wind over 30 yrs
- 99.0%
Air-quality risk 2/10 · Minimal
- Unhealthy air days now
- 1 days/yr
- Unhealthy air days in 30 yrs
- 1 days/yr
Risk factors via First Street. Map © Google.
Why this score? — see what drove the B+ grade
The composite is a weighted blend of 9 inputs, each scored 0–100. Each bar is that input's sub-score; the figure is the points it added to the 100-point composite (weight × sub-score).
- Cash flow +30.0/30.0
- ARV discount +15.0/15.0
- 1% rule +10.0/10.0
- DSCR +10.0/10.0
- Schools +4.1/10.0
- Livability +3.7/5.0
- Rent growth +3.2/5.0
- Condition / age +2.5/5.0
- Appreciation +0.0/10.0
$99,000
🖨 Deal sheet 📄 Offer letter ✓ Due diligence
Listing remarks
WELCOME HOME to your Florida retreat! This beautiful, spacious and turkey home includes 2-bedroom, 2 full baths, new AC unit, in a desirable 55+ community. The kitchen is open and bright, including a nice size panty and a breakfast bar. The living room and dining area offers an inviting atmosphere, perfect for relaxing or entertaining guests. The Sunroom/Lanai room offers additional living space for entertaining or to just sit and enjoy the beautiful Florida weather. The primary bedroom is large enough to accommodate a king-size bed and features two large walk-in closets. The guest bedroom is also a comfortably size, ensuring privacy and comfort for your visitors. Come and enjoy the comfort
Key facts
- New ac unit
- Sunroom lanai room
- Clubhouse
Tags
Property features AI
Finance
- Financial info: Pets not allowed
- HOA & community: Homeowners association with monthly fee; Association fee includes internet and trash; Community amenities: clubhouse, pool, bocce court, pickleball, shuffleboard, billiard room, billiards, sauna, dog park; Street lights; Senior community; Community contains 436 units
Exterior
- Parking: Attached carport with 2 covered spaces
- Security: Security guard; Smoke detectors
- Utilities: Public water; Public sewer; High speed internet available; Cable not available
- Home design: Manufactured home with vinyl siding; Single-story; Resale property; Faces west; Zoned MH-1
- Construction: Metal roof and rolled/hot mop roofing; Manufactured construction; Vinyl siding
- Exterior features: Storage; Manual shutters; Awnings; Lanai; Porch; Screened porch; Community pool; Paved road access; Rectangular lot on a cul-de-sac/dead end; East exposure
Interior
- Kitchen: Electric cooktop; Microwave; Dishwasher; Refrigerator
- Bedrooms: Includes Florida room; Includes screened porch
- Flooring: Carpet; Laminate
- Bathrooms: 2 full bathrooms
- Heating & cooling: Central heating (electric); Central air conditioning (electric)
- Interior features: Breakfast bar; Kitchen island; Open living/dining area; Separate shower; Shower-only bath; Window coverings; Window treatments; High speed internet available; Furnished
- Laundry & utility: Washer; Dryer; Laundry tub
Neighborhood map
What this means for you Summary
Snapshot
- This is a 2-bed/2.0-bath manufactured listed at $99k.
Deal economics
- At list price, monthly cash flow is $66 ($792/yr) — positive.
- The deal already cash-flows at list — no discount required.
- Meets the 1% rule at list price ($2k rent vs $99k).
- Recommended offer: $87k (12.0% below list) — sets the bar for market timing.
- Cap rate 12.3% vs local median 3.6% in North Fort Myers — top-decile yield for the area; either an underpriced asset or a hidden risk that comps aren't pricing in. Stress-test before assuming the spread holds.
Location & tenants
- Location reads 74/100 on livability (#269 in FL, #4,409 nationally) — a middle-class / working-renter tenant base. Strengths: cost of living A+, housing A+, health & safety A+; Watch: employment C-, amenities F, commute F.
- Lee (suburban): math 47% / reading 50% proficiency, ranked #42 of 73 in FL (top 58%) — families likely to look elsewhere, expect single-tenant / working-renter base with shorter leases.
- Market conditions: Rents rising (+2.6%/yr); 841 active listings in the ZIP; 40 comparable units currently listed for rent nearby; rentals at typical pace (median 24d on market — plan ~3-4 weeks tenant-placement turnaround); 15,411 units permitted in Lee County in 2024 (4,686 in 5+ unit buildings).
- This rent runs 33% of the median local income ($55k/yr) — at the standard rent-burdened threshold; future hikes will face affordability resistance.
Forward outlook
- Local home prices are declining (-3.0%/yr); year-one equity from $684 of loan paydown is wiped out by about $3k of value loss. Plan a longer hold.
- Lee County population projected at +44% by 2050 — long-run rental-demand tailwind backs the buy-and-hold thesis.
Negotiation context
- It's been on market 220 days — a 12% lower offer ($87k) is reasonable based on typical stale-listing flexibility.
- 2 sale attempts since 2y ago; this cycle's ask has dropped $46k (32%) from the opening price — seller is motivated, your offer sets the floor, not the list.
- Current owner paid $36k; list at $99k implies a 171% gain — meaningful room to come down on a strong offer.
Risks & watch-outs
- Watch-outs: flood insurance adds $427/mo.
- Climate carrying-cost: in FEMA flood zone AE (mandatory federal flood insurance); severe wind risk, 99% chance of damaging wind over 30y; extreme-heat days projected 7→30/yr by 2055 (HVAC capex compounding) — expect insurance premiums to compound above CPI over the hold.
Questions for the listing agent
- It's been on market 220 days. Have you received any prior offers? Is the seller open to a 12% concession, seller financing, or rate buy-down credit?
- Built in 1974 — when were the roof, HVAC, electrical panel, plumbing, and water heater last replaced?
- What's the actual annual flood-insurance premium (NFIP or private), and is the property in a SFHA with mandatory coverage?
- What does the HOA fee cover, when was the last increase, and are there any pending special assessments or reserve-fund shortfalls?
- Why hasn't it sold? Are there any deal-killer items the seller is aware of (foundation, flood, title, zoning, code violations)?
- Is there a deadline driving the sale (1031 exchange, divorce, estate, relocation)? That informs how much negotiation room exists.
- What's the average days-on-market for RENTAL listings here right now (not sales)? A rising rental-DOM trend means longer vacancies and softer asking-rent achievability than the comps imply.
- What's the recent tenant-quality profile in this submarket — average credit score on applications, eviction rate, late-payment / NSF rate, and stable-employment percentage? A property-management company in the area should have these aggregated.
- How much new for-sale + rental construction is in the pipeline within 1–3 miles? Heavy new supply typically softens prices + rents 12–24 months out; constrained supply supports both.
Investment metrics
- 1% rule
- 1.54% ✓
- Cap rate
- 12.26%
- Cash-on-cash
- 21.32%
- DSCR
- 1.95
- GRM
- 5.4
CMA / ARV
- ARV (on-the-fly)
- $134,784
- Comps found
- 4
Show comp detail 4 sales within ~0.75 mi
| Address | Dist | Beds/Ba | Sqft | Sold | Price | $/sf | Match |
|---|---|---|---|---|---|---|---|
| 349 Shrub Ln S | 0.09mi | 2/2.0 | 1,144 (-1%) | 7mo | $110,000 | $96 | 88 |
| 7580 Marx Dr | 0.27mi | 2/2.0 | 1,176 (+2%) | 5mo | $138,000 | $117 | 80 |
| 734 Knotty Pine Cir | 0.40mi | 2/2.0 | 1,152 (0%) | 3mo | $148,000 | $128 | 79 |
| 558 Freedom St | 0.71mi | 2/2.0 | 1,182 (+3%) | 14mo | $117,000 | $99 | 50 |
Match score weights: distance 35% · size 25% · config 20% · recency 20%. Top-matched comps best support the ARV.
Projected returns pro-forma
-3.0% appreciation · 2.63% rent growth · sell at horizon
- IRR
- -12.1%
- Equity multiple
- 0.56×
- Total profit
- $-12,104
- Equity at exit
- $14,761
- IRR
- -3.4%
- Equity multiple
- 0.78×
- Total profit
- $-6,207
- Equity at exit
- $8,560
Cash invested: $27,720 (down + closing). Projections, not guarantees.
Landlord ↔ Tenant lean methodology
- Overall (STATE)
- 87 Strongly Landlord-Friendly
- State Florida
- 87 Strongly Landlord-Friendly · R+3
- County
- — inherits STATE
- City
- — inherits STATE
ZIP-level market 33917
- Home prices YoY
- -30.2%
- Rents YoY
- 2.6%
- Active inventory
- 841
- Price-to-rent
- 5.4×
Monthly cashflow live
- Estimated rent
- $1,520 high interval (Pro) →
- Mortgage (P&I)
- −$519
- Tax from tax record
- −$26 /mo · $313/yr
- Insurance
- −$41
- Flood insurance flood zone
- −$427 /mo · $5,118/yr
- HOA
- −$122
- Vacancy / Maint / Mgmt
- −$319
- Net cashflow
- $66
Break-even live
UW: 25.0% down · 7.5% · 30yr · 1.5% tax · 5.0% vac · 8.0% maint · 8.0% mgmt
Financing live
Cash to close
- Down payment
- $24,750
- Closing costs
- $2,970
- Reserves months
- —
- Total cash needed
- —
Loan-product check · same deal, 3 products live
Conventional
25% down · 7.5% · 30yr
- Down + closing
- —
- Monthly P&I
- —
- Monthly cashflow
- —
- DSCR
- —
- Eligible?
- —
Personal DTI + credit; lowest rate.
DSCR
20% down · 8.5% · 30yr
- Down + closing
- —
- Monthly P&I
- —
- Monthly cashflow
- —
- DSCR
- —
- Eligible?
- —
No personal income docs; deal must DSCR.
Hard money
10% down · 12.0% · 12mo
- Down + closing
- —
- Monthly P&I
- —
- Monthly cashflow
- —
- DSCR
- —
- Eligible?
- —
Short-term bridge; refi at stabilization.
Rent comps 40 comps
| Address | Beds | Baths | Sqft | Rent | $/sqft | DOM | Units | Dist |
|---|---|---|---|---|---|---|---|---|
| 947 Strongbox Ln North Fort Myers, FL | 2.0 | 2.0 | 1000 | $1,300 | $1.30 | 23d | 1 | 0.38mi |
| 16363 Teresa Ln North Fort Myers, FL | 2.0 | 1.0 | 1000 | $1,000 | $1.00 | 23d | 1 | 0.72mi |
| 280 Flame Ln North Fort Myers, FL | 2.0 | 2.0 | 980 | $1,350 | $1.38 | 3d | 1 | 0.75mi |
| 1439 Glick Dr North Fort Myers, FL | 3.0 | 1.0 | 1134 | $1,500 | $1.32 | 2d | 1 | 0.76mi |
| 7622 Peyraud Dr North Fort Myers, FL | 3.0 | 2.0 | 1404 | $1,350 | $0.96 | 23d | 1 | 0.79mi |
| 1846 Powell Dr Unit 28 North Fort Myers, FL | 1.0 | 1.0 | 850 | $1,500 | $1.76 | 3d | 1 | 0.84mi |
| 106 Gaslight Ave North Fort Myers, FL | 2.0 | 2.0 | 1056 | $1,400 | $1.33 | 3d | 1 | 0.86mi |
| 137 Lantern Pl Unit A North Fort Myers, FL | 2.0 | 1.0 | 1080 | $1,200 | $1.11 | 3d | 1 | 0.88mi |
| 2500 Gail Helen Ct North Fort Myers, FL | 3.0 | 2.0 | 1296 | $1,500 | $1.16 | 23d | 1 | 0.91mi |
| 5701 Longleaf Dr North Fort Myers, FL | 2.0 | 2.0 | 1233 | $1,570 | $1.27 | 12d | 1 | 0.91mi |
| 15427 Crystal Lake Dr North Fort Myers, FL | 2.0 | 2.0 | 1021 | $3,200 | $3.13 | 23d | 1 | 0.93mi |
| 7050 Nantucket Cir North Fort Myers, FL | 2.0 | 2.0 | 950 | $3,000 | $3.16 | 23d | 1 | 1.04mi |
| 7050 Nantucket Cir #6 North Fort Myers, FL | 2.0 | 2.0 | 950 | $3,000 | $3.16 | 16d | 1 | 1.04mi |
| 226 Lamplighter Ln North Fort Myers, FL | 2.0 | 1.0 | 900 | $899 | $1.00 | 23d | 1 | 1.06mi |
| 234 Lamplighter Ln North Fort Myers, FL | 2.0 | 2.0 | 864 | $895 | $1.04 | 14d | 1 | 1.06mi |
| 15610 Crystal Lake Dr #101 North Fort Myers, FL | 2.0 | 2.0 | 998 | $1,900 | $1.90 | 23d | 1 | 1.07mi |
| 15610 Crystal Lake Dr North Fort Myers, FL | 2.0 | 2.0 | 968 | $1,850 | $1.91 | 23d | 1 | 1.07mi |
| 2027 Eloise Cir North Fort Myers, FL | 2.0 | 1.0 | 822 | $1,300 | $1.58 | 3d | 1 | 1.14mi |
| 5707 Foxlake Dr #2 North Fort Myers, FL | 2.0 | 2.0 | 1114 | $1,500 | $1.35 | 23d | 1 | 1.16mi |
| 1275 Gramac Dr North Fort Myers, FL | 3.0 | 2.0 | 1013 | $1,575 | $1.55 | 23d | 1 | 1.18mi |
| 1275 Gramac Dr North Fort Myers, FL | 3.0 | 2.0 | 1013 | $1,550 | $1.53 | 3d | 1 | 1.18mi |
| 2095 Eloise Cir North Fort Myers, FL | 2.0 | 1.0 | 840 | $1,295 | $1.54 | 23d | 1 | 1.19mi |
| 4120 Pine Drop Ln North Fort Myers, FL | 3.0 | 2.0 | 957 | $1,895 | $1.98 | 23d | 1 | 1.19mi |
| 5713 Foxlake Dr #5 North Fort Myers, FL | 2.0 | 2.0 | 830 | $1,400 | $1.69 | 19d | 1 | 1.19mi |
| 257 Poe Ave North Fort Myers, FL | 2.0 | 1.0 | 870 | $1,175 | $1.35 | 3d | 1 | 1.21mi |
| 15250 Riverbend Blvd #204 North Fort Myers, FL | 2.0 | 2.0 | 1429 | $1,600 | $1.12 | 21d | 1 | 1.24mi |
| 1916 Flamingo Dr North Fort Myers, FL | 2.0 | 1.0 | 852 | $1,250 | $1.47 | 3d | 1 | 1.26mi |
| 1916 Flamingo Dr North Fort Myers, FL | 2.0 | 1.0 | 852 | $1,275 | $1.50 | 23d | 1 | 1.26mi |
| 8028 Breeze Dr North Fort Myers, FL | 2.0 | 1.0 | 750 | $850 | $1.13 | 23d | 1 | 1.27mi |
| 69 E Mariana Ave Unit B North Fort Myers, FL | 3.0 | 1.0 | 1000 | $1,795 | $1.79 | 3d | 1 | 1.28mi |
| 248 Stockton St North Fort Myers, FL | 3.0 | 2.0 | 924 | $1,300 | $1.41 | 23d | 1 | 1.29mi |
| 247 Stockton St North Fort Myers, FL | 3.0 | 2.0 | 924 | $1,325 | $1.43 | 23d | 1 | 1.31mi |
| 112 Crescent Lake Dr North Fort Myers, FL | 2.0 | 1.0 | 980 | $1,700 | $1.73 | 23d | 1 | 1.32mi |
| 260 Stockton St North Fort Myers, FL | 2.0 | 2.0 | 924 | $1,200 | $1.30 | 3d | 1 | 1.32mi |
| 15020 Caspian Tern Ct Unit 103 North Fort Myers, FL | 2.0 | 2.5 | 1286 | $1,600 | $1.24 | 23d | 1 | 1.36mi |
| 2774 Wedgewood Dr North Fort Myers, FL | 2.0 | 2.0 | 880 | $1,300 | $1.48 | 23d | 1 | 1.37mi |
| 8146 Tolles Dr North Fort Myers, FL | 2.0 | 1.0 | 784 | $850 | $1.08 | 23d | 1 | 1.39mi |
| 15050 Caspian Tern Ct #103 North Fort Myers, FL | 2.0 | 2.5 | 1365 | $1,520 | $1.11 | 23d | 1 | 1.43mi |
| 17499 Monte Isola Way Unit 17499 North Fort Myers, FL | 3.0 | 2.5 | 1405 | $1,800 | $1.28 | 14d | 1 | 1.43mi |
| 15100 Caspian Tern Ct North Fort Myers, FL | 2.0 | 2.5 | 1365 | $1,595 | $1.17 | 23d | 1 | 1.44mi |
HOA detail
- Monthly dues
- $122 · $1,464/yr
Listing history 21 events
-
2026-06-17days on market $99,000 Active 220 DOM
-
2026-06-16days on market $99,000 Active 219 DOM
-
2026-06-16days on market $99,000 Active 218 DOM
-
2026-06-13days on market $99,000 Active 216 DOM
-
2026-06-09days on market $99,000 Active 212 DOM
-
2026-06-07days on market $99,000 Active 210 DOM
-
2026-06-02days on market $99,000 Active 205 DOM
-
2026-06-01days on market $99,000 Active 204 DOM
-
2026-06-01pricedays on market $99,000 Active 203 DOM
-
2026-04-29price $109,000
-
2026-04-03price $115,000
-
2026-02-28price $125,000
-
2026-02-01price $135,000
-
2025-11-08$144,900 Active
-
2025-07-11historical
-
2025-05-10price $145,000
-
2025-02-24price $155,000
-
2025-02-11price $165,000
-
2024-11-01$175,000 Active
-
1996-11-18soldstatus $36,500
-
1996-10-24soldstatus $36,500
ⓘ Source: listings_history table (triggers on properties + properties_extension) + one-shot
backfill from property_details.listing_events for pre-trigger history.
Tax reassessment forecast FL · Resets to sale price
- Current annual tax
- $313 · $26/mo
- Projected year-2 tax
- $822 · $68/mo
- Expected delta
- +$509/yr (+$42/mo · 162.9%)
ⓘ Screening estimate from a state-policy table — verify with the county assessor before closing.
Climate risk First Street
- Flood 4/10 Moderate FEMA zone AE · 20% chance over 30 yrs
- Wildfire 2/10 Low
- Heat 10/10 Extreme 7 d/yr ≥107°F today · 30 d/yr by 30 yrs out
- Wind 10/10 Extreme 99% chance of damaging wind over 30 yrs
- Air quality 2/10 Low 1 unhealthy d/yr today · 1 by 30 yrs out
Nearby sold comps map
Loading sold comps map…
Walkable amenities ~0.75 mi
Loading nearby amenities…
Taxation est. · year 1
- Rental income
- $18,243
- − Mortgage interest
- −$5,546
- − Property taxes
- −$313
- − Insurance
- −$5,614
- − Repairs & maintenance
- −$1,459
- − Management
- −$1,459
- − HOA
- −$1,464
- − Depreciation
- −$2,880
- Taxable loss
- −$492
- Est. tax savings @ 24.0%
- +$118
- After-tax cash flow
- $910/yr
For passive investors: Depreciation is non-cash, so a rental often shows a tax loss while cash-flowing — sheltering income. Rental losses are passive: they offset passive income freely, and up to $25,000/yr can offset ordinary (W-2) income if you actively participate and your MAGI is under $100k (phasing out to $0 by $150k); unused losses carry forward. On sale, claimed depreciation is recaptured at up to 25%, and gains may owe capital-gains tax (a 1031 exchange can defer both). Figures are a year-1 estimate at your 24.0% rate — not tax advice; consult a CPA.
Schools (NCES district)
- District
- Lee
- NCES district ID
- 1201080
- Math proficiency
- 47% ▼ -11.00%
- Reading proficiency
- 50% ▼ -4.00%
- Median HH income
- $49,518
- Composite
- 41.49/100
- National rank
- #3458
- State rank
- #42 of 73 in FL
Livability — North Fort Myers
- Score
- 74/100
- State rank
- #269
- US rank
- #4409
Category grades
Schools grade is shown separately in the Schools card above.
Census & demographics
- Census place
- North Fort Myers, FL
- County
- Lee County · 788,662 people
- City population
- 57,035
- Metro
- Cape Coral-Fort Myers, FL
- Population (ZIP)
- 33,380
- Household income
- $55,000
- Rent vs Own
- Severe rent burden
- 775.0
Population outlook (Lee County) Hauer SSP2
- Today (2025)
- 871,946 people
- By 2030
- 955,468 · +9.6%
- By 2040
- 1,113,587 · +27.7%
- By 2050
- 1,256,891 · +44.1%
- By 2075
- 1,560,270 · +78.9%
- By 2100
- 1,726,848 · +98.0%
Race, ethnicity, and origin ACS 2023
- Neighborhood character
- Predominantly White (85%)
- Race & ethnicity
- White 85% Hispanic / Latino 10% Two or more races 7% Asian 1% Black 1%
- Hispanic origin (detail)
- Mexican 2% Puerto Rican 1% Cuban 3%
- Common ancestry
- Lithuanian 3% Romanian 3% Slovak 2%
- Foreign-born
- 10% · Canada
- Languages at home
- 88% English-only · Spanish 9% Other Indo-European 1% Russian/Polish/Slavic 1%
Political lean MEDSL · Lee
- 2024 margin
- Strong R (+28.4) · D 35.5% · R 63.9%
- 2008→2024 swing
- -18.0pp toward R · 2008: -10.4pp · 2024: -28.4pp
- All cycles
- 2024: R+28.4 2020: R+19.2 2016: R+20.4 2012: R+16.6 2008: R+10.4
Not yet ingested
- Civics
- —
Market trends
- HPI YoY
- ▼ -122.28%
- Current HPI
- 282.2895
- Rent YoY
- ▲ 2.63%
- Metro
- Cape Coral-Fort Myers, FL
- State GDP YoY
- ▲ 3.28%
- F500 in state
- 36
Industry mix (Fortune 500 HQ in FL)
| Industry | F500 HQs | Revenue |
|---|---|---|
| Industrial Technology | 2 | $29B |
|
||
| Insurance | 2 | $17B |
|
||
| Retail | 1 | $60B |
|
||
| Technology Distribution | 1 | $58B |
|
||
| Homebuilding | 1 | $35B |
|
||
| Technology Manufacturing | 1 | $35B |
|
||
Price history
+198.6% since first listed12 events — show timeline
- 2026-04-29 Price Changed $109,000 FORTMLS
- 2026-04-03 Price Changed $115,000 FORTMLS
- 2026-02-28 Price Changed $125,000 FORTMLS
- 2026-02-01 Price Changed $135,000 FORTMLS
- 2025-11-08 Listed $144,900 FORTMLS
- 2025-07-11 Listing Removed — FORTMLS
- 2025-05-10 Price Changed $145,000 FORTMLS
- 2025-02-24 Price Changed $155,000 FORTMLS
- 2025-02-11 Price Changed $165,000 FORTMLS
- 2024-11-01 Listed $175,000 FORTMLS
- 1996-11-18 Sold (Public Records) $36,500 Public Records
- 1996-10-24 Sold (Public Records) $36,500 Public Records
Property tax history
+2.0%/yrLatest (2025): $313 · +6.5% YoY. Source: county tax records.
Cash-flow waterfall
monthlySold comps — $/sqft
last 12 mo · ≤1 miLoading sold comps…