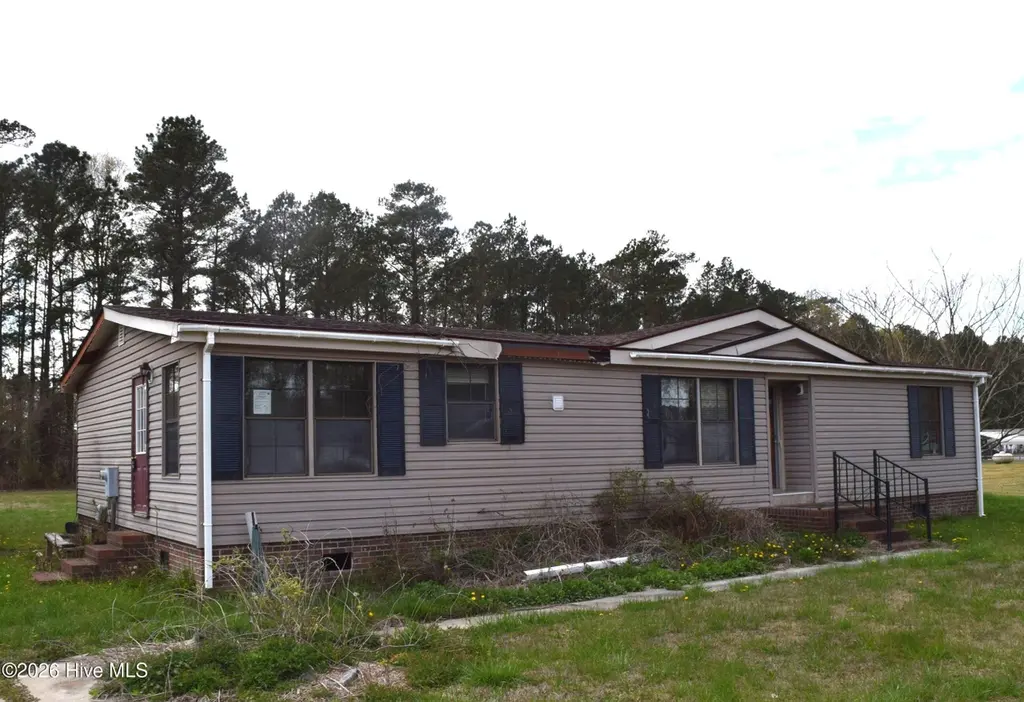
3029 Crystal Lake Dr · South Mills, NC
Flood risk 1/10 · Minimal
- FEMA flood zone
- X (unshaded)
- Chance of flooding over 30 yrs
- 0.0%
- Est. flood insurance / yr
- $507 – $1,088
Fire risk 3/10 · Minor
- Est. fire insurance / yr
- $906 – $1,684
Heat risk 9/10 · Severe
- Hot days now (above 107°F)
- 7 days/yr
- Hot days in 30 yrs
- 17 days/yr
Wind risk 8/10 · Major
- Chance of severe wind over 30 yrs
- 80.0%
Air-quality risk 1/10 · Minimal
- Unhealthy air days now
- 0 days/yr
- Unhealthy air days in 30 yrs
- 0 days/yr
Risk factors via First Street. Map © Google.
Why this score? — see what drove the C grade
The composite is a weighted blend of 9 inputs, each scored 0–100. Each bar is that input's sub-score; the figure is the points it added to the 100-point composite (weight × sub-score).
- Cash flow +24.4/30.0
- DSCR +7.9/10.0
- ARV discount +7.5/15.0
- 1% rule +5.2/10.0
- Rent growth +3.5/5.0
- Livability +2.9/5.0
- Condition / age +2.5/5.0
- Schools +2.4/10.0
- Appreciation +0.0/10.0
$159,900
🖨 Deal sheet 📄 Offer letter ✓ Due diligence
Listing remarks
PRICES REDUCED. INVESTOR OPPORTUNITY. . Discover the potential of 3029 Crystal Lake Drive in Elizabeth City, NC. This three-bedroom, two-bathroom home offers a canvas for your unique vision. With 1,456 square feet of space, there's room to create a living environment that suits your needs and aspirations. Situated on a generous 0.66-acre lot, this property serves as a peaceful retreat with easy access to the conveniences of Elizabeth City and the Norfolk Navy base. Whether you're commuting or exploring nearby attractions, you can enjoy the best of both worlds - a serene home base and proximity to city life. This home invites you to tailor its spaces to match your lifestyle. Imagine crafting
Key facts
- 0.66-acre lot
- Peaceful retreat
- 0.66 acre lot
Tags
Property features AI
Finance
- Other: Zoning: R-15
- HOA & community: No association amenities listed
Exterior
- Parking: Concrete parking; No garage
- Utilities: Public water; Water connected; Septic tank sewer
- Home design: Manufactured home; One story
- Construction: Vinyl siding; Shingle/composition roof; Built with crawl space foundation
- Exterior features: No notable exterior features listed; No patio or porch; No fencing; Has a view
Interior
- Flooring: Carpet; Laminate
- Bathrooms: 2 full bathrooms
- Heating & cooling: Heat pump heating; Electric heating; Heat pump cooling
- Interior features: Vaulted ceilings; Ceiling fans
- Laundry & utility: Laundry room; Electric water heater
Neighborhood map
What this means for you Summary
Snapshot
- This is a 3-bed/2.0-bath other listed at $160k.
Deal economics
- At list price, monthly cash flow is $323 ($4k/yr) — positive.
- The deal already cash-flows at list — no discount required.
- Meets the 1% rule at list price ($2k rent vs $160k).
- Recommended offer: $150k (6.0% below list) — sets the bar for market timing.
- Cap rate 8.7% vs local median 5.0% in South Mills — top-decile yield for the area; either an underpriced asset or a hidden risk that comps aren't pricing in. Stress-test before assuming the spread holds.
Location & tenants
- Location reads 57/100 on livability (#612 in NC) — a working-class tenant base; expect higher turnover. Strengths: cost of living A+, crime A, housing A; Watch: amenities F, commute F, employment F.
- Elizabeth City-Pasquotank Public Schools (rural): math 21% / reading 34% proficiency, ranked #152 of 178 in NC (top 85%) — low school quality limits family demand, transient renter base, plan for 1-2y turnover.
- Zoned schools: Northside Elementary (math 27% / reading 37%, grade F, #908 of 1,410 statewide, top 67%, 409 students, 99% FRL); Elizabeth City Middle (math 16% / reading 31%, grade F, #402 of 475 statewide, top 85%, 515 students, 99% FRL); Pasquotank County High (math 27% / reading 37%, grade F, #445 of 535 statewide, top 84%, 628 students, 100% FRL) — zoned schools average 99% FRL vs 56% district-wide (43 pts higher); higher-poverty schools than district average — tighter screening recommended.
- Market conditions: Rents rising fast (+4.0%/yr); 343 active listings in the ZIP; 153 units permitted in Pasquotank County in 2024 (0 in 5+ unit buildings).
Forward outlook
- Local home prices are declining (-3.0%/yr); year-one equity from $1k of loan paydown is wiped out by about $5k of value loss. Plan a longer hold.
- Pasquotank County population projected at -19% by 2050 — secular population decline; favor cash flow + early exit over multi-decade hold.
Negotiation context
- It's been on market 77 days — a 6% lower offer ($150k) is reasonable based on typical stale-listing flexibility.
- 2 sale attempts since 5y ago; this cycle's ask has dropped $20k (11%) from the opening price — seller is motivated, your offer sets the floor, not the list.
Risks & watch-outs
- Climate carrying-cost: severe wind risk, 80% chance of damaging wind over 30y; extreme-heat days projected 7→17/yr by 2055 (HVAC capex compounding) — expect insurance premiums to compound above CPI over the hold.
Questions for the listing agent
- It's been on market 77 days. Have you received any prior offers? Is the seller open to a 6% concession, seller financing, or rate buy-down credit?
- Why hasn't it sold? Are there any deal-killer items the seller is aware of (foundation, flood, title, zoning, code violations)?
- Is there a deadline driving the sale (1031 exchange, divorce, estate, relocation)? That informs how much negotiation room exists.
- Schools are D-rated, which usually means shorter tenancies and higher turnover. Who's the typical renter profile here, and what's been the actual vacancy rate?
- What's the average days-on-market for RENTAL listings here right now (not sales)? A rising rental-DOM trend means longer vacancies and softer asking-rent achievability than the comps imply.
- What's the recent tenant-quality profile in this submarket — average credit score on applications, eviction rate, late-payment / NSF rate, and stable-employment percentage? A property-management company in the area should have these aggregated.
- How much new for-sale + rental construction is in the pipeline within 1–3 miles? Heavy new supply typically softens prices + rents 12–24 months out; constrained supply supports both.
Investment metrics
- 1% rule
- 1.02% ✓
- Cap rate
- 8.72%
- Cash-on-cash
- 8.67%
- DSCR
- 1.39
- GRM
- 8.1
CMA / ARV
No comps found within radius.
Projected returns pro-forma
-3.0% appreciation · 4.02% rent growth · sell at horizon
- IRR
- -2.2%
- Equity multiple
- 0.92×
- Total profit
- $-3,669
- Equity at exit
- $23,842
- IRR
- 8.5%
- Equity multiple
- 1.67×
- Total profit
- $30,206
- Equity at exit
- $13,825
Cash invested: $44,772 (down + closing). Projections, not guarantees.
Landlord ↔ Tenant lean methodology
- Overall (STATE)
- 85 Strongly Landlord-Friendly
- State North Carolina
- 85 Strongly Landlord-Friendly · R+3
- County
- — inherits STATE
- City
- — inherits STATE
ZIP-level market 27909
- Rents YoY
- 4.0%
- Active inventory
- 343
- Price-to-rent
- 8.1×
Monthly cashflow live
- Estimated rent
- $1,637 medium interval (Pro) →
- Mortgage (P&I)
- −$839
- Tax from tax record
- −$65 /mo · $774/yr
- Insurance
- −$67
- HOA
- −$0
- Vacancy / Maint / Mgmt
- −$344
- Net cashflow
- $323
Break-even live
UW: 25.0% down · 7.5% · 30yr · 1.5% tax · 5.0% vac · 8.0% maint · 8.0% mgmt
Financing live
Cash to close
- Down payment
- $39,975
- Closing costs
- $4,797
- Reserves months
- —
- Total cash needed
- —
Loan-product check · same deal, 3 products live
Conventional
25% down · 7.5% · 30yr
- Down + closing
- —
- Monthly P&I
- —
- Monthly cashflow
- —
- DSCR
- —
- Eligible?
- —
Personal DTI + credit; lowest rate.
DSCR
20% down · 8.5% · 30yr
- Down + closing
- —
- Monthly P&I
- —
- Monthly cashflow
- —
- DSCR
- —
- Eligible?
- —
No personal income docs; deal must DSCR.
Hard money
10% down · 12.0% · 12mo
- Down + closing
- —
- Monthly P&I
- —
- Monthly cashflow
- —
- DSCR
- —
- Eligible?
- —
Short-term bridge; refi at stabilization.
Listing history 21 events
-
2026-06-19days on market $159,900 Active 77 DOM
-
2026-06-18days on market $159,900 Active 76 DOM
-
2026-06-17days on market $159,900 Active 75 DOM
-
2026-06-16days on market $159,900 Active 74 DOM
-
2026-06-15days on market $159,900 Active 73 DOM
-
2026-06-14days on market $159,900 Active 71 DOM
-
2026-06-12days on market $159,900 Active 70 DOM
-
2026-06-09days on market $159,900 Active 67 DOM
-
2026-06-08days on market $159,900 Active 66 DOM
-
2026-06-07days on market $159,900 Active 65 DOM
-
2026-06-05days on market $159,900 Active 62 DOM
-
2026-06-03days on market $159,900 Active 61 DOM
-
2026-06-02days on market $159,900 Active 60 DOM
-
2026-06-01pricedays on market $159,900 Active 59 DOM
-
2026-05-31days on market $169,900 Active 58 DOM
-
2026-05-30days on market $169,900 Active 57 DOM
-
2026-05-01price $169,900
-
2026-04-03$179,900 Active
-
2022-05-18historical
-
2022-05-18historical
-
2021-12-09$125,000
ⓘ Source: listings_history table (triggers on properties + properties_extension) + one-shot
backfill from property_details.listing_events for pre-trigger history.
Tax reassessment forecast NC · Resets to sale price
- Current annual tax
- $774 · $65/mo
- Projected year-2 tax
- $1,311 · $109/mo
- Expected delta
- +$537/yr (+$45/mo · 69.4%)
ⓘ Screening estimate from a state-policy table — verify with the county assessor before closing.
Climate risk First Street
- Flood 1/10 Low FEMA zone X (unshaded) · 0% chance over 30 yrs
- Wildfire 3/10 Moderate
- Heat 9/10 Extreme 7 d/yr ≥107°F today · 17 d/yr by 30 yrs out
- Wind 8/10 Severe 80% chance of damaging wind over 30 yrs
- Air quality 1/10 Low 0 unhealthy d/yr today · 0 by 30 yrs out
Nearby sold comps map
Loading sold comps map…
Walkable amenities ~0.75 mi
Loading nearby amenities…
Taxation est. · year 1
- Rental income
- $19,643
- − Mortgage interest
- −$8,957
- − Property taxes
- −$774
- − Insurance
- −$800
- − Repairs & maintenance
- −$1,571
- − Management
- −$1,571
- − Depreciation
- −$4,652
- Taxable income
- $1,318
- Est. tax owed @ 24.0%
- −$316
- After-tax cash flow
- $3,566/yr
For passive investors: Depreciation is non-cash, so a rental often shows a tax loss while cash-flowing — sheltering income. Rental losses are passive: they offset passive income freely, and up to $25,000/yr can offset ordinary (W-2) income if you actively participate and your MAGI is under $100k (phasing out to $0 by $150k); unused losses carry forward. On sale, claimed depreciation is recaptured at up to 25%, and gains may owe capital-gains tax (a 1031 exchange can defer both). Figures are a year-1 estimate at your 24.0% rate — not tax advice; consult a CPA.
Schools (NCES district)
- District
- Elizabeth City-Pasquotank Public Schools
- NCES district ID
- 3703540
- Math proficiency
- 21% ▼ -7.00%
- Reading proficiency
- 34% ▼ -1.00%
- Median HH income
- $45,294
- Composite
- 23.63/100
- National rank
- #7847
- State rank
- #152 of 178 in NC
Livability — South Mills
- Score
- 57/100
- State rank
- #612
- US rank
- #22229
Category grades
Schools grade is shown separately in the Schools card above.
Census & demographics
- County
- Pasquotank County · 40,869 people
- City population
- 40,869
- Metro
- Elizabeth City, NC
- Population (ZIP)
- 40,869
- Household income
- $66,732
- Rent vs Own
- Severe rent burden
- 1160.0
Population outlook (Pasquotank County) Hauer SSP2
- Today (2025)
- 38,172 people
- By 2030
- 36,890 · -3.4%
- By 2040
- 33,845 · -11.3%
- By 2050
- 31,086 · -18.6%
- By 2075
- 27,191 · -28.8%
- By 2100
- 26,093 · -31.6%
Race, ethnicity, and origin ACS 2023
- Neighborhood character
- Diverse neighborhood (Simpson 0.59)
- Race & ethnicity
- White 54% Black 35% Hispanic / Latino 6% Two or more races 6% Asian 1%
- Hispanic origin (detail)
- Mexican 2% Puerto Rican 2%
- Common ancestry
- Slovak 2% Romanian 1% Lithuanian 1%
- Foreign-born
- 3% · Canada, Vietnam
- Languages at home
- 96% English-only · Spanish 2% Other Asian/Pacific 1% Vietnamese 1%
Political lean MEDSL · Pasquotank
- 2024 margin
- Toss-up / Even · D 47.1% · R 52.0%
- 2008→2024 swing
- -18.6pp toward R · 2008: 13.7pp · 2024: -4.9pp
- All cycles
- 2024: R+4.9 2020: D+0.3 2016: D+2.2 2012: D+15.9 2008: D+13.7
Not yet ingested
- Civics
- —
Market trends
- HPI YoY
- ▼ -141.03%
- Current HPI
- 164.7511
- Rent YoY
- ▲ 4.02%
- Metro
- Elizabeth City, NC
- State GDP YoY
- ▲ 3.28%
- F500 in state
- 26
Industry mix (Fortune 500 HQ in NC)
| Industry | F500 HQs | Revenue |
|---|---|---|
| Financial Services | 2 | $213B |
|
||
| Retail | 2 | $95B |
|
||
| Industrial Conglomerate | 1 | $38B |
|
||
| Metals / Steel | 1 | $35B |
|
||
| Utilities | 1 | $30B |
|
||
| Industrial Machinery | 1 | $19B |
|
||
Price history
+35.9% since first listed5 events — show timeline
- 2026-05-01 Price Changed $169,900 Hive MLS
- 2026-04-03 Listed $179,900 Hive MLS
- 2022-05-18 Listing Removed — Hive MLS
- 2022-05-18 Listing Removed — Hive MLS
- 2021-12-09 Listed $125,000 Hive MLS
Property tax history
+7.1%/yrLatest (2025): $774 · +6.6% YoY. Source: county tax records.
Cash-flow waterfall
monthlySold comps — $/sqft
last 12 mo · ≤1 miLoading sold comps…