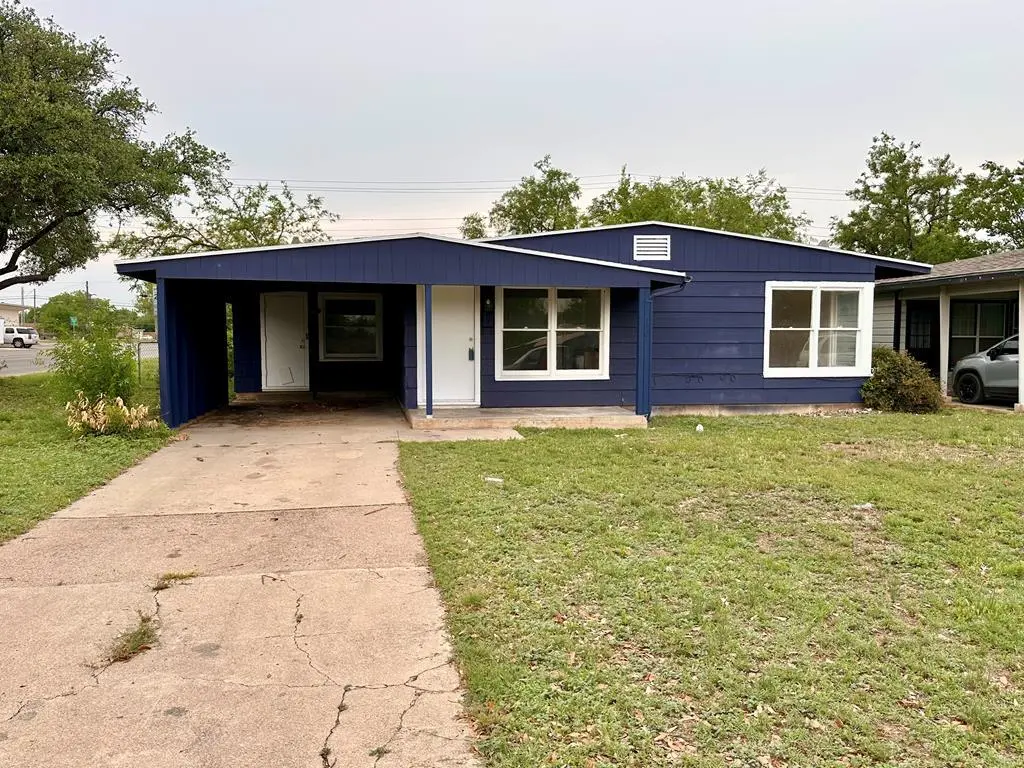
2540 W Harris Ave · San Angelo, TX
Flood risk 1/10 · Minimal
- FEMA flood zone
- X (unshaded)
- Chance of flooding over 30 yrs
- 0.0%
- Est. flood insurance / yr
- $507 – $1,088
Fire risk 4/10 · Minor
- Est. fire insurance / yr
- $1,222 – $2,270
Heat risk 7/10 · Major
- Hot days now (above 104°F)
- 7 days/yr
- Hot days in 30 yrs
- 23 days/yr
Wind risk 4/10 · Minor
- Chance of severe wind over 30 yrs
- 13.0%
Air-quality risk 2/10 · Minimal
- Unhealthy air days now
- 0 days/yr
- Unhealthy air days in 30 yrs
- 1 days/yr
Risk factors via First Street. Map © Google.
Why this score? — see what drove the C+ grade
The composite is a weighted blend of 9 inputs, each scored 0–100. Each bar is that input's sub-score; the figure is the points it added to the 100-point composite (weight × sub-score).
- ARV discount +15.0/15.0
- Cash flow +14.4/30.0
- Appreciation +10.0/10.0
- 1% rule +5.1/10.0
- DSCR +4.4/10.0
- Rent growth +3.9/5.0
- Livability +3.7/5.0
- Schools +2.6/10.0
- Condition / age +2.5/5.0
$139,000
🖨 Deal sheet 📄 Offer letter ✓ Due diligence
Listing remarks MLS
Centrally located in the heart of San Angelo this house is close to Angelo State University, shopping, and restaurants. This 1,076 sq/ft home sits on a corner lot and has two bedrooms and 1 bath. There is fresh paint inside, fresh paint outside, and new flooring in most of the house making this a great move-in ready home. The kitchen is oversized and has plenty of room for entertaining family and friends. There is a large laundry room with extra storage. The backyard is big and there is a patio to enjoy the West Texas weather. This gorgeous home would make a great first-time home, a smaller home for someone downsizing, or a great rental for an investor. This property is leased and occupied as of 11/01/25 for a term of 12 months. The current rent is $1,100 and will be sold with the lease being taken over. Call today for your showing.
Key facts
- Big backyard
- Oversized kitchen
- Large laundry room
Tags
Neighborhood map
What this means for you Summary
Snapshot
- This is a 2-bed/1.0-bath single-family listed at $139k.
Deal economics
- At list price, monthly cash flow is $28 ($335/yr) — positive.
- The deal already cash-flows at list — no discount required.
- Meets the 1% rule at list price ($1k rent vs $139k).
- Recommended offer: $122k (12.0% below list) — sets the bar for market timing.
- Cap rate 6.5% vs local median 3.8% in San Angelo — top-decile yield for the area; either an underpriced asset or a hidden risk that comps aren't pricing in. Stress-test before assuming the spread holds.
Location & tenants
- Location reads 73/100 on livability (#199 in TX) — a middle-class / working-renter tenant base. Strengths: cost of living A+, housing A+, health & safety A+; Watch: employment C-, schools F, amenities F.
- San Angelo ISD (urban): math 27% / reading 33% proficiency, ranked #627 of 826 in TX (top 76%) — families likely to look elsewhere, expect single-tenant / working-renter base with shorter leases.
- Market conditions: Rents rising fast (+5.8%/yr); 331 active listings in the ZIP; 29 comparable units currently listed for rent nearby; rentals lingering (median 44d on market — plan ~5-8 weeks vacancy on turnover, expect pricing pressure); 62% of comp listings sitting > 30 days — soft ceiling on asking rent; 233 units permitted in Tom Green County in 2024 (0 in 5+ unit buildings).
Forward outlook
- In year one you build about $15k of equity ($961 loan paydown + $14k appreciation (10.0% local appreciation)).
- Tom Green County population projected at +35% by 2050 — long-run rental-demand tailwind backs the buy-and-hold thesis.
- At projected returns (10.0% appreciation + 5.8% rent growth), your $39k cash investment doubles in ~3 years — after that, you're playing with house money.
- By year 3, paydown + projected appreciation supports a ~$38k cash-out refi (75% LTV) — recoverable capital for the next deal without selling this one.
Negotiation context
- It's been on market 161 days — a 12% lower offer ($122k) is reasonable based on typical stale-listing flexibility.
- 6 sale attempts since 14y ago with the ask held roughly flat each time — persistent listings suggest the price (not the market) is what's stuck; bring a comps-based counter.
Risks & watch-outs
- Watch-outs: property tax is 2.5% of price; built in 1950 — expect roof / HVAC / electrical / plumbing capex.
- Climate carrying-cost: extreme-heat days projected 7→23/yr by 2055 (HVAC capex compounding) — expect insurance premiums to compound above CPI over the hold.
Questions for the listing agent
- It's been on market 161 days. Have you received any prior offers? Is the seller open to a 12% concession, seller financing, or rate buy-down credit?
- Built in 1950 — when were the roof, HVAC, electrical panel, plumbing, and water heater last replaced?
- Property tax is high relative to price — has the assessment been appealed recently, and will the sale trigger a re-assessment?
- Why hasn't it sold? Are there any deal-killer items the seller is aware of (foundation, flood, title, zoning, code violations)?
- Is there a deadline driving the sale (1031 exchange, divorce, estate, relocation)? That informs how much negotiation room exists.
- Schools are F-rated, which usually means shorter tenancies and higher turnover. Who's the typical renter profile here, and what's been the actual vacancy rate?
- What's the average days-on-market for RENTAL listings here right now (not sales)? A rising rental-DOM trend means longer vacancies and softer asking-rent achievability than the comps imply.
- What's the recent tenant-quality profile in this submarket — average credit score on applications, eviction rate, late-payment / NSF rate, and stable-employment percentage? A property-management company in the area should have these aggregated.
- How much new for-sale + rental construction is in the pipeline within 1–3 miles? Heavy new supply typically softens prices + rents 12–24 months out; constrained supply supports both.
Investment metrics
- 1% rule
- 1.01% ✓
- Cap rate
- 6.53%
- Cash-on-cash
- 0.86%
- DSCR
- 1.04
- GRM
- 8.2
CMA / ARV
- ARV (median comp)
- $168,071
- List price
- $139,000
- Delta
- -17.30%
- Verdict
- UNDERPRICED
- Comps
- 20 within 1.0 mi
Show comp detail 12 sales within ~0.75 mi
| Address | Dist | Beds/Ba | Sqft | Sold | Price | $/sf | Match |
|---|---|---|---|---|---|---|---|
| 2525 Colorado Ave | 0.19mi | 2/1.0 | 1,204 (+12%) | 1mo | $170,000 | $141 | 71 |
| 3101 Guadalupe St | 0.54mi | 2/1.0 | 1,080 (+0%) | 5mo | $153,975 | $143 | 70 |
| 2319 Colorado St | 0.27mi | 3/2.0 (+1) | 1,109 (+3%) | 4mo | $205,000 | $185 | 70 |
| 402 Westland Ave | 0.50mi | 2/1.0 | 1,070 (-1%) | 7mo | $147,500 | $138 | 70 |
| 2403 Freeland Ave | 0.40mi | 2/2.0 | 1,120 (+4%) | 2mo | $179,900 | $161 | 69 |
| 215 Westland St | 0.39mi | 2/1.0 | 971 (-10%) | 1mo | $124,900 | $129 | 64 |
| 425 N Garfield St | 0.43mi | 3/2.0 (+1) | 1,120 (+4%) | 4mo | $179,000 | $160 | 61 |
| 2019 Freeland Ave | 0.59mi | 2/1.0 | 1,008 (-6%) | 4mo | $127,500 | $126 | 58 |
| 312 N Milton St | 0.73mi | 2/2.0 | 1,080 (+0%) | 6mo | $165,000 | $153 | 56 |
| 2627 Guadalupe St | 0.25mi | 3/2.0 (+1) | 1,197 (+11%) | 7mo | $197,000 | $165 | 55 |
| 3118 Guadalupe St | 0.58mi | 3/2.0 (+1) | 1,044 (-3%) | 7mo | $215,000 | $206 | 53 |
| 2702 Houston St | 0.55mi | 3/2.0 (+1) | 1,176 (+9%) | 2mo | $199,900 | $170 | 49 |
Match score weights: distance 35% · size 25% · config 20% · recency 20%. Top-matched comps best support the ARV.
Projected returns pro-forma
10.0% appreciation · 5.78% rent growth · sell at horizon
- IRR
- 26.0%
- Equity multiple
- 3.10×
- Total profit
- $81,617
- Equity at exit
- $125,222
- IRR
- 23.7%
- Equity multiple
- 7.38×
- Total profit
- $248,308
- Equity at exit
- $270,046
Cash invested: $38,920 (down + closing). Projections, not guarantees.
Landlord ↔ Tenant lean methodology
- Overall (STATE)
- 87 Strongly Landlord-Friendly
- State Texas
- 87 Strongly Landlord-Friendly · R+5
- County
- — inherits STATE
- City
- — inherits STATE
ZIP-level market 76901
- Home prices YoY
- 6.4%
- Rents YoY
- 5.8%
- Active inventory
- 331
- Price-to-rent
- 8.2×
Monthly cashflow live
- Estimated rent
- $1,405 high interval (Pro) →
- Mortgage (P&I)
- −$729
- Tax from tax record
- −$295 /mo · $3,540/yr
- Insurance
- −$58
- HOA
- −$0
- Vacancy / Maint / Mgmt
- −$295
- Net cashflow
- $28
Break-even live
UW: 25.0% down · 7.5% · 30yr · 1.5% tax · 5.0% vac · 8.0% maint · 8.0% mgmt
Financing live
Cash to close
- Down payment
- $34,750
- Closing costs
- $4,170
- Reserves months
- —
- Total cash needed
- —
Loan-product check · same deal, 3 products live
Conventional
25% down · 7.5% · 30yr
- Down + closing
- —
- Monthly P&I
- —
- Monthly cashflow
- —
- DSCR
- —
- Eligible?
- —
Personal DTI + credit; lowest rate.
DSCR
20% down · 8.5% · 30yr
- Down + closing
- —
- Monthly P&I
- —
- Monthly cashflow
- —
- DSCR
- —
- Eligible?
- —
No personal income docs; deal must DSCR.
Hard money
10% down · 12.0% · 12mo
- Down + closing
- —
- Monthly P&I
- —
- Monthly cashflow
- —
- DSCR
- —
- Eligible?
- —
Short-term bridge; refi at stabilization.
Rent comps 29 comps
| Address | Beds | Baths | Sqft | Rent | $/sqft | DOM | Units | Dist |
|---|---|---|---|---|---|---|---|---|
| 2430 Rio Grande St San Angelo, TX | 3.0 | 1.0 | 1200 | $1,395 | $1.16 | 44d | 1 | 0.12mi |
| 212 S Fillmore St Unit B San Angelo, TX | 2.0 | 1.0 | 800 | $999 | $1.25 | 44d | 1 | 0.38mi |
| 705 Childress St San Angelo, TX | 2.0 | 1.0 | 872 | $1,400 | $1.61 | 44d | 1 | 0.52mi |
| 2065 Live Oak St San Angelo, TX | 2.0 | 1.0 | 720 | $950 | $1.32 | 44d | 1 | 0.52mi |
| 2630 Waco St San Angelo, TX | 3.0 | 2.0 | 1024 | $1,600 | $1.56 | 21d | 1 | 0.60mi |
| 2804 Abilene St San Angelo, TX | 3.0 | 2.0 | 1304 | $1,550 | $1.19 | 44d | 1 | 0.70mi |
| 121 N Van Buren St Unit A San Angelo, TX | 2.0 | 1.0 | 715 | $1,095 | $1.53 | 21d | 1 | 0.70mi |
| 2013 Rosemont Dr San Angelo, TX | 3.0 | 2.0 | 1400 | $2,100 | $1.50 | 21d | 1 | 0.72mi |
| 1818 S Lincoln St San Angelo, TX | 2.0 | 1.0–2.0 | 555 | $1,199 | $2.16 | 21d | 19 | 0.72mi |
| 1835 Willow St San Angelo, TX | 3.0 | 1.0 | 1267 | $1,750 | $1.38 | 44d | 1 | 0.75mi |
| 2756 Sac Ave San Angelo, TX | 3.0 | 1.0 | 1461 | $1,650 | $1.13 | 44d | 1 | 0.82mi |
| 2629 Forest Park Ave San Angelo, TX | 3.0 | 2.0 | 1336 | $1,895 | $1.42 | 44d | 1 | 0.87mi |
| 1725 West Avenue M Unit M San Angelo, TX | 2.0 | 1.0 | 1202 | $1,350 | $1.12 | 21d | 1 | 0.87mi |
| 2102 Webster St San Angelo, TX | 3.0 | 1.0 | 1233 | $1,750 | $1.42 | 44d | 1 | 0.92mi |
| 1210 Guthrie St San Angelo, TX | 3.0 | 2.0 | 1157 | $1,400 | $1.21 | 21d | 1 | 0.94mi |
| 711 N Monroe St San Angelo, TX | 3.0 | 1.0 | 1345 | $1,500 | $1.12 | 44d | 1 | 0.96mi |
| 1405 Hassell St San Angelo, TX | 3.0 | 2.0 | 1064 | $1,950 | $1.83 | 44d | 1 | 0.96mi |
| 3755 Arden Rd San Angelo, TX | 2.0–3.0 | 1.0 | 875 | $925 | $1.06 | 21d | 1 | 0.97mi |
| 2431 College Hills Blvd San Angelo, TX | 1.0–3.0 | 1.0–2.0 | 1025 | $1,254 | $1.22 | 21d | 17 | 1.13mi |
| 3801 Arden Rd Apt 108 San Angelo, TX | 2.0 | 2.0 | 1025 | $1,215 | $1.19 | 44d | 1 | 1.20mi |
| 3801 Arden Rd Apt 65 San Angelo, TX | 2.0 | 2.0 | 1025 | $1,199 | $1.17 | 21d | 1 | 1.20mi |
| 2802 Field St San Angelo, TX | 3.0 | 2.0 | 1384 | $1,600 | $1.16 | 44d | 1 | 1.32mi |
| 1929 Raney St San Angelo, TX | 1.0–2.0 | 1.0–2.0 | 765 | $1,000 | $1.31 | 21d | 4 | 1.34mi |
| 2102 Raney St San Angelo, TX | 3.0 | 1.0 | 1040 | $1,295 | $1.25 | 21d | 1 | 1.36mi |
| 902 Shiloh St Unit RE-908-20 San Angelo, TX | 1.0 | 1.0 | 800 | $1,025 | $1.28 | 44d | 1 | 1.36mi |
| 902 Shiloh St Unit RE-908-C San Angelo, TX | 2.0 | 1.5 | 925 | $1,175 | $1.27 | 44d | 1 | 1.36mi |
| 902 Shiloh St Unit RE-908-16 San Angelo, TX | 2.0 | 1.0 | 875 | $1,125 | $1.29 | 44d | 1 | 1.36mi |
| 1905 Meadowbrook Dr San Angelo, TX | 3.0 | 2.0 | 1184 | $1,400 | $1.18 | 44d | 1 | 1.40mi |
| 3426 Millbrook Dr San Angelo, TX | 1.0–2.0 | 1.0–2.0 | 845 | $1,459 | $1.73 | 44d | 13 | 1.43mi |
Listing history 30 events
-
2026-06-19days on market $139,000 Active 161 DOM
-
2026-06-18days on market $139,000 Active 160 DOM
-
2026-06-17days on market $139,000 Active 159 DOM
-
2026-06-16days on market $139,000 Active 158 DOM
-
2026-06-15days on market $139,000 Active 157 DOM
-
2026-06-14days on market $139,000 Active 155 DOM
-
2026-06-13days on market $139,000 Active 154 DOM
-
2026-06-10days on market $139,000 Active 152 DOM
-
2026-06-09days on market $139,000 Active 151 DOM
-
2026-06-08days on market $139,000 Active 150 DOM
-
2026-06-07days on market $139,000 Active 149 DOM
-
2026-06-02days on market $139,000 Active 144 DOM
-
2026-06-01days on market $139,000 Active 143 DOM
-
2026-05-31days on market $139,000 Active 142 DOM
-
2026-05-30days on market $139,000 Active 141 DOM
-
2026-01-09$139,000 Active 844-char remark
Show marketing remark (844 chars)
Centrally located in the heart of San Angelo this house is close to Angelo State University, shopping, and restaurants. This 1,076 sq/ft home sits on a corner lot and has two bedrooms and 1 bath. There is fresh paint inside, fresh paint outside, and new flooring in most of the house making this a great move-in ready home. The kitchen is oversized and has plenty of room for entertaining family and friends. There is a large laundry room with extra storage. The backyard is big and there is a patio to enjoy the West Texas weather. This gorgeous home would make a great first-time home, a smaller home for someone downsizing, or a great rental for an investor. This property is leased and occupied as of 11/01/25 for a term of 12 months. The current rent is $1,100 and will be sold with the lease being taken over. Call today for your showing.
-
2025-11-06historical $1,100
-
2025-04-25$143,500 Active
-
2025-04-16$1,100
-
2025-04-15price $145,000
-
2024-11-18status Active
-
2024-08-30price $149,000
-
2024-06-07price $155,000
-
2024-04-24price $159,000
-
2024-03-27price $169,900
-
2024-02-20price $172,000
-
2024-02-20$165,000 Active
-
2013-03-22soldstatus
-
2013-02-11soldstatus
-
2012-11-20$45,000
ⓘ Source: listings_history table (triggers on properties + properties_extension) + one-shot
backfill from property_details.listing_events for pre-trigger history.
Tax reassessment forecast TX · Resets to sale price
- Current annual tax
- $3,540 · $295/mo
- Projected year-2 tax
- $3,540 · $295/mo
- Expected delta
- $0/yr ($0/mo · 0.0%)
ⓘ Screening estimate from a state-policy table — verify with the county assessor before closing.
Climate risk First Street
- Flood 1/10 Low FEMA zone X (unshaded) · 0% chance over 30 yrs
- Wildfire 4/10 Moderate
- Heat 7/10 Severe 7 d/yr ≥104°F today · 23 d/yr by 30 yrs out
- Wind 4/10 Moderate 13% chance of damaging wind over 30 yrs
- Air quality 2/10 Low 0 unhealthy d/yr today · 1 by 30 yrs out
Nearby sold comps map
Loading sold comps map…
Walkable amenities ~0.75 mi
Loading nearby amenities…
Taxation est. · year 1
- Rental income
- $16,857
- − Mortgage interest
- −$7,786
- − Property taxes
- −$3,540
- − Insurance
- −$695
- − Repairs & maintenance
- −$1,349
- − Management
- −$1,349
- − Depreciation
- −$4,044
- Taxable loss
- −$1,904
- Est. tax savings @ 24.0%
- +$457
- After-tax cash flow
- $792/yr
For passive investors: Depreciation is non-cash, so a rental often shows a tax loss while cash-flowing — sheltering income. Rental losses are passive: they offset passive income freely, and up to $25,000/yr can offset ordinary (W-2) income if you actively participate and your MAGI is under $100k (phasing out to $0 by $150k); unused losses carry forward. On sale, claimed depreciation is recaptured at up to 25%, and gains may owe capital-gains tax (a 1031 exchange can defer both). Figures are a year-1 estimate at your 24.0% rate — not tax advice; consult a CPA.
Schools (NCES district)
- District
- San Angelo ISD
- NCES district ID
- 4838700
- Math proficiency
- 27% ▼ -9.00%
- Reading proficiency
- 33% ▼ -3.00%
- Median HH income
- $43,501
- Composite
- 25.56/100
- National rank
- #7427
- State rank
- #627 of 826 in TX
Livability — San Angelo
- Score
- 73/100
- State rank
- #199
- US rank
- #5030
Category grades
Schools grade is shown separately in the Schools card above.
Census & demographics
- Census place
- San Angelo, TX
- County
- Tom Green County · 113,188 people
- City population
- 81,357
- Metro
- San Angelo, TX
- Population (ZIP)
- 31,831
- Household income
- $69,450
- Rent vs Own
- Severe rent burden
- 1034.0
Population outlook (Tom Green County) Hauer SSP2
- Today (2025)
- 135,110 people
- By 2030
- 144,090 · +6.6%
- By 2040
- 162,561 · +20.3%
- By 2050
- 182,158 · +34.8%
- By 2075
- 232,274 · +71.9%
- By 2100
- 268,218 · +98.5%
Race, ethnicity, and origin ACS 2023
- Neighborhood character
- Majority White (55%)
- Race & ethnicity
- White 55% Hispanic / Latino 41% Two or more races 17% Black 2%
- Hispanic origin (detail)
- Mexican 38%
- Common ancestry
- Lithuanian 3% Slovak 3% Iranian 1%
- Foreign-born
- 5% · Canada
- Languages at home
- 77% English-only · Spanish 21% German/W. Germanic 1%
Political lean MEDSL · Tom Green
- 2024 margin
- Solid R (+48.0) · D 25.5% · R 73.5% · Other 1.0%
- 2008→2024 swing
- -6.3pp toward R · 2008: -41.7pp · 2024: -48.0pp
- All cycles
- 2024: R+48.0 2020: R+44.4 2016: R+47.9 2012: R+47.9 2008: R+41.7
Not yet ingested
- Civics
- —
Market trends
- HPI YoY
- ▲ 47.96%
- Current HPI
- 798.58
- Rent YoY
- ▲ 5.78%
- Metro
- San Angelo, TX
- State GDP YoY
- ▲ 3.95%
- F500 in state
- 110
Industry mix (Fortune 500 HQ in TX)
| Industry | F500 HQs | Revenue |
|---|---|---|
| Energy | 16 | $1,198B |
|
||
| Technology | 5 | $198B |
|
||
| Engineering / Construction | 4 | $72B |
|
||
| Energy Services | 3 | $60B |
|
||
| Utilities | 3 | $41B |
|
||
| Healthcare | 2 | $330B |
|
||
Price history
+208.9% since first listed15 events — show timeline
- 2026-01-09 Listed $139,000 SAAR TX
- 2025-11-06 Rental Removed $1,100 BUILDIUM
- 2025-04-25 Listed $143,500 SAAR TX
- 2025-04-16 Listed for Rent $1,100 BUILDIUM
- 2025-04-15 Price Changed $145,000 SAAR TX
- 2024-11-18 Relisted — SAAR TX
- 2024-08-30 Price Changed $149,000 SAAR TX
- 2024-06-07 Price Changed $155,000 SAAR TX
- 2024-04-24 Price Changed $159,000 SAAR TX
- 2024-03-27 Price Changed $169,900 SAAR TX
- 2024-02-20 Price Changed $172,000 SAAR TX
- 2024-02-20 Listed $165,000 SAAR TX
- 2013-03-22 Sold (Public Records) — Public Records
- 2013-02-11 Sold (MLS) — SAAR TX
- 2012-11-20 Listed $45,000 SAAR TX
Property tax history
+7.6%/yrLatest (2025): $3,540 · +26.1% YoY. Source: county tax records.
Cash-flow waterfall
monthlySold comps — $/sqft
last 12 mo · ≤1 miLoading sold comps…