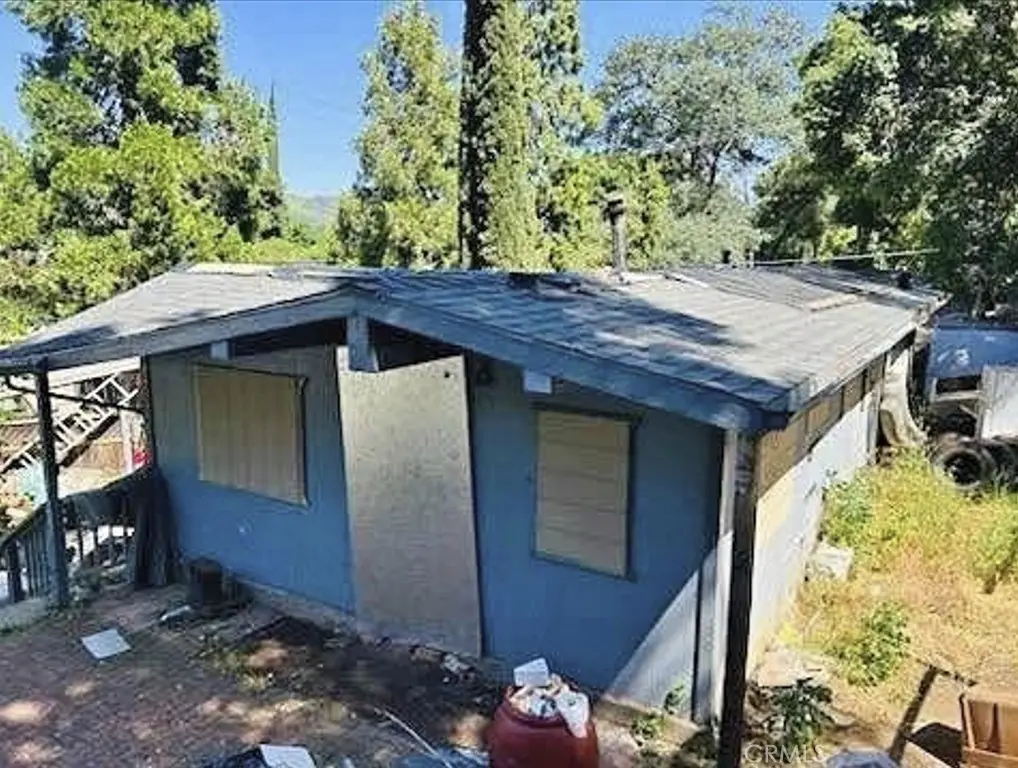
12441 Pine St · Clearlake Oaks, CA
Flood risk 8/10 · Major
- FEMA flood zone
- X (unshaded)
- Chance of flooding over 30 yrs
- 0.99%
- Est. flood insurance / yr
- $507 – $1,088
Fire risk 10/10 · Severe
- Est. fire insurance / yr
- $659 – $1,223
Heat risk 6/10 · Moderate
- Hot days now (above 100°F)
- 7 days/yr
- Hot days in 30 yrs
- 14 days/yr
Wind risk 1/10 · Minimal
- Chance of severe wind over 30 yrs
- —
Air-quality risk 10/10 · Severe
- Unhealthy air days now
- 32 days/yr
- Unhealthy air days in 30 yrs
- 34 days/yr
Risk factors via First Street. Map © Google.
Why this score? — see what drove the B- grade
The composite is a weighted blend of 9 inputs, each scored 0–100. Each bar is that input's sub-score; the figure is the points it added to the 100-point composite (weight × sub-score).
- Cash flow +30.0/30.0
- 1% rule +10.0/10.0
- DSCR +10.0/10.0
- ARV discount +7.5/15.0
- Livability +3.0/5.0
- Rent growth +2.5/5.0
- Condition / age +2.5/5.0
- Schools +1.2/10.0
- Appreciation +0.0/10.0
$70,000
🖨 Deal sheet 📄 Offer letter ✓ Due diligence
Listing remarks MLS
Structurally sound SFR (not a mobile) on its own land, with all city utilities (water, sewer, and PG & E) connected and included in the purchase. Located in town with convenient access to local amenities. The home will require renovations to realize its full potential and is priced accordingly. Offers strong value when considering the cost of land, utility connections, and existing structure.
Key facts
- 5,227 sq ft lot
- Garage
- Built 1957
Neighborhood map
What this means for you Summary
Snapshot
- This is a 1-bed/1.0-bath single-family listed at $70k.
Deal economics
- At list price, monthly cash flow is $735 ($9k/yr) — positive.
- The deal already cash-flows at list — no discount required.
- Meets the 1% rule at list price ($2k rent vs $70k).
- Recommended offer: $62k (12.0% below list) — sets the bar for market timing.
- Cap rate 20.0% vs local median 4.3% in Clearlake Oaks — top-decile yield for the area; either an underpriced asset or a hidden risk that comps aren't pricing in. Stress-test before assuming the spread holds.
Location & tenants
- Location reads 60/100 on livability (#569 in CA) — a middle-class / working-renter tenant base. Strengths: housing A+, crime B; Watch: health & safety C-, schools F, amenities F.
- Konocti Unified (town): math 9% / reading 21% proficiency, ranked #494 of 517 in CA (top 96%) — low school quality limits family demand, transient renter base, plan for 1-2y turnover; 77% free/reduced lunch — lower-income household profile, screen leases tightly.
- Market conditions: 136 active listings in the ZIP; 107 units permitted in Lake County in 2024 (40 in 5+ unit buildings).
Forward outlook
- Local home prices are declining (-3.0%/yr); year-one equity from $484 of loan paydown is wiped out by about $2k of value loss. Plan a longer hold.
- Lake County population projected at -15% by 2050 — secular population decline; favor cash flow + early exit over multi-decade hold.
- At projected returns (-3.0% appreciation + 3.0% rent growth), your $20k cash investment doubles in ~3 years — after that, you're playing with house money.
Negotiation context
- It's been on market 371 days — a 12% lower offer ($62k) is reasonable based on typical stale-listing flexibility.
- 7 sale attempts since 24y ago; this cycle's ask has dropped $15k (18%) from the opening price — seller is motivated, your offer sets the floor, not the list.
- Current owner paid $30k; list at $70k implies a 133% gain — meaningful room to come down on a strong offer.
Risks & watch-outs
- Watch-outs: flood insurance adds $66/mo; built in 1957 — expect roof / HVAC / electrical / plumbing capex.
- Climate carrying-cost: severe flood risk; severe wildfire risk; extreme-heat days projected 7→14/yr by 2055 (HVAC capex compounding) — expect insurance premiums to compound above CPI over the hold.
Questions for the listing agent
- It's been on market 371 days. Have you received any prior offers? Is the seller open to a 12% concession, seller financing, or rate buy-down credit?
- Built in 1957 — when were the roof, HVAC, electrical panel, plumbing, and water heater last replaced?
- What's the actual annual flood-insurance premium (NFIP or private), and is the property in a SFHA with mandatory coverage?
- Why hasn't it sold? Are there any deal-killer items the seller is aware of (foundation, flood, title, zoning, code violations)?
- Is there a deadline driving the sale (1031 exchange, divorce, estate, relocation)? That informs how much negotiation room exists.
- Schools are F-rated, which usually means shorter tenancies and higher turnover. Who's the typical renter profile here, and what's been the actual vacancy rate?
- What's the average days-on-market for RENTAL listings here right now (not sales)? A rising rental-DOM trend means longer vacancies and softer asking-rent achievability than the comps imply.
- What's the recent tenant-quality profile in this submarket — average credit score on applications, eviction rate, late-payment / NSF rate, and stable-employment percentage? A property-management company in the area should have these aggregated.
- How much new for-sale + rental construction is in the pipeline within 1–3 miles? Heavy new supply typically softens prices + rents 12–24 months out; constrained supply supports both.
Investment metrics
- 1% rule
- 2.31% ✓
- Cap rate
- 20.03%
- Cash-on-cash
- 49.05%
- DSCR
- 3.18
- GRM
- 3.6
CMA / ARV
- ARV (median comp)
- $201,633
- List price
- $70,000
- Delta
- -65.28%
- Verdict
- UNDERPRICED
- Comps
- 20 within 1.0 mi
Show comp detail 8 sales within ~0.75 mi
| Address | Dist | Beds/Ba | Sqft | Sold | Price | $/sf | Match |
|---|---|---|---|---|---|---|---|
| 12526 Oak St | 0.15mi | 2/2.0 (+1) | 752 (+1%) | 16mo | $170,000 | $226 | 69 |
| 12630 Shoreview Dr | 0.23mi | 2/1.0 (+1) | 832 (+12%) | 4mo | $110,000 | $132 | 61 |
| 12929 Oak Knoll Ave | 0.53mi | 1/1.5 | 744 (0%) | 16mo | $210,000 | $282 | 60 |
| 11849 Widgeon | 0.59mi | 1/1.0 | 840 (+13%) | 2mo | $160,000 | $190 | 49 |
| 12881 4th | 0.50mi | 2/1.0 (+1) | 640 (-14%) | 4mo | $50,000 | $78 | 44 |
| 12858 E Highway 20 | 0.56mi | 1/1.0 | 800 (+8%) | 22mo | $175,000 | $219 | 43 |
| 12897 E Highway 20 | 0.58mi | 2/1.0 (+1) | 836 (+12%) | 10mo | $163,000 | $195 | 39 |
| 65 Butler St | 0.75mi | 2/1.0 (+1) | 799 (+7%) | 12mo | $66,720 | $84 | 38 |
Match score weights: distance 35% · size 25% · config 20% · recency 20%. Top-matched comps best support the ARV.
Projected returns pro-forma
-3.0% appreciation · 3.0% rent growth · sell at horizon
- IRR
- 42.1%
- Equity multiple
- 2.81×
- Total profit
- $35,514
- Equity at exit
- $10,437
- IRR
- 48.3%
- Equity multiple
- 5.66×
- Total profit
- $91,430
- Equity at exit
- $6,052
Cash invested: $19,600 (down + closing). Projections, not guarantees.
Landlord ↔ Tenant lean methodology
- Overall (STATE)
- 18 Strongly Tenant-Friendly
- State California
- 18 Strongly Tenant-Friendly · D+13
- County
- — inherits STATE
- City
- — inherits STATE
ZIP-level market 95423
- Home prices YoY
- -20.6%
- Active inventory
- 136
- Price-to-rent
- 3.6×
Monthly cashflow live
- Estimated rent
- $1,618 medium interval (Pro) →
- Mortgage (P&I)
- −$367
- Tax from tax record
- −$81 /mo · $969/yr
- Insurance
- −$29
- Flood insurance flood zone
- −$66 /mo · $798/yr
- HOA
- −$0
- Vacancy / Maint / Mgmt
- −$340
- Net cashflow
- $735
Break-even live
UW: 25.0% down · 7.5% · 30yr · 1.5% tax · 5.0% vac · 8.0% maint · 8.0% mgmt
Financing live
Cash to close
- Down payment
- $17,500
- Closing costs
- $2,100
- Reserves months
- —
- Total cash needed
- —
Loan-product check · same deal, 3 products live
Conventional
25% down · 7.5% · 30yr
- Down + closing
- —
- Monthly P&I
- —
- Monthly cashflow
- —
- DSCR
- —
- Eligible?
- —
Personal DTI + credit; lowest rate.
DSCR
20% down · 8.5% · 30yr
- Down + closing
- —
- Monthly P&I
- —
- Monthly cashflow
- —
- DSCR
- —
- Eligible?
- —
No personal income docs; deal must DSCR.
Hard money
10% down · 12.0% · 12mo
- Down + closing
- —
- Monthly P&I
- —
- Monthly cashflow
- —
- DSCR
- —
- Eligible?
- —
Short-term bridge; refi at stabilization.
Listing history 39 events
-
2026-06-19days on market $70,000 Active 371 DOM
-
2026-06-18days on market $70,000 Active 370 DOM
-
2026-06-17days on market $70,000 Active 369 DOM
-
2026-06-16days on market $70,000 Active 368 DOM
-
2026-06-15days on market $70,000 Active 367 DOM
-
2026-06-14days on market $70,000 Active 365 DOM
-
2026-06-13days on market $70,000 Active 364 DOM
-
2026-06-10days on market $70,000 Active 362 DOM
-
2026-06-09days on market $70,000 Active 361 DOM
-
2026-06-08days on market $70,000 Active 360 DOM
-
2026-06-07days on market $70,000 Active 359 DOM
-
2026-06-05days on market $70,000 Active 356 DOM
-
2026-06-02days on market $70,000 Active 354 DOM
-
2026-06-01days on market $70,000 Active 353 DOM
-
2026-05-31days on market $70,000 Active 352 DOM
-
2026-05-30days on market $70,000 Active 351 DOM
-
2026-03-18price $70,000 399-char remark
Show marketing remark (399 chars)
Structurally sound SFR (not a mobile) on its own land, with all city utilities (water, sewer, and PG & E) connected and included in the purchase. Located in town with convenient access to local amenities. The home will require renovations to realize its full potential and is priced accordingly. Offers strong value when considering the cost of land, utility connections, and existing structure.
-
2025-10-22price $75,000 399-char remark
Show marketing remark (399 chars)
Structurally sound SFR (not a mobile) on its own land, with all city utilities (water, sewer, and PG & E) connected and included in the purchase. Located in town with convenient access to local amenities. The home will require renovations to realize its full potential and is priced accordingly. Offers strong value when considering the cost of land, utility connections, and existing structure.
-
2025-06-13$85,000 Active 399-char remark
Show marketing remark (399 chars)
Structurally sound SFR (not a mobile) on its own land, with all city utilities (water, sewer, and PG & E) connected and included in the purchase. Located in town with convenient access to local amenities. The home will require renovations to realize its full potential and is priced accordingly. Offers strong value when considering the cost of land, utility connections, and existing structure.
-
2024-07-25soldstatus $30,000 Closed Sale
-
2024-07-04historical Active Under Contract
-
2024-06-27$65,000 Active
-
2013-12-11soldstatus $42,750 Closed
-
2013-12-01status Pending
-
2013-11-14$42,500 Active
-
2013-10-30soldstatus $48,771
-
2013-08-12historical
-
2013-08-09historical Withdrawn - Cancel
-
2013-06-13historical
-
2013-06-11historical
-
2013-01-30$39,500
-
2013-01-30$39,500
-
2005-09-29soldstatus $159,500
-
2005-09-29soldstatus $160,000
-
2005-08-18$149,500
-
2003-05-29soldstatus $100,000
-
2003-05-29soldstatus $100,000
-
2002-11-01$119,000
-
1994-08-23soldstatus $53,000
ⓘ Source: listings_history table (triggers on properties + properties_extension) + one-shot
backfill from property_details.listing_events for pre-trigger history.
Tax reassessment forecast CA · Resets to sale price
- Current annual tax
- $969 · $81/mo
- Projected year-2 tax
- $969 · $81/mo
- Expected delta
- $0/yr ($0/mo · 0.0%)
ⓘ Screening estimate from a state-policy table — verify with the county assessor before closing.
Climate risk First Street
- Flood 8/10 Severe FEMA zone X (unshaded) · 99% chance over 30 yrs
- Wildfire 10/10 Extreme
- Heat 6/10 Major 7 d/yr ≥100°F today · 14 d/yr by 30 yrs out
- Wind 1/10 Low
- Air quality 10/10 Extreme 32 unhealthy d/yr today · 34 by 30 yrs out
Nearby sold comps map
Loading sold comps map…
Walkable amenities ~0.75 mi
Loading nearby amenities…
Taxation est. · year 1
- Rental income
- $19,416
- − Mortgage interest
- −$3,921
- − Property taxes
- −$969
- − Insurance
- −$1,148
- − Repairs & maintenance
- −$1,553
- − Management
- −$1,553
- − Depreciation
- −$2,036
- Taxable income
- $8,235
- Est. tax owed @ 24.0%
- −$1,976
- After-tax cash flow
- $6,840/yr
For passive investors: Depreciation is non-cash, so a rental often shows a tax loss while cash-flowing — sheltering income. Rental losses are passive: they offset passive income freely, and up to $25,000/yr can offset ordinary (W-2) income if you actively participate and your MAGI is under $100k (phasing out to $0 by $150k); unused losses carry forward. On sale, claimed depreciation is recaptured at up to 25%, and gains may owe capital-gains tax (a 1031 exchange can defer both). Figures are a year-1 estimate at your 24.0% rate — not tax advice; consult a CPA.
Schools (NCES district)
- District
- Konocti Unified
- NCES district ID
- 0620070
- Math proficiency
- 9% ▼ -5.00%
- Reading proficiency
- 21% ▼ -6.00%
- Median HH income
- $30,026
- Composite
- 11.81/100
- National rank
- #9677
- State rank
- #494 of 517 in CA
Livability — Clearlake Oaks
- Score
- 60/100
- State rank
- #569
- US rank
- #18675
Category grades
Schools grade is shown separately in the Schools card above.
Census & demographics
- Census place
- Clearlake Oaks, CA
- Population (ZIP)
- 3,432
Population outlook (Lake County) Hauer SSP2
- Today (2025)
- 62,396 people
- By 2030
- 60,626 · -2.8%
- By 2040
- 56,453 · -9.5%
- By 2050
- 53,054 · -15.0%
- By 2075
- 47,663 · -23.6%
- By 2100
- 41,804 · -33.0%
Race, ethnicity, and origin ACS 2023
- Neighborhood character
- Predominantly White (69%)
- Race & ethnicity
- White 69% Hispanic / Latino 18% Two or more races 9% Native American 3% Black 1% Asian 1%
- Hispanic origin (detail)
- Mexican 17%
- Common ancestry
- Slovak 5% Lithuanian 4% Russian 2%
- Foreign-born
- 11% · Canada, Vietnam
- Languages at home
- 84% English-only · Spanish 8% Other Indo-European 7% German/W. Germanic 1%
Political lean MEDSL · Lake
- 2024 margin
- Toss-up / Even · D 47.8% · R 49.2% · Other 3.0%
- 2008→2024 swing
- -20.6pp toward R · 2008: 19.3pp · 2024: -1.4pp
- All cycles
- 2024: R+1.4 2020: D+6.3 2016: D+3.7 2012: D+16.5 2008: D+19.3
Not yet ingested
- Civics
- —
Market trends
- HPI YoY
- ▼ -46.32%
- Current HPI
- 178.9812
- Rent YoY
- —
- Metro
- —
- State GDP YoY
- ▲ 3.21%
- F500 in state
- 116
Industry mix (Fortune 500 HQ in CA)
| Industry | F500 HQs | Revenue |
|---|---|---|
| Technology | 27 | $1,492B |
|
||
| Financial Services | 3 | $174B |
|
||
| Retail | 3 | $44B |
|
||
| Insurance | 3 | $26B |
|
||
| Media / Entertainment | 2 | $115B |
|
||
| Pharmaceuticals / Biotech | 2 | $62B |
|
||
Price history
+32.1% since first listed23 events — show timeline
- 2026-03-18 Price Changed $70,000 CRMLS
- 2025-10-22 Price Changed $75,000 CRMLS
- 2025-06-13 Listed $85,000 CRMLS
- 2024-07-25 Sold (MLS) $30,000 CRMLS
- 2024-07-04 Contingent — CRMLS
- 2024-06-27 Listed $65,000 CRMLS
- 2013-12-11 Sold (MLS) $42,750 CRMLS
- 2013-12-01 Pending — CRMLS
- 2013-11-14 Listed $42,500 CRMLS
- 2013-10-30 Sold (Public Records) $48,771 Public Records
- 2013-08-12 Listing Removed — CRMLS
- 2013-08-09 Delisted — BAREIS
- 2013-06-13 Delisted — BAREIS
- 2013-06-11 Listing Removed — CRMLS
- 2013-01-30 Listed $39,500 CRMLS
- 2013-01-30 Listed $39,500 BAREIS
- 2005-09-29 Sold (Public Records) $160,000 Public Records
- 2005-09-29 Sold (MLS) $159,500 CRMLS
- 2005-08-18 Listed $149,500 CRMLS
- 2003-05-29 Sold (Public Records) $100,000 Public Records
- 2003-05-29 Sold (MLS) $100,000 CRMLS
- 2002-11-01 Listed $119,000 CRMLS
- 1994-08-23 Sold (Public Records) $53,000 Public Records
Property tax history
-3.3%/yrLatest (2025): $969 · +48.1% YoY. Source: county tax records.
Cash-flow waterfall
monthlySold comps — $/sqft
last 12 mo · ≤1 miLoading sold comps…