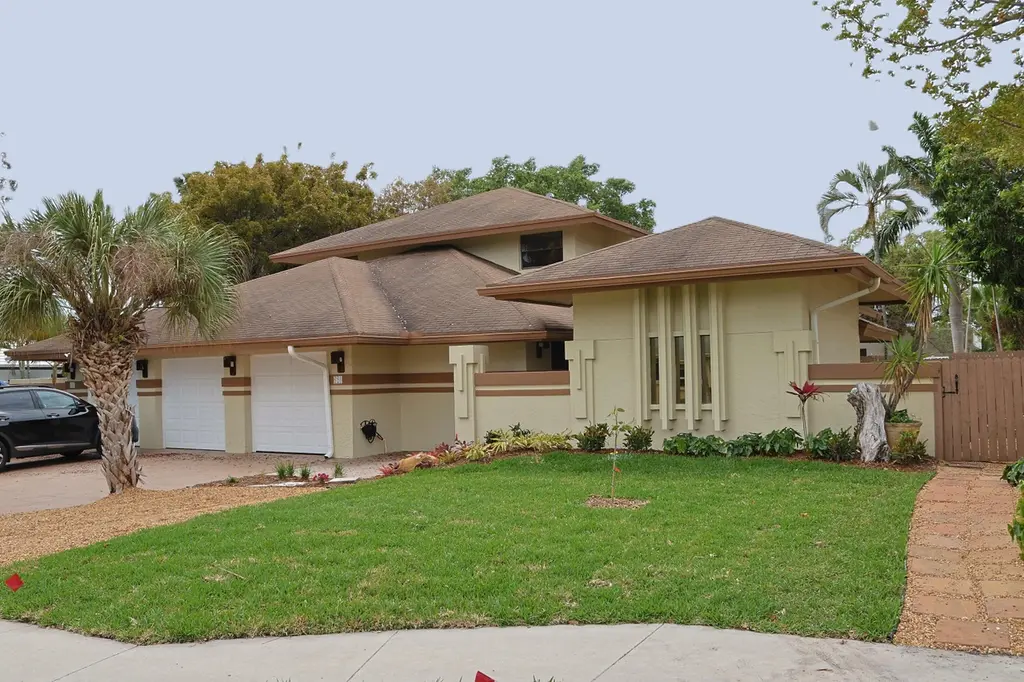
 Duplex
620 Hastings St Unit 620 & 640 · Boca Raton, FL
Flood risk 5/10 · Moderate
- FEMA flood zone
- X (unshaded)
- Chance of flooding over 30 yrs
- 0.23%
- Est. flood insurance / yr
- $507 – $1,088
Fire risk 1/10 · Minimal
- Est. fire insurance / yr
- $947 – $1,759
Heat risk 10/10 · Severe
- Hot days now (above 106°F)
- 7 days/yr
- Hot days in 30 yrs
- 26 days/yr
Wind risk 10/10 · Severe
- Chance of severe wind over 30 yrs
- 99.0%
Air-quality risk 3/10 · Minor
- Unhealthy air days now
- 2 days/yr
- Unhealthy air days in 30 yrs
- 3 days/yr
Risk factors via First Street. Map © Google.
Why this score? — see what drove the D grade
The composite is a weighted blend of 9 inputs, each scored 0–100. Each bar is that input's sub-score; the figure is the points it added to the 100-point composite (weight × sub-score).
- Cash flow +13.1/30.0
- ARV discount +7.5/15.0
- Schools +4.3/10.0
- Condition / age +4.0/5.0
- DSCR +3.9/10.0
- Livability +3.9/5.0
- 1% rule +3.7/10.0
- Rent growth +3.4/5.0
- Appreciation +0.0/10.0
$1,495,000
🖨 Deal sheet (PDF) 📄 Offer letter ✓ Due diligence
Multi-family units
County records classify this as Multi-Family (2-4 Unit). Listing-text estimate: 2 units. confirmed
Listing remarks
Prime investment opportunity just one block west of the Intracoastal, on the east side of US-1 in beautiful Boca Raton, Florida. Surrounded by multimillion-dollar homes and just a short bike ride from the beach, this ideally located duplex offers strong income potential. Both units have been fully remodeled. The right side features a vacant 4-bedroom, 2.5-bathroom layout with a 2-car garage and a private pool. The left side includes a tenant-occupied 3-bedroom, 2.5-bathroom unit with a 1-car garage, currently generating $4,000 per month in rental income. Additional highlights include separate electric meters, a new AC system, partial impact windows, and modern upgrades throughout. Live in o
Key facts
- 0.32 acre lot
- Pool
- Built 1986
Property features AI
Finance
- Other: Lot dimensions approximately 100 x 140 (asphalt public road frontage, public maintained road); Not waterfront
- Financial info: Four total units; Two units in the community; Tenants pay cable, electricity and water; Pets allowed with no restrictions
Exterior
- Utilities: Public water; Public sewer; 220-volt electric service; Cable available; Electricity available; Sewer available; Water available; Two separate electric meters
- Home design: Duplex; Two-story; Resale; City street frontage
- Construction: Stucco and concrete block (CBS) construction; Shingle roof; Slab foundation; Originally built as a 4-unit building (total building area approx. 5,039); Living area reported as approximately 4,326
- Exterior features: Open patio, covered patio and deck; Fenced backyard with gate; Private in-ground pool (fenced)
Interior
- Flooring: Carpet; Ceramic tile; Tile; Wood
- Heating & cooling: Central heating; Central air conditioning; Ceiling fans
- Interior features: Carpet, ceramic tile and wood flooring; Laundry room with sink and inside washer/dryer hookups
- Laundry & utility: Washer and dryer hookups (electric dryer hookup); Laundry room
Neighborhood map
What this means for you Summary
Snapshot
- This is a 1×4bd/2.5ba + 1×3bd/2.5ba units multifamily listed at $1.50M. Condition is rated good.
Deal economics
- At list price, monthly cash flow is $-45 ($-540/yr) — negative. Per door: $-23/mo.
- To cash-flow at today's rent, offer at most $1.49M (0.4% below list).
- To meet the 1% rule (rent ≥ 1% of price), the offer needs to be $1.30M (12.9% below list).
- Recommended offer: $1.30M (12.9% below list) — sets the bar for 1% rule.
- Cap rate 6.3% vs local median 2.8% in Boca Raton — top-decile yield for the area; either an underpriced asset or a hidden risk that comps aren't pricing in. Stress-test before assuming the spread holds.
Location & tenants
- Location reads 77/100 on livability (#192 in FL, #3,070 nationally) — a middle-class / working-renter tenant base. Strengths: employment A+, health & safety A+, crime B+; Watch: amenities D, cost of living F.
- Palm Beach (suburban): math 46% / reading 53% proficiency, ranked #34 of 73 in FL (top 47%) — families likely to look elsewhere, expect single-tenant / working-renter base with shorter leases.
- Zoned schools: J. C. Mitchell Elementary School (math 54% / reading 60%, grade C+, #781 of 2,144 statewide, top 38%, 773 students, 50% FRL); Boca Raton Community Middle School (math 59% / reading 61%, grade B, #135 of 571 statewide, top 24%, 1,225 students, 41% FRL); West Boca Raton High School (math 55% / reading 70%, grade B-, #93 of 667 statewide, top 14%, 2,271 students, 28% FRL).
- Market conditions: Rents rising (+3.6%/yr); 330 active listings in the ZIP; 4 comparable units currently listed for rent nearby; rentals at typical pace (median 25d on market — plan ~3-4 weeks tenant-placement turnaround); solid renter incomes; 3,974 units permitted in Palm Beach County in 2024 (1,012 in 5+ unit buildings).
- At $13,021/mo this rent would consume 163% of the median local household income ($96k/yr) (locally 896% of renters already pay >50% of income on rent) — very limited rent-growth headroom before tenants either downsize or default.
Forward outlook
- Local home prices are declining (-3.0%/yr); year-one equity from $10k of loan paydown is wiped out by about $45k of value loss. Plan a longer hold.
- Palm Beach County population projected at +30% by 2050 — long-run rental-demand tailwind backs the buy-and-hold thesis.
Negotiation context
- It's been on market 85 days — a 6% lower offer ($1.41M) is reasonable based on typical stale-listing flexibility.
Risks & watch-outs
- Climate carrying-cost: moderate flood risk; severe wind risk, 99% chance of damaging wind over 30y; extreme-heat days projected 7→26/yr by 2055 (HVAC capex compounding) — expect insurance premiums to compound above CPI over the hold.
Questions for the listing agent
- What do current leases actually rent for vs. the listed asking? Can we see a recent rent roll and the last 12 months of T-12 income?
- It's been on market 85 days. Have you received any prior offers? Is the seller open to a 13% concession, seller financing, or rate buy-down credit?
- Can we see the unit-by-unit rent roll, current vacancy, and any below-market leases? What's the average tenancy length?
- What capital expenditures (roof, boiler, parking lot, exteriors) have been made in the last 5 years, and what's planned in the next 2?
- Why hasn't it sold? Are there any deal-killer items the seller is aware of (foundation, flood, title, zoning, code violations)?
- Is there a deadline driving the sale (1031 exchange, divorce, estate, relocation)? That informs how much negotiation room exists.
- Schools are A-rated — typically a magnet for longer-tenancy family renters. What's the average tenant stay here, and is there a school-zone premium baked into asking?
- The area grade is low — what's the realistic commute time and amenity access for the typical tenant pool here? Any planned neighborhood developments (good or bad) we should know about?
- What's the average days-on-market for RENTAL listings here right now (not sales)? A rising rental-DOM trend means longer vacancies and softer asking-rent achievability than the comps imply.
- What's the recent tenant-quality profile in this submarket — average credit score on applications, eviction rate, late-payment / NSF rate, and stable-employment percentage? A property-management company in the area should have these aggregated.
- How much new apartment / multifamily construction is in the pipeline within 1–3 miles? Heavy new supply (>2% of stock underway) typically softens rents 12–24 months out; light construction supports rent growth.
Investment metrics
- 1% rule
- 0.87% ✗
- Cap rate
- 6.26%
- Cash-on-cash
- -0.13%
- DSCR
- 0.99
- GRM
- 9.6
CMA / ARV
No comps found within radius.
Projected returns pro-forma
-3.0% appreciation · 3.58% rent growth · sell at horizon
- IRR
- -15.9%
- Equity multiple
- 0.43×
- Total profit
- $-237,283
- Equity at exit
- $222,909
- IRR
- -6.5%
- Equity multiple
- 0.58×
- Total profit
- $-177,783
- Equity at exit
- $129,260
Cash invested: $418,600 (down + closing). Projections, not guarantees.
Landlord ↔ Tenant lean methodology
- Overall (STATE)
- 87 Strongly Landlord-Friendly
- State Florida
- 87 Strongly Landlord-Friendly · R+3
- County
- — inherits STATE
- City
- — inherits STATE
ZIP-level market 33487
- Rents YoY
- 3.6%
- Active inventory
- 330
- Price-to-rent
- 19.4×
Monthly cashflow live
- Estimated rent
- $13,021 high interval (Pro) →
- Mortgage (P&I)
- −$7,840
- Tax est. 1.5%
- −$1,869 /mo · $22,425/yr
- Insurance
- −$623
- HOA
- −$0
- Vacancy / Maint / Mgmt
- −$2,734
- Net cashflow
- $-45
Break-even live
Sensitivity live
| Price | -10% $988 | -5% $472 | +0% $-45 | +5% $-562 | +10% $-1,078 |
|---|---|---|---|---|---|
| Rent | -10% $-1,074 | -5% $-559 | +0% $-45 | +5% $469 | +10% $984 |
| Rate | -1.0pp $708 | -0.5pp $335 | base $-45 | +0.5pp $-432 | +1.0pp $-827 |
2-unit breakdown (identical units grouped — click to expand)
| Units | Beds | Baths | Est. rent |
|---|---|---|---|
| 1× unit | 4 | 2.5 | $6,426 |
| 1× unit | 3 | 2.5 | $6,596 |
| Total (2 units) | $13,021 | ||
UW: 25.0% down · 7.5% · 30yr · 1.5% tax · 5.0% vac · 8.0% maint · 8.0% mgmt
Financing live
Cash to close
- Down payment
- $373,750
- Closing costs
- $44,850
- Reserves months
- —
- Total cash needed
- —
Loan-product check · same deal, 3 products live
Conventional
25% down · 7.5% · 30yr
- Down + closing
- —
- Monthly P&I
- —
- Monthly cashflow
- —
- DSCR
- —
- Eligible?
- —
Personal DTI + credit; lowest rate.
DSCR
20% down · 8.5% · 30yr
- Down + closing
- —
- Monthly P&I
- —
- Monthly cashflow
- —
- DSCR
- —
- Eligible?
- —
No personal income docs; deal must DSCR.
Hard money
10% down · 12.0% · 12mo
- Down + closing
- —
- Monthly P&I
- —
- Monthly cashflow
- —
- DSCR
- —
- Eligible?
- —
Short-term bridge; refi at stabilization.
Rent comps 4 comps
| Address | Beds | Baths | Sqft | Rent | $/sqft | DOM | Units | Dist |
|---|---|---|---|---|---|---|---|---|
| 521 NE 45th St Boca Raton, FL | 1.0 | 1.0 | 5460 | $1,900 | $0.35 | 25d | 1 | 0.97mi |
| 885 NE Mulberry Dr Boca Raton, FL | 3.0 | 3.5 | 3012 | $16,500 | $5.48 | 25d | 1 | 1.17mi |
| 3115 S Ocean Blvd Highland Beach, FL | 3.0 | 2.5–4.0 | 2570 | $15,250 | $5.93 | 17d | 2 | 1.22mi |
| 3115 S Ocean Blvd #1203 Highland Beach, FL | 3.0 | 4.0 | 3288 | $19,500 | $5.93 | 25d | 1 | 1.23mi |
Listing history 13 events
-
2026-06-13days on market $1,495,000 Active 85 DOM
-
2026-06-09days on market $1,495,000 Active 81 DOM
-
2026-06-08days on market $1,495,000 Active 80 DOM
-
2026-06-07days on market $1,495,000 Active 79 DOM
-
2026-06-04days on market $1,495,000 Active 76 DOM
-
2026-06-03days on market $1,495,000 Active 75 DOM
-
2026-06-02days on market $1,495,000 Active 74 DOM
-
2026-06-01days on market $1,495,000 Active 73 DOM
-
2026-05-31days on market $1,495,000 Active 72 DOM
-
2026-05-02price $1,495,000
-
2026-04-10price $1,550,000
-
2026-04-01price $1,600,000
-
2026-03-20$1,650,000 Active
ⓘ Source: listings_history table (triggers on properties + properties_extension) + one-shot
backfill from property_details.listing_events for pre-trigger history.
Climate risk First Street
- Flood 5/10 Major FEMA zone X (unshaded) · 23% chance over 30 yrs
- Wildfire 1/10 Low
- Heat 10/10 Extreme 7 d/yr ≥106°F today · 26 d/yr by 30 yrs out
- Wind 10/10 Extreme 99% chance of damaging wind over 30 yrs
- Air quality 3/10 Moderate 2 unhealthy d/yr today · 3 by 30 yrs out
Nearby sold comps map
Loading sold comps map…
Walkable amenities ~0.75 mi
Loading nearby amenities…
Taxation est. · year 1
- Rental income
- $156,252
- − Mortgage interest
- −$83,743
- − Property taxes
- −$22,425
- − Insurance
- −$7,475
- − Repairs & maintenance
- −$12,500
- − Management
- −$12,500
- − Depreciation
- −$43,491
- Taxable loss
- −$25,882
- Est. tax savings @ 24.0%
- +$6,212
- After-tax cash flow
- $5,672/yr
For passive investors: Depreciation is non-cash, so a rental often shows a tax loss while cash-flowing — sheltering income. Rental losses are passive: they offset passive income freely, and up to $25,000/yr can offset ordinary (W-2) income if you actively participate and your MAGI is under $100k (phasing out to $0 by $150k); unused losses carry forward. On sale, claimed depreciation is recaptured at up to 25%, and gains may owe capital-gains tax (a 1031 exchange can defer both). Figures are a year-1 estimate at your 24.0% rate — not tax advice; consult a CPA.
Condition & rehab AI · 12 photos
This well-maintained, fully remodeled multi-family property offers strong income potential and is ready for immediate occupancy.
Value-add opportunities
- Both Landscaping improvements — Enhances curb appeal and adds value for both resale and rental.
- Both Update flooring in bathrooms — Modernizes the space and improves aesthetics.
- Both Install smart home features — Enhances convenience and adds value for both resale and rental.
Renovation cost estimate screening
Value-add ROI direction
- Both Landscaping improvements — Enhances curb appeal and adds value for both resale and rental. ↑
- Both Update flooring in bathrooms — Modernizes the space and improves aesthetics. ↑
- Both Install smart home features — Enhances convenience and adds value for both resale and rental. ↑
ⓘ Cost ranges are severity-bucket heuristics (US national rule-of-thumb). Get contractor quotes + a written scope before underwriting a rehab budget.
Schools (NCES district)
- District
- Palm Beach
- NCES district ID
- 1201500
- Math proficiency
- 46% ▼ -16.00%
- Reading proficiency
- 53% ▼ -4.00%
- Median HH income
- $53,943
- Composite
- 42.72/100
- National rank
- #3160
- State rank
- #34 of 73 in FL
Livability — Boca Raton
- Score
- 77/100
- State rank
- #192
- US rank
- #3070
Category grades
Schools grade is shown separately in the Schools card above.
Census & demographics
- Census place
- Boca Raton, FL
- County
- Palm Beach County · 1,438,312 people
- City population
- 250,102
- Metro
- Miami-Fort Lauderdale-Pompano Beach, FL
- Population (ZIP)
- 20,717
- Household income
- $96,066
- Rent vs Own
- Severe rent burden
- 896.0
Population outlook (Palm Beach County) Hauer SSP2
- Today (2025)
- 1,637,487 people
- By 2030
- 1,743,255 · +6.5%
- By 2040
- 1,948,712 · +19.0%
- By 2050
- 2,132,979 · +30.3%
- By 2075
- 2,530,027 · +54.5%
- By 2100
- 2,706,979 · +65.3%
Race, ethnicity, and origin ACS 2023
- Neighborhood character
- Predominantly White (75%)
- Race & ethnicity
- White 75% Hispanic / Latino 13% Two or more races 11% Black 4% Asian 2%
- Hispanic origin (detail)
- Mexican 2% Puerto Rican 1% Cuban 1%
- Common ancestry
- Romanian 7% Scotch-Irish 5% Lithuanian 2%
- Foreign-born
- 21% · Canada, Jamaica, China
- Languages at home
- 77% English-only · Spanish 10% Other Indo-European 4% Russian/Polish/Slavic 3%
Political lean MEDSL · Palm Beach
- 2024 margin
- Toss-up / Even · D 50.0% · R 49.2%
- 2008→2024 swing
- -22.1pp toward R · 2008: 22.9pp · 2024: 0.8pp
- All cycles
- 2024: D+0.8 2020: D+12.8 2016: D+15.3 2012: D+17.0 2008: D+22.9
Not yet ingested
- Civics
- —
Market trends
- HPI YoY
- ▼ -331.59%
- Current HPI
- 352.5852
- Rent YoY
- ▲ 3.58%
- Metro
- Miami-Fort Lauderdale-Pompano Beach, FL
- State GDP YoY
- ▲ 3.28%
- F500 in state
- 36
Industry mix (Fortune 500 HQ in FL)
| Industry | F500 HQs | Revenue |
|---|---|---|
| Industrial Technology | 2 | $29B |
|
||
| Insurance | 2 | $17B |
|
||
| Retail | 1 | $60B |
|
||
| Technology Distribution | 1 | $58B |
|
||
| Homebuilding | 1 | $35B |
|
||
| Technology Manufacturing | 1 | $35B |
|
||
Price history
-9.4% since first listed4 events — show timeline
- 2026-05-02 Price Changed $1,495,000 Beaches MLS
- 2026-04-10 Price Changed $1,550,000 Beaches MLS
- 2026-04-01 Price Changed $1,600,000 Beaches MLS
- 2026-03-20 Listed $1,650,000 Beaches MLS
Cash-flow waterfall
monthlySold comps — $/sqft
last 12 mo · ≤1 miLoading sold comps…