1202 Meadow View Rd · Yankton, SD
Flood risk No data
- FEMA flood zone
- —
- Chance of flooding over 30 yrs
- —
- Est. flood insurance / yr
- —
Fire risk No data
- Est. fire insurance / yr
- —
Heat risk 3/10 · Minor
- Hot days now (above threshold)
- 7 days/yr
- Hot days in 30 yrs
- 14 days/yr
Wind risk No data
- Chance of severe wind over 30 yrs
- —
Air-quality risk 2/10 · Minimal
- Unhealthy air days now
- 1 days/yr
- Unhealthy air days in 30 yrs
- 1 days/yr
Risk factors via First Street. Map © Google.
Why this score? — see what drove the B grade
The composite is a weighted blend of 9 inputs, each scored 0–100. Each bar is that input's sub-score; the figure is the points it added to the 100-point composite (weight × sub-score).
- Cash flow +30.0/30.0
- DSCR +10.0/10.0
- 1% rule +9.4/10.0
- ARV discount +7.5/15.0
- Schools +4.6/10.0
- Livability +3.8/5.0
- Rent growth +2.5/5.0
- Condition / age +2.5/5.0
- Appreciation +0.0/10.0
$85,000
🖨 Deal sheet 📄 Offer letter ✓ Due diligence
Listing remarks MLS
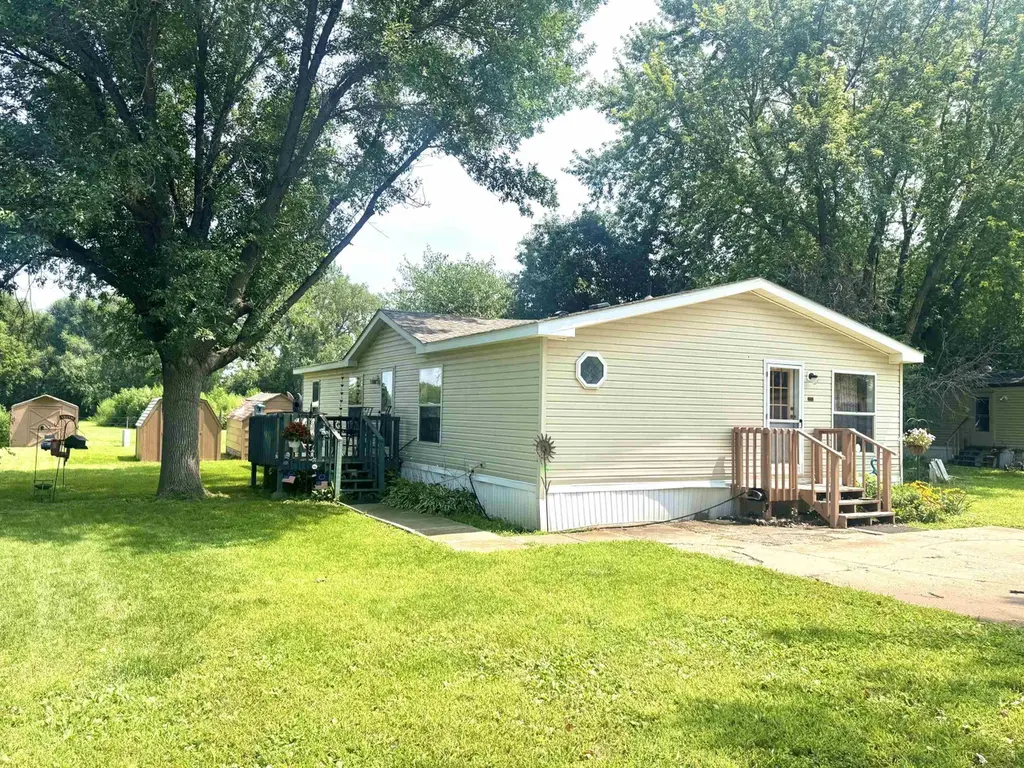
Looking for a home that’s clean, comfy, and easy on the budget? This very well maintained 3-bedroom, 2-bath manufactured home might just check all the boxes. With 1,248 square feet of space, this place gives you room to spread out without feeling lost. It’s nestled in East Winds Mobile Home Park on East Hwy 50 Yankton, and the affordable monthly lot rent is a welcome break for your wallet. Access the deck to catch some fresh air or store your extras in the handy 3 outside sheds. The primary bedroom offers a bit of peace and quiet, while the layout keeps things flowing easily throughout the home. Whether you're relocating, establishing residence, or seeking convenience, this spot is worth a look—because cozy and practical never go out of style.
Key facts
- Built 1998
Neighborhood map
What this means for you Summary
Snapshot
- This is a 3-bed/2.0-bath manufactured listed at $85k.
Deal economics
- At list price, monthly cash flow is $455 ($5k/yr) — positive.
- The deal already cash-flows at list — no discount required.
- Meets the 1% rule at list price ($1k rent vs $85k).
Location & tenants
- Location reads 76/100 on livability (#23 in SD, #3,454 nationally) — a middle-class / working-renter tenant base. Strengths: cost of living A+, housing A+, health & safety A; Watch: amenities F, commute F.
- Yankton School District 63-3 (town): math 49% / reading 60% proficiency, ranked #17 of 59 in SD (top 29%) — acceptable for families but not a draw, mixed tenant base, ~2y average lease.
- Market conditions: 188 active listings in the ZIP; 179 units permitted in Yankton County in 2024 (130 in 5+ unit buildings).
Forward outlook
- Local home prices are declining (-3.0%/yr); year-one equity from $588 of loan paydown is wiped out by about $3k of value loss. Plan a longer hold.
- Yankton County population projected at +4% by 2050 — modest demand growth; plan on rents tracking national, not racing it.
- At projected returns (-3.0% appreciation + 3.0% rent growth), your $24k cash investment doubles in ~6 years — after that, you're playing with house money.
Negotiation context
- Only 0 days on market — expect competitive offers; lowballing is unlikely to land.
- Current owner paid $70k; 21% above their basis — modest negotiation headroom, anchor on the comps not their cost.
Questions for the listing agent
- Is there a deadline driving the sale (1031 exchange, divorce, estate, relocation)? That informs how much negotiation room exists.
- What's the average days-on-market for RENTAL listings here right now (not sales)? A rising rental-DOM trend means longer vacancies and softer asking-rent achievability than the comps imply.
- What's the recent tenant-quality profile in this submarket — average credit score on applications, eviction rate, late-payment / NSF rate, and stable-employment percentage? A property-management company in the area should have these aggregated.
- How much new for-sale + rental construction is in the pipeline within 1–3 miles? Heavy new supply typically softens prices + rents 12–24 months out; constrained supply supports both.
Investment metrics
- 1% rule
- 1.44% ✓
- Cap rate
- 12.71%
- Cash-on-cash
- 22.92%
- DSCR
- 2.02
- GRM
- 5.8
CMA / ARV
No comps found within radius.
Projected returns pro-forma
-3.0% appreciation · 3.0% rent growth · sell at horizon
- IRR
- 15.8%
- Equity multiple
- 1.64×
- Total profit
- $15,150
- Equity at exit
- $12,674
- IRR
- 24.4%
- Equity multiple
- 3.12×
- Total profit
- $50,365
- Equity at exit
- $7,349
Cash invested: $23,800 (down + closing). Projections, not guarantees.
Landlord ↔ Tenant lean methodology
- Overall (STATE)
- 83 Strongly Landlord-Friendly
- State South Dakota
- 83 Strongly Landlord-Friendly · R+16
- County
- — inherits STATE
- City
- — inherits STATE
ZIP-level market 57078
- Active inventory
- 188
- Price-to-rent
- 5.8×
Monthly cashflow live
- Estimated rent
- $1,227 medium interval (Pro) →
- Mortgage (P&I)
- −$446
- Tax from tax record
- −$34 /mo · $404/yr
- Insurance
- −$35
- HOA
- −$0
- Vacancy / Maint / Mgmt
- −$258
- Net cashflow
- $455
Break-even live
UW: 25.0% down · 7.5% · 30yr · 1.5% tax · 5.0% vac · 8.0% maint · 8.0% mgmt
Financing live
Cash to close
- Down payment
- $21,250
- Closing costs
- $2,550
- Reserves months
- —
- Total cash needed
- —
Loan-product check · same deal, 3 products live
Conventional
25% down · 7.5% · 30yr
- Down + closing
- —
- Monthly P&I
- —
- Monthly cashflow
- —
- DSCR
- —
- Eligible?
- —
Personal DTI + credit; lowest rate.
DSCR
20% down · 8.5% · 30yr
- Down + closing
- —
- Monthly P&I
- —
- Monthly cashflow
- —
- DSCR
- —
- Eligible?
- —
No personal income docs; deal must DSCR.
Hard money
10% down · 12.0% · 12mo
- Down + closing
- —
- Monthly P&I
- —
- Monthly cashflow
- —
- DSCR
- —
- Eligible?
- —
Short-term bridge; refi at stabilization.
Listing history 1 events
-
2026-06-12$85,000 Pending
ⓘ Source: listings_history table (triggers on properties + properties_extension) + one-shot
backfill from property_details.listing_events for pre-trigger history.
Tax reassessment forecast SD · Resets to sale price
- Current annual tax
- $404 · $34/mo
- Projected year-2 tax
- $1,114 · $93/mo
- Expected delta
- +$709/yr (+$59/mo · 175.6%)
ⓘ Screening estimate from a state-policy table — verify with the county assessor before closing.
Climate risk First Street
- Heat 3/10 Moderate
- Air quality 2/10 Low 1 unhealthy d/yr today · 1 by 30 yrs out
Nearby sold comps map
Loading sold comps map…
Walkable amenities ~0.75 mi
Loading nearby amenities…
Taxation est. · year 1
- Rental income
- $14,725
- − Mortgage interest
- −$4,761
- − Property taxes
- −$404
- − Insurance
- −$425
- − Repairs & maintenance
- −$1,178
- − Management
- −$1,178
- − Depreciation
- −$2,473
- Taxable income
- $4,306
- Est. tax owed @ 24.0%
- −$1,033
- After-tax cash flow
- $4,421/yr
For passive investors: Depreciation is non-cash, so a rental often shows a tax loss while cash-flowing — sheltering income. Rental losses are passive: they offset passive income freely, and up to $25,000/yr can offset ordinary (W-2) income if you actively participate and your MAGI is under $100k (phasing out to $0 by $150k); unused losses carry forward. On sale, claimed depreciation is recaptured at up to 25%, and gains may owe capital-gains tax (a 1031 exchange can defer both). Figures are a year-1 estimate at your 24.0% rate — not tax advice; consult a CPA.
Schools (NCES district)
- District
- Yankton School District 63-3
- NCES district ID
- 4680430
- Math proficiency
- 49% ▼ -3.00%
- Reading proficiency
- 60% ▼ -1.00%
- Median HH income
- $48,788
- Composite
- 46.36/100
- National rank
- #2463
- State rank
- #17 of 59 in SD
Livability — Yankton
- Score
- 76/100
- State rank
- #23
- US rank
- #3454
Category grades
Schools grade is shown separately in the Schools card above.
Census & demographics
- Population (ZIP)
- 20,547
Population outlook (Yankton County) Hauer SSP2
- Today (2025)
- 23,495 people
- By 2030
- 23,705 · +0.9%
- By 2040
- 24,037 · +2.3%
- By 2050
- 24,561 · +4.5%
- By 2075
- 28,069 · +19.5%
- By 2100
- 33,542 · +42.8%
Race, ethnicity, and origin ACS 2023
- Neighborhood character
- Predominantly White (86%)
- Race & ethnicity
- White 86% Two or more races 7% Hispanic / Latino 6% Native American 3% Black 2%
- Hispanic origin (detail)
- Mexican 3% Cuban 2%
- Common ancestry
- Portuguese 7% Iranian 3% Lithuanian 3%
- Foreign-born
- 3% · Canada
- Languages at home
- 94% English-only · Spanish 4%
Political lean MEDSL · Yankton
- 2024 margin
- Strong R (+25.5) · D 35.9% · R 61.4% · Other 2.8%
- 2008→2024 swing
- -23.6pp toward R · 2008: -2.0pp · 2024: -25.5pp
- All cycles
- 2024: R+25.5 2020: R+23.5 2016: R+24.5 2012: R+12.7 2008: R+2.0
Not yet ingested
- Civics
- —
Market trends
- HPI YoY
- ▼ -113.11%
- Current HPI
- 193.4576
- Rent YoY
- —
- Metro
- —
- State GDP YoY
- ▲ 0.70%
- F500 in state
- 2
Industry mix (Fortune 500 HQ in SD)
| Industry | F500 HQs | Revenue |
|---|---|---|
| Utilities | 1 | $1B |
|
||
Price history
-6.7% since first listed3 events — show timeline
- 2025-09-30 Sold (MLS) $70,000 MARMLS
- 2025-08-11 Pending — MARMLS
- 2025-08-06 Listed $75,000 MARMLS
Property tax history
-1.1%/yrLatest (2025): $404 · -4.8% YoY. Source: county tax records.
Cash-flow waterfall
monthlySold comps — $/sqft
last 12 mo · ≤1 miLoading sold comps…