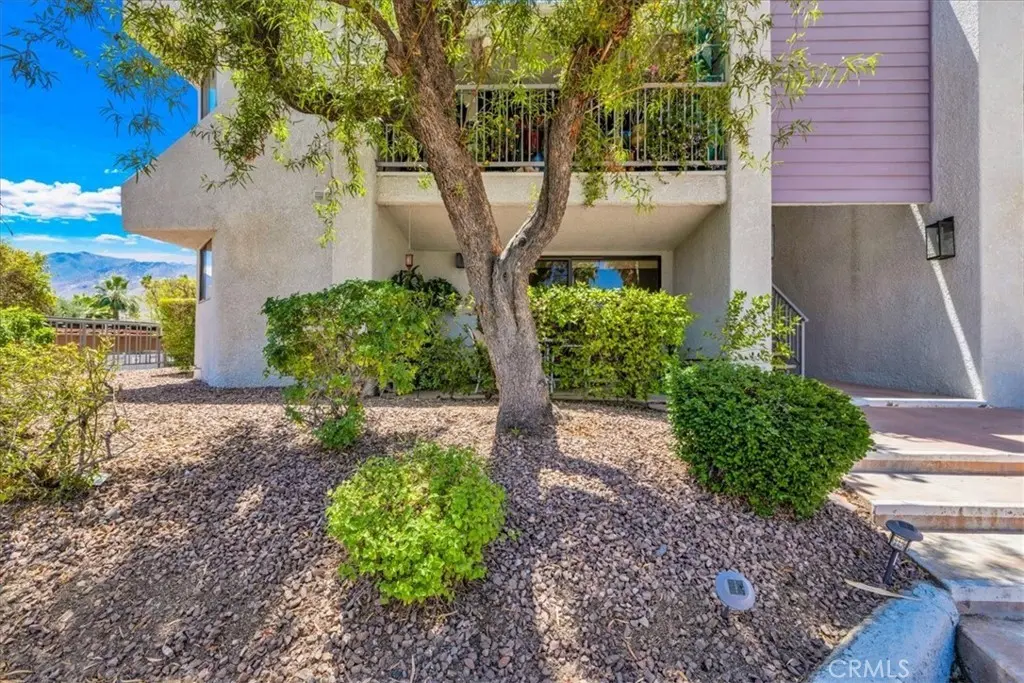
3155 E Ramon Rd #601 · Palm Springs, CA
Flood risk 1/10 · Minimal
- FEMA flood zone
- X (unshaded)
- Chance of flooding over 30 yrs
- 0.0%
- Est. flood insurance / yr
- $507 – $1,088
Fire risk 2/10 · Minimal
- Est. fire insurance / yr
- $659 – $1,223
Heat risk 9/10 · Severe
- Hot days now (above 112°F)
- 7 days/yr
- Hot days in 30 yrs
- 21 days/yr
Wind risk 1/10 · Minimal
- Chance of severe wind over 30 yrs
- —
Air-quality risk 5/10 · Moderate
- Unhealthy air days now
- 6 days/yr
- Unhealthy air days in 30 yrs
- 8 days/yr
Risk factors via First Street. Map © Google.
Why this score? — see what drove the D grade
The composite is a weighted blend of 9 inputs, each scored 0–100. Each bar is that input's sub-score; the figure is the points it added to the 100-point composite (weight × sub-score).
- Cash flow +14.7/30.0
- ARV discount +7.5/15.0
- 1% rule +5.6/10.0
- DSCR +4.5/10.0
- Livability +3.3/5.0
- Schools +2.7/10.0
- Condition / age +2.5/5.0
- Rent growth +2.4/5.0
- Appreciation +0.0/10.0
$350,000
🖨 Deal sheet (PDF) 📄 Offer letter ✓ Due diligence
Listing remarks
Welcome to Ramon Rd! Beautifully situated downstairs corner condo offering the perfect blend of comfort, convenience, and resort-style living in the heart of Palm Springs! EVERY ROOM HAS A VIEW! VIEW OF THE POOL IN THE FRONT, VIEW OF THE TENNIS COURT IN THE BACK, AND MOUNTAIN VIEWS FROM THE SIDE OF THE HOME. TRULY A ONE OF KIND PROPERRTY! This spacious 3-bedroom, 2-bath home features an open-concept living area filled with natural light, creating an inviting space for relaxing or entertaining. Enjoy serene views of the sparkling pool and surrounding mountains right from your unit. Gorgeous new tile flooring! The thoughtfully designed floor plan includes generously sized bedrooms, two full b
Key facts
- $610 HOA
- Parking
- Community pool
Property features AI
Finance
- Other: 88 units in the community
- HOA & community: Part of The Palms association; Monthly association fee; Association fee: $610/month; Association amenities include pool, spa, tennis, pickleball, and barbecue
Exterior
- Parking: 1 parking space; 1 carport space
- Utilities: Public sewer; District/public water
- Home design: Multi-family condominium; Attached unit with one common wall; Single-story (1 story); Entry on level 1
- Construction: Year built per public records
- Exterior features: Community pool and spa (association); Pickleball and tennis courts; Barbecue area; Sidewalks
Interior
- Kitchen: Kitchen (details not provided)
- Bedrooms: 3 bedrooms on the main level
- Bathrooms: 2 full bathrooms on the main level
- Heating & cooling: Central heating (central furnace); Central cooling
- Interior features: One-level floorplan; Main-level living and kitchen; Has view
- Laundry & utility: Laundry in individual room
Neighborhood map
What this means for you Summary
Snapshot
- This is a 3-bed/2.0-bath condo listed at $350k.
Deal economics
- At list price, monthly cash flow is $88 ($1k/yr) — positive.
- The deal already cash-flows at list — no discount required.
- Meets the 1% rule at list price ($4k rent vs $350k).
- Recommended offer: $345k (1.5% below list) — sets the bar for market timing.
- Cap rate 6.6% vs local median 2.7% in Palm Springs — top-decile yield for the area; either an underpriced asset or a hidden risk that comps aren't pricing in. Stress-test before assuming the spread holds.
Location & tenants
- Location reads 66/100 on livability (#348 in CA) — a middle-class / working-renter tenant base. Strengths: amenities A+, commute A+; Watch: crime F, cost of living F, health & safety F.
- Palm Springs Unified (suburban): math 21% / reading 42% proficiency, ranked #328 of 517 in CA (top 63%) — families likely to look elsewhere, expect single-tenant / working-renter base with shorter leases; 73% free/reduced lunch — lower-income household profile, screen leases tightly.
- Zoned schools: Cahuilla Elementary (421 students, 93% FRL); Raymond Cree Middle (708 students, 98% FRL); Palm Springs High (math 30% / reading 51%, grade F, #508 of 1,170 statewide, top 44%, 1,584 students, 97% FRL) — zoned schools average 96% FRL vs 73% district-wide (22 pts higher); higher-poverty schools than district average — tighter screening recommended.
- Market conditions: Rents soft (-0.4%/yr); 498 active listings in the ZIP; 40 comparable units currently listed for rent nearby; rentals at typical pace (median 26d on market — plan ~3-4 weeks tenant-placement turnaround); 40% of comp listings sitting > 30 days — soft ceiling on asking rent; solid renter incomes; 9,195 units permitted in Riverside County in 2024 (1,512 in 5+ unit buildings).
- At $3,695/mo this rent would consume 57% of the median local household income ($78k/yr) (locally 1215% of renters already pay >50% of income on rent) — very limited rent-growth headroom before tenants either downsize or default.
Forward outlook
- Local home prices are declining (-3.0%/yr); year-one equity from $2k of loan paydown is wiped out by about $10k of value loss. Plan a longer hold.
- Riverside County population projected at +22% by 2050 — long-run rental-demand tailwind backs the buy-and-hold thesis.
Negotiation context
- It's been on market 23 days — a 2% lower offer ($345k) is reasonable based on typical stale-listing flexibility.
- 8 sale attempts since 26y ago; this cycle's ask has dropped $25k (7%) from the opening price — seller is motivated, your offer sets the floor, not the list.
- Current owner paid $195k; list at $350k implies a 79% gain — meaningful room to come down on a strong offer.
Risks & watch-outs
- Climate carrying-cost: extreme-heat days projected 7→21/yr by 2055 (HVAC capex compounding) — expect insurance premiums to compound above CPI over the hold.
Questions for the listing agent
- Built in 1979 — when were the roof, HVAC, electrical panel, plumbing, and water heater last replaced?
- What does the HOA fee cover, when was the last increase, and are there any pending special assessments or reserve-fund shortfalls?
- Any open or pending special assessments — roof, HVAC, plumbing, elevator, façade? What's the per-unit balance and payoff schedule, and is the seller paying it off at close or rolling it to the buyer?
- Is there a deadline driving the sale (1031 exchange, divorce, estate, relocation)? That informs how much negotiation room exists.
- Crime grade is F in this area — have there been break-ins, vandalism, or insurance claims at this property in the last 3 years? What carrier currently insures it and at what premium?
- The area grade is low — what's the realistic commute time and amenity access for the typical tenant pool here? Any planned neighborhood developments (good or bad) we should know about?
- What's the average days-on-market for RENTAL listings here right now (not sales)? A rising rental-DOM trend means longer vacancies and softer asking-rent achievability than the comps imply.
- What's the recent tenant-quality profile in this submarket — average credit score on applications, eviction rate, late-payment / NSF rate, and stable-employment percentage? A property-management company in the area should have these aggregated.
- How much new apartment / multifamily construction is in the pipeline within 1–3 miles? Heavy new supply (>2% of stock underway) typically softens rents 12–24 months out; light construction supports rent growth.
Investment metrics
- 1% rule
- 1.06% ✓
- Cap rate
- 6.60%
- Cash-on-cash
- 1.08%
- DSCR
- 1.05
- GRM
- 7.9
CMA / ARV
No comps found within radius.
Projected returns pro-forma
-3.0% appreciation · 0.0% rent growth · sell at horizon
- IRR
- -18.5%
- Equity multiple
- 0.37×
- Total profit
- $-61,610
- Equity at exit
- $52,186
- IRR
- -20.0%
- Equity multiple
- 0.11×
- Total profit
- $-87,003
- Equity at exit
- $30,262
Cash invested: $98,000 (down + closing). Projections, not guarantees.
Landlord ↔ Tenant lean methodology
- Overall (STATE)
- 18 Strongly Tenant-Friendly
- State California
- 18 Strongly Tenant-Friendly · D+13
- County
- — inherits STATE
- City
- — inherits STATE
ZIP-level market 92264
- Rents YoY
- -0.4%
- Active inventory
- 498
- Price-to-rent
- 7.9×
Monthly cashflow live
- Estimated rent
- $3,695 high interval (Pro) →
- Mortgage (P&I)
- −$1,835
- Tax from tax record
- −$240 /mo · $2,877/yr
- Insurance
- −$146
- HOA
- −$610
- Vacancy / Maint / Mgmt
- −$776
- Net cashflow
- $88
Break-even live
Sensitivity live
| Price | -10% $286 | -5% $187 | +0% $88 | +5% $-11 | +10% $-110 |
|---|---|---|---|---|---|
| Rent | -10% $-204 | -5% $-58 | +0% $88 | +5% $234 | +10% $380 |
| Rate | -1.0pp $265 | -0.5pp $177 | base $88 | +0.5pp $-2 | +1.0pp $-95 |
UW: 25.0% down · 7.5% · 30yr · 1.5% tax · 5.0% vac · 8.0% maint · 8.0% mgmt
Financing live
Cash to close
- Down payment
- $87,500
- Closing costs
- $10,500
- Reserves months
- —
- Total cash needed
- —
Loan-product check · same deal, 3 products live
Conventional
25% down · 7.5% · 30yr
- Down + closing
- —
- Monthly P&I
- —
- Monthly cashflow
- —
- DSCR
- —
- Eligible?
- —
Personal DTI + credit; lowest rate.
DSCR
20% down · 8.5% · 30yr
- Down + closing
- —
- Monthly P&I
- —
- Monthly cashflow
- —
- DSCR
- —
- Eligible?
- —
No personal income docs; deal must DSCR.
Hard money
10% down · 12.0% · 12mo
- Down + closing
- —
- Monthly P&I
- —
- Monthly cashflow
- —
- DSCR
- —
- Eligible?
- —
Short-term bridge; refi at stabilization.
Rent comps 40 comps
| Address | Beds | Baths | Sqft | Rent | $/sqft | DOM | Units | Dist |
|---|---|---|---|---|---|---|---|---|
| 500 S Farrell Dr Palm Springs, CA | 1.0–2.0 | 1.0–2.0 | 986 | $5,700 | $5.78 | 45d | 3 | 0.16mi |
| 622 S Highland Dr Palm Springs, CA | 3.0 | 3.0 | 1523 | $6,000 | $3.94 | 45d | 1 | 0.32mi |
| 505 S Farrell Dr Palm Springs, CA | 1.0–2.0 | 1.0–2.0 | 986 | $2,700 | $2.74 | 4d | 4 | 0.33mi |
| 505 S Farrell Dr Palm Springs, CA | 2.0 | 2.0 | 1175 | $2,450 | $2.09 | 45d | 5 | 0.33mi |
| 425 Bradshaw Ln #63 Palm Springs, CA | 2.0 | 2.0 | 960 | $1,950 | $2.03 | 45d | 1 | 0.34mi |
| 2240 Sunshine Way Palm Springs, CA | 3.0 | 2.0 | 1350 | $2,250 | $1.67 | 26d | 1 | 0.39mi |
| 2700 E Mesquite Ave Palm Springs, CA | 2.0 | 2.0 | 1175 | $3,025 | $2.57 | 45d | 2 | 0.43mi |
| 3730 E Camino San Miguel Palm Springs, CA | 2.0 | 2.0 | 1711 | $3,500 | $2.05 | 45d | 1 | 0.49mi |
| 2701 E Mesquite Ave Palm Springs, CA | 2.0 | 2.0 | 1175 | $2,898 | $2.47 | 16d | 4 | 0.53mi |
| 2701 E Mesquite Ave Palm Springs, CA | 2.0 | 2.0 | 1175 | $3,435 | $2.92 | 22d | 4 | 0.53mi |
| 2701 E Mesquite Ave Palm Springs, CA | 2.0 | 2.0 | 1175 | $2,982 | $2.54 | 26d | 5 | 0.53mi |
| 2001 E Camino Parocela Unit D29 Palm Springs, CA | 2.0 | 2.0 | 1175 | $3,900 | $3.32 | 45d | 1 | 0.61mi |
| 2890 E Tahquitz Canyon Way Palm Springs, CA | 2.0–3.0 | 1.5–2.0 | 1127 | $2,725 | $2.42 | 0d | 18 | 0.61mi |
| 2720 E Tahquitz Canyon Way Palm Springs, CA | 1.0–2.0 | 1.0–2.0 | 855 | $2,100 | $2.46 | 1d | 9 | 0.63mi |
| 2300 E Tahquitz Canyon Way Palm Springs, CA | 1.0–2.0 | 1.0–2.0 | 851 | $2,045 | $2.40 | 12d | 6 | 0.71mi |
| 2056 Paseo Roseta Palm Springs, CA | 3.0 | 3.0 | 1730 | $9,900 | $5.72 | 16d | 1 | 0.79mi |
| 2056 Paseo Roseta Palm Springs, CA | 3.0 | 3.0 | 1730 | $9,900 | $5.72 | 45d | 1 | 0.79mi |
| 3113 E San Martin Cir Palm Springs, CA | 3.0 | 2.0 | 1737 | $3,950 | $2.27 | 45d | 1 | 0.81mi |
| 280 N Monterey Rd Palm Springs, CA | 3.0 | 2.0 | 1278 | $4,100 | $3.21 | 45d | 1 | 0.82mi |
| 2007 E Andreas Rd Palm Springs, CA | 3.0 | 2.0 | 1593 | $3,800 | $2.39 | 45d | 1 | 0.87mi |
| 4373 E Camino Parocela Palm Springs, CA | 3.0 | 2.0 | 1375 | $3,450 | $2.51 | 7d | 1 | 0.88mi |
| 311 S Sunrise Way Palm Springs, CA | 2.0 | 1.0–2.0 | 688 | $2,350 | $3.42 | 26d | 18 | 0.89mi |
| 1745 E Arenas Rd Unit 11 Palm Springs, CA | 2.0 | 2.0 | 900 | $1,975 | $2.19 | 45d | 1 | 0.90mi |
| 3180 E Escoba Dr Palm Springs, CA | 3.0 | 2.0 | 1532 | $7,500 | $4.90 | 1d | 1 | 0.94mi |
| 1506 E Baristo Rd Palm Springs, CA | 2.0 | 3.0 | 1744 | $6,000 | $3.44 | 26d | 1 | 0.97mi |
| 1710 E Sonora Rd Palm Springs, CA | 2.0 | 2.0 | 1391 | $2,800 | $2.01 | 26d | 1 | 1.03mi |
| 1816 Pintura Cir W Palm Springs, CA | 2.0 | 3.0 | 1650 | $3,145 | $1.91 | 45d | 1 | 1.04mi |
| 1745 Capri Cir Palm Springs, CA | 2.0 | 2.0 | 1200 | $2,495 | $2.08 | 26d | 1 | 1.05mi |
| 3545 Ridgeview Cir Palm Springs, CA | 3.0 | 2.5 | 1783 | $9,750 | $5.47 | 26d | 1 | 1.06mi |
| 3545 Ridgeview Cir Palm Springs, CA | 3.0 | 3.0 | 1783 | $5,675 | $3.18 | 45d | 1 | 1.06mi |
| 3545 Ridgeview Cir Palm Springs, CA | 3.0 | 2.5 | 1783 | $9,750 | $5.47 | 5d | 1 | 1.06mi |
| 1423 E San Lorenzo Rd Palm Springs, CA | 4.0 | 2.0 | 1824 | $4,200 | $2.30 | 26d | 1 | 1.07mi |
| 1700 S Araby Dr Palm Springs, CA | 1.0–2.0 | 1.0–2.0 | 871 | $2,682 | $3.08 | 0d | 5 | 1.10mi |
| 1111 E Ramon Rd #87 Palm Springs, CA | 3.0 | 2.0 | 1313 | $4,500 | $3.43 | 19d | 1 | 1.15mi |
| 1111 E Ramon Rd Palm Springs, CA | 2.0–3.0 | 2.0 | 1191 | $4,500 | $3.78 | 18d | 2 | 1.16mi |
| 1111 E Ramon Rd Palm Springs, CA | 2.0–3.0 | 2.0 | 1191 | $4,500 | $3.78 | 26d | 2 | 1.16mi |
| 177 Westlake Dr Palm Springs, CA | 2.0 | 2.0 | 1545 | $12,500 | $8.09 | 45d | 1 | 1.17mi |
| 1050 E Ramon Rd Palm Springs, CA | 2.0 | 2.0 | 1253 | $3,815 | $3.04 | 45d | 2 | 1.17mi |
| 1050 E Ramon Rd Palm Springs, CA | 2.0 | 2.0 | 1135 | $3,264 | $2.88 | 1d | 3 | 1.17mi |
| 449 Desert Lakes Dr Palm Springs, CA | 2.0 | 2.0 | 1778 | $3,000 | $1.69 | 26d | 1 | 1.24mi |
HOA detail condo
- Monthly dues
- $610 · $7,320/yr
- Likely covers
- pool
- Assessments
- None detected in remarks — confirm with the listing agent.
Listing history 50 events
-
2026-06-22price $350,000 Active 23 DOM
-
2026-06-21days on market $375,000 Active 23 DOM
-
2026-06-18days on market $375,000 Active 20 DOM
-
2026-06-17days on market $375,000 Active 19 DOM
-
2026-06-16days on market $375,000 Active 18 DOM
-
2026-06-15days on market $375,000 Active 17 DOM
-
2026-06-13days on market $375,000 Active 15 DOM
-
2026-06-13days on market $375,000 Active 14 DOM
-
2026-06-09days on market $375,000 Active 11 DOM
-
2026-06-08days on market $375,000 Active 10 DOM
-
2026-06-07days on market $375,000 Active 9 DOM
-
2026-06-04days on market $375,000 Active 6 DOM
-
2026-06-03days on market $375,000 Active 5 DOM
-
2026-06-02days on market $375,000 Active 4 DOM
-
2026-06-01days on market $375,000 Active 3 DOM
-
2026-05-31days on market $375,000 Active 2 DOM
-
2026-05-29$375,000 Active
-
2026-05-27historical $375,000
-
2026-04-18price $399,900
-
2026-04-05price $349,900
-
2026-02-28price $339,900
-
2026-02-05price $344,900
-
2026-01-09price $349,900
-
2025-11-26price $354,900
-
2025-11-09price $359,900
-
2025-10-25price $369,900
-
2025-10-17$399,000 Active
-
2025-08-19historical $2,800
-
2025-08-19historical
-
2025-05-21price $419,000
-
2025-05-14$2,800
-
2025-04-22price $435,000
-
2025-02-25historical $3,200
-
2025-02-19$445,000 Active
-
2025-02-13$3,200
-
2016-07-22soldstatus $195,000 Closed
-
2016-07-21soldstatus $195,000
-
2016-07-18status Pending
-
2016-06-02status Backup Offers Accepted
-
2016-04-24$190,000 Active
-
2013-09-04soldstatus $167,000 Closed
-
2013-09-04soldstatus $167,000
-
2013-04-29status Backup Offers Accepted
-
2013-04-23$175,000 Active
-
2003-10-21soldstatus $142,000
-
2000-03-06soldstatus $79,900
-
2000-03-06soldstatus $80,000
-
2000-01-30$79,900
-
1989-08-21soldstatus $78,500
-
1986-10-31soldstatus $74,500
ⓘ Source: listings_history table (triggers on properties + properties_extension) + one-shot
backfill from property_details.listing_events for pre-trigger history.
Tax reassessment forecast CA · Resets to sale price
- Current annual tax
- $2,877 · $240/mo
- Projected year-2 tax
- $2,877 · $240/mo
- Expected delta
- $0/yr ($0/mo · 0.0%)
ⓘ Screening estimate from a state-policy table — verify with the county assessor before closing.
Climate risk First Street
- Flood 1/10 Low FEMA zone X (unshaded) · 0% chance over 30 yrs
- Wildfire 2/10 Low
- Heat 9/10 Extreme 7 d/yr ≥112°F today · 21 d/yr by 30 yrs out
- Wind 1/10 Low
- Air quality 5/10 Major 6 unhealthy d/yr today · 8 by 30 yrs out
Nearby sold comps map
Loading sold comps map…
Walkable amenities ~0.75 mi
Loading nearby amenities…
Taxation est. · year 1
- Rental income
- $44,345
- − Mortgage interest
- −$19,605
- − Property taxes
- −$2,877
- − Insurance
- −$1,750
- − Repairs & maintenance
- −$3,548
- − Management
- −$3,548
- − HOA
- −$7,320
- − Depreciation
- −$10,182
- Taxable loss
- −$4,485
- Est. tax savings @ 24.0%
- +$1,076
- After-tax cash flow
- $2,136/yr
For passive investors: Depreciation is non-cash, so a rental often shows a tax loss while cash-flowing — sheltering income. Rental losses are passive: they offset passive income freely, and up to $25,000/yr can offset ordinary (W-2) income if you actively participate and your MAGI is under $100k (phasing out to $0 by $150k); unused losses carry forward. On sale, claimed depreciation is recaptured at up to 25%, and gains may owe capital-gains tax (a 1031 exchange can defer both). Figures are a year-1 estimate at your 24.0% rate — not tax advice; consult a CPA.
Schools (NCES district)
- District
- Palm Springs Unified
- NCES district ID
- 0629550
- Math proficiency
- 21% ▼ -7.00%
- Reading proficiency
- 42% ▬ 0.00%
- Median HH income
- $43,638
- Composite
- 26.76/100
- National rank
- #7131
- State rank
- #328 of 517 in CA
Livability — Palm Springs
- Score
- 66/100
- State rank
- #348
- US rank
- #11850
Category grades
Schools grade is shown separately in the Schools card above.
Census & demographics
- Census place
- Palm Springs, CA
- County
- Riverside County · 2,287,001 people
- City population
- 46,786
- Metro
- Riverside-San Bernardino-Ontario, CA
- Population (ZIP)
- 19,899
- Household income
- $77,688
- Rent vs Own
- Severe rent burden
- 1215.0
Population outlook (Riverside County) Hauer SSP2
- Today (2025)
- 2,664,475 people
- By 2030
- 2,802,692 · +5.2%
- By 2040
- 3,050,904 · +14.5%
- By 2050
- 3,256,783 · +22.2%
- By 2075
- 3,655,058 · +37.2%
- By 2100
- 3,766,594 · +41.4%
Race, ethnicity, and origin ACS 2023
- Neighborhood character
- Predominantly White (68%)
- Race & ethnicity
- White 68% Hispanic / Latino 20% Two or more races 12% Asian 6% Black 2% Native American 1%
- Hispanic origin (detail)
- Mexican 16%
- Common ancestry
- Lithuanian 4% Romanian 3% Slovak 3%
- Foreign-born
- 16% · Canada, China, South Korea
- Languages at home
- 81% English-only · Spanish 13% Tagalog/Filipino 2% Other Asian/Pacific 1%
Political lean MEDSL · Riverside
- 2024 margin
- Toss-up / Even · D 48.0% · R 49.3% · Other 2.6%
- 2008→2024 swing
- -3.6pp toward R · 2008: 2.3pp · 2024: -1.3pp
- All cycles
- 2024: R+1.3 2020: D+8.0 2016: D+4.3 2012: R+0.4 2008: D+2.3
Not yet ingested
- Civics
- —
Market trends
- HPI YoY
- ▼ -489.04%
- Current HPI
- 357.0969
- Rent YoY
- ▼ -0.43%
- Metro
- Riverside-San Bernardino-Ontario, CA
- State GDP YoY
- ▲ 3.21%
- F500 in state
- 116
Industry mix (Fortune 500 HQ in CA)
| Industry | F500 HQs | Revenue |
|---|---|---|
| Technology | 27 | $1,492B |
|
||
| Financial Services | 3 | $174B |
|
||
| Retail | 3 | $44B |
|
||
| Insurance | 3 | $26B |
|
||
| Media / Entertainment | 2 | $115B |
|
||
| Pharmaceuticals / Biotech | 2 | $62B |
|
||
Price history
+403.4% since first listed34 events — show timeline
- 2026-05-29 Listed $375,000 CRMLS
- 2026-05-27 Coming Soon $375,000 CRMLS
- 2026-04-18 Price Changed $399,900 CRMLS
- 2026-04-05 Price Changed $349,900 CRMLS
- 2026-02-28 Price Changed $339,900 CRMLS
- 2026-02-05 Price Changed $344,900 CRMLS
- 2026-01-09 Price Changed $349,900 CRMLS
- 2025-11-26 Price Changed $354,900 CRMLS
- 2025-11-09 Price Changed $359,900 CRMLS
- 2025-10-25 Price Changed $369,900 CRMLS
- 2025-10-17 Listed $399,000 CRMLS
- 2025-08-19 Rental Removed $2,800 CRMLS
- 2025-08-19 Listing Removed — GPSMLS
- 2025-05-21 Price Changed $419,000 GPSMLS
- 2025-05-14 Listed for Rent $2,800 CRMLS
- 2025-04-22 Price Changed $435,000 GPSMLS
- 2025-02-25 Rental Removed $3,200 CRMLS
- 2025-02-19 Listed $445,000 GPSMLS
- 2025-02-13 Listed for Rent $3,200 CRMLS
- 2016-07-22 Sold (MLS) $195,000 GPSMLS
- 2016-07-21 Sold (Public Records) $195,000 Public Records
- 2016-07-18 Pending — GPSMLS
- 2016-06-02 Pending — GPSMLS
- 2016-04-24 Listed $190,000 GPSMLS
- 2013-09-04 Sold (Public Records) $167,000 Public Records
- 2013-09-04 Sold (MLS) $167,000 GPSMLS
- 2013-04-29 Pending — GPSMLS
- 2013-04-23 Listed $175,000 GPSMLS
- 2003-10-21 Sold (Public Records) $142,000 Public Records
- 2000-03-06 Sold (Public Records) $80,000 Public Records
- 2000-03-06 Sold (MLS) $79,900 GPSMLS
- 2000-01-30 Listed $79,900 GPSMLS
- 1989-08-21 Sold (Public Records) $78,500 Public Records
- 1986-10-31 Sold (Public Records) $74,500 Public Records
Property tax history
+2.7%/yrLatest (2025): $2,877 · -2.5% YoY. Source: county tax records.
Cash-flow waterfall
monthlySold comps — $/sqft
last 12 mo · ≤1 miLoading sold comps…