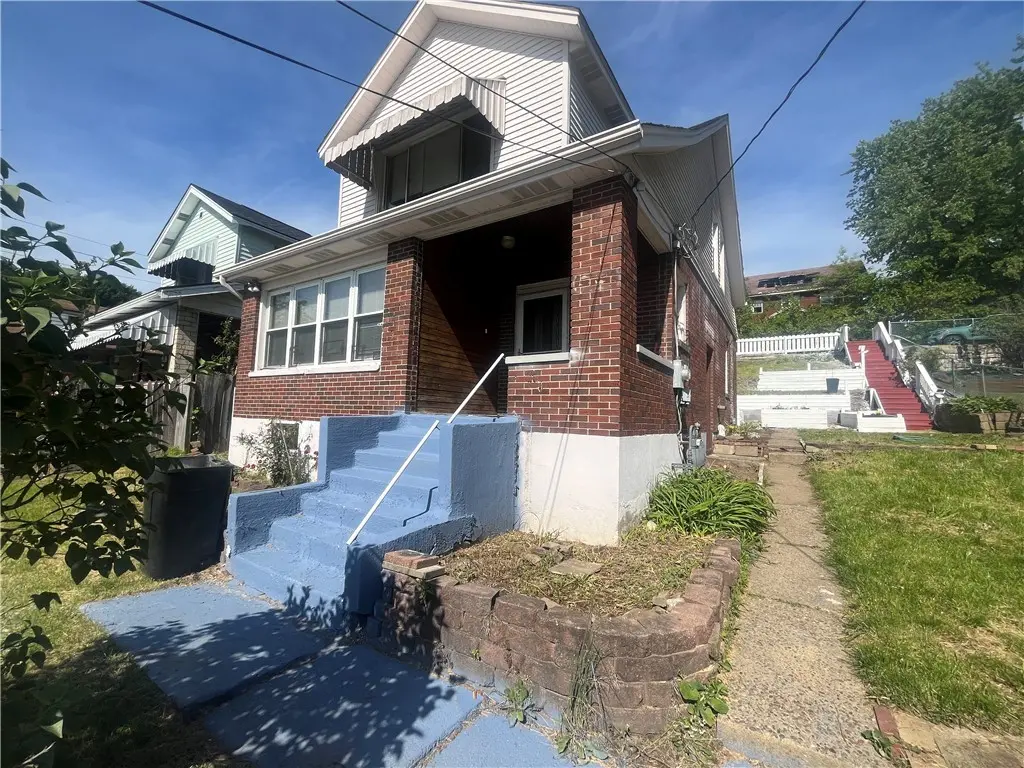
729 Ohio Ave · Glassport, PA
Flood risk 1/10 · Minimal
- FEMA flood zone
- X (unshaded)
- Chance of flooding over 30 yrs
- 0.0%
- Est. flood insurance / yr
- $473 – $860
Fire risk 1/10 · Minimal
- Est. fire insurance / yr
- $511 – $949
Heat risk 4/10 · Minor
- Hot days now (above 97°F)
- 7 days/yr
- Hot days in 30 yrs
- 19 days/yr
Wind risk 2/10 · Minimal
- Chance of severe wind over 30 yrs
- —
Air-quality risk 5/10 · Moderate
- Unhealthy air days now
- 8 days/yr
- Unhealthy air days in 30 yrs
- 8 days/yr
Risk factors via First Street. Map © Google.
Why this score? — see what drove the C grade
The composite is a weighted blend of 9 inputs, each scored 0–100. Each bar is that input's sub-score; the figure is the points it added to the 100-point composite (weight × sub-score).
- Cash flow +23.0/30.0
- DSCR +7.4/10.0
- 1% rule +5.6/10.0
- ARV discount +5.2/15.0
- Appreciation +5.1/10.0
- Livability +3.6/5.0
- Schools +2.8/10.0
- Rent growth +2.5/5.0
- Condition / age +2.5/5.0
$129,900
🖨 Deal sheet 📄 Offer letter ✓ Due diligence
Listing remarks MLS
Three Bedroom, 2 Full Baths, Two Story Home, Back Of home Offers On Street Parking, Terraced Yard, Spacious Living Room, And Separate Dining Room
Key facts
- Sunroom
- Finished gameroom
- 5,501 sq ft lot
Tags
Property features AI
Exterior
- Parking: On-street parking
- Utilities: Public water; Public sewer
- Home design: 2-story; Resale property
- Construction: Brick and frame construction; Asphalt roof
- Exterior features: On-street parking; Public water; Public sewer; Public transportation nearby
Interior
- Kitchen: Dishwasher; Refrigerator; Stove
- Flooring: Carpet; Laminate
- Bathrooms: 2 full bathrooms
- Heating & cooling: Forced air heating (gas); Wall/window cooling units
- Interior features: Interior entry basement; Some gas appliances
Neighborhood map
What this means for you Summary
Snapshot
- This is a 3-bed/2.0-bath single-family listed at $130k.
Deal economics
- At list price, monthly cash flow is $230 ($3k/yr) — positive.
- The deal already cash-flows at list — no discount required.
- Meets the 1% rule at list price ($1k rent vs $130k).
- Recommended offer: $126k (3.0% below list) — sets the bar for market timing.
Location & tenants
- Location reads 71/100 on livability (#716 in PA) — a middle-class / working-renter tenant base. Strengths: cost of living A+, housing A+, commute A-; Watch: crime C-, employment D+, schools D-.
- South Allegheny SD (suburban): math 23% / reading 44% proficiency, ranked #430 of 539 in PA (top 80%) — families likely to look elsewhere, expect single-tenant / working-renter base with shorter leases.
- Market conditions: 24 active listings in the ZIP; 7 comparable units currently listed for rent nearby; rentals lingering (median 44d on market — plan ~5-8 weeks vacancy on turnover, expect pricing pressure); 57% of comp listings sitting > 30 days — soft ceiling on asking rent; 2,996 units permitted in Allegheny County in 2024 (1,588 in 5+ unit buildings).
Forward outlook
- In year one you build about $1k of equity ($898 loan paydown + $231 appreciation (0.2% local appreciation)).
- At projected returns (0.2% appreciation + 3.0% rent growth), your $36k cash investment doubles in ~7 years — after that, you're playing with house money.
Negotiation context
- It's been on market 36 days — a 3% lower offer ($126k) is reasonable based on typical stale-listing flexibility.
- 5 sale attempts since 29y ago with the ask held roughly flat each time — persistent listings suggest the price (not the market) is what's stuck; bring a comps-based counter.
- Current owner paid $12k; list at $130k implies a 939% gain — meaningful room to come down on a strong offer.
Risks & watch-outs
- Watch-outs: built in 1927 — expect roof / HVAC / electrical / plumbing capex.
Questions for the listing agent
- It's been on market 36 days. Have you received any prior offers? Is the seller open to a 3% concession, seller financing, or rate buy-down credit?
- Built in 1927 — when were the roof, HVAC, electrical panel, plumbing, and water heater last replaced?
- Is there a deadline driving the sale (1031 exchange, divorce, estate, relocation)? That informs how much negotiation room exists.
- Schools are D-rated, which usually means shorter tenancies and higher turnover. Who's the typical renter profile here, and what's been the actual vacancy rate?
- What's the average days-on-market for RENTAL listings here right now (not sales)? A rising rental-DOM trend means longer vacancies and softer asking-rent achievability than the comps imply.
- What's the recent tenant-quality profile in this submarket — average credit score on applications, eviction rate, late-payment / NSF rate, and stable-employment percentage? A property-management company in the area should have these aggregated.
- How much new for-sale + rental construction is in the pipeline within 1–3 miles? Heavy new supply typically softens prices + rents 12–24 months out; constrained supply supports both.
Investment metrics
- 1% rule
- 1.06% ✓
- Cap rate
- 8.42%
- Cash-on-cash
- 7.60%
- DSCR
- 1.34
- GRM
- 7.9
CMA / ARV
- ARV (median comp)
- $123,623
- List price
- $129,900
- Delta
- 5.08%
- Verdict
- FAIR
- Comps
- 20 within 1.0 mi
Show comp detail 12 sales within ~0.75 mi
| Address | Dist | Beds/Ba | Sqft | Sold | Price | $/sf | Match |
|---|---|---|---|---|---|---|---|
| 643 Indiana Ave | 0.17mi | 4/1.5 (+1) | 1,440 (-1%) | 0mo | $160,000 | $111 | 83 |
| 726 Indiana | 0.13mi | 3/2.0 | 1,512 (+4%) | 13mo | $122,000 | $81 | 77 |
| 923 Vermont Ave | 0.23mi | 3/1.5 | 1,620 (+11%) | 0mo | $189,900 | $117 | 68 |
| 622 Summit Ave | 0.37mi | 3/1.5 | 1,572 (+8%) | 3mo | $110,000 | $70 | 65 |
| 1319 New England | 0.60mi | 3/1.5 | 1,440 (-1%) | 6mo | $200,000 | $139 | 63 |
| 301 Euclid Ave | 0.52mi | 3/1.0 | 1,408 (-3%) | 8mo | $110,000 | $78 | 59 |
| 813 Vermont Ave | 0.12mi | 4/4.0 (+1) | 1,550 (+6%) | 15mo | $199,500 | $129 | 58 |
| 435 Ohio Ave | 0.32mi | 2/1.5 (-1) | 1,334 (-8%) | 9mo | $144,000 | $108 | 57 |
| 1025 Delaware Ave | 0.39mi | 4/2.5 (+1) | 1,386 (-5%) | 13mo | $75,000 | $54 | 56 |
| 302 Euclid Ave | 0.51mi | 3/1.5 | 1,368 (-6%) | 13mo | $50,000 | $37 | 54 |
| 922 Foster Rd | 0.65mi | 3/1.5 | 1,560 (+7%) | 10mo | $250,000 | $160 | 48 |
| 1029 Vermont Ave | 0.38mi | 4/1.5 (+1) | 1,618 (+11%) | 14mo | $171,000 | $106 | 46 |
Match score weights: distance 35% · size 25% · config 20% · recency 20%. Top-matched comps best support the ARV.
Projected returns pro-forma
0.18% appreciation · 3.0% rent growth · sell at horizon
- IRR
- 6.8%
- Equity multiple
- 1.33×
- Total profit
- $11,964
- Equity at exit
- $38,881
- IRR
- 11.7%
- Equity multiple
- 2.31×
- Total profit
- $47,578
- Equity at exit
- $47,673
Cash invested: $36,372 (down + closing). Projections, not guarantees.
Landlord ↔ Tenant lean methodology
- Overall (STATE)
- 62 Landlord-Friendly
- State Pennsylvania
- 62 Landlord-Friendly · EVEN
- County
- — inherits STATE
- City
- — inherits STATE
ZIP-level market 15045
- Home prices YoY
- 0.1%
- Active inventory
- 24
- Price-to-rent
- 7.9×
Monthly cashflow live
- Estimated rent
- $1,372 high interval (Pro) →
- Mortgage (P&I)
- −$681
- Tax from tax record
- −$118 /mo · $1,415/yr
- Insurance
- −$54
- HOA
- −$0
- Vacancy / Maint / Mgmt
- −$288
- Net cashflow
- $230
Break-even live
UW: 25.0% down · 7.5% · 30yr · 1.5% tax · 5.0% vac · 8.0% maint · 8.0% mgmt
Financing live
Cash to close
- Down payment
- $32,475
- Closing costs
- $3,897
- Reserves months
- —
- Total cash needed
- —
Loan-product check · same deal, 3 products live
Conventional
25% down · 7.5% · 30yr
- Down + closing
- —
- Monthly P&I
- —
- Monthly cashflow
- —
- DSCR
- —
- Eligible?
- —
Personal DTI + credit; lowest rate.
DSCR
20% down · 8.5% · 30yr
- Down + closing
- —
- Monthly P&I
- —
- Monthly cashflow
- —
- DSCR
- —
- Eligible?
- —
No personal income docs; deal must DSCR.
Hard money
10% down · 12.0% · 12mo
- Down + closing
- —
- Monthly P&I
- —
- Monthly cashflow
- —
- DSCR
- —
- Eligible?
- —
Short-term bridge; refi at stabilization.
Rent comps 7 comps
| Address | Beds | Baths | Sqft | Rent | $/sqft | DOM | Units | Dist |
|---|---|---|---|---|---|---|---|---|
| 833 Vermont Ave Glassport, PA | 3.0 | 1.0 | 1290 | $1,395 | $1.08 | 23d | 1 | 0.15mi |
| 1044 Delaware Ave Glassport, PA | 3.0 | 1.0 | 1200 | $1,350 | $1.12 | 20d | 1 | 0.40mi |
| 231 Connecticut Ave Clairton, PA | 3.0 | 1.0 | 1064 | $1,150 | $1.08 | 43d | 1 | 0.88mi |
| 311 Harrison St Glassport, PA | 4.0 | 1.0 | 1200 | $1,500 | $1.25 | 43d | 1 | 0.92mi |
| 185 Carnegie Ave Clairton, PA | 3.0 | 1.0 | 1404 | $1,295 | $0.92 | 43d | 1 | 1.05mi |
| 507 N 6th St Clairton, PA | 2.0 | 1.5 | 1120 | $1,250 | $1.12 | 43d | 1 | 1.22mi |
| 1805 Gray St McKeesport, PA | 3.0 | 1.0 | 1136 | $1,600 | $1.41 | 1d | 1 | 1.47mi |
Listing history 26 events
-
2026-06-18days on market $129,900 Active 36 DOM
-
2026-06-17days on market $129,900 Active 35 DOM
-
2026-06-16days on market $129,900 Active 34 DOM
-
2026-06-15days on market $129,900 Active 33 DOM
-
2026-06-13days on market $129,900 Active 31 DOM
-
2026-06-13days on market $129,900 Active 30 DOM
-
2026-06-09days on market $129,900 Active 27 DOM
-
2026-06-08days on market $129,900 Active 26 DOM
-
2026-06-07days on market $129,900 Active 25 DOM
-
2026-06-05days on market $129,900 Active 22 DOM
-
2026-06-03days on market $129,900 Active 21 DOM
-
2026-06-02days on market $129,900 Active 20 DOM
-
2026-06-01days on market $129,900 Active 19 DOM
-
2026-05-31days on market $129,900 Active 18 DOM
-
2026-05-13$129,900 Active 479-char remark
-
2025-06-13price $125,000 145-char remark
Show marketing remark (145 chars)
Three Bedroom, 2 Full Baths, Two Story Home, Back Of home Offers On Street Parking, Terraced Yard, Spacious Living Room, And Separate Dining Room
-
2024-11-26$110,000 Active 145-char remark
Show marketing remark (145 chars)
Three Bedroom, 2 Full Baths, Two Story Home, Back Of home Offers On Street Parking, Terraced Yard, Spacious Living Room, And Separate Dining Room
-
2021-01-30$68,000 Active
Show marketing remark (50 chars)
Nice Home with newer furnace and hot water tank. .
-
2009-02-06soldstatus $12,500
-
2009-01-23soldstatus $12,500
-
2009-01-23price $14,900
-
2008-12-10$12,500
-
1997-10-08soldstatus $40,000
-
1997-10-06soldstatus $40,000
-
1997-07-30$39,000
-
1986-04-24soldstatus $25,000
ⓘ Source: listings_history table (triggers on properties + properties_extension) + one-shot
backfill from property_details.listing_events for pre-trigger history.
Tax reassessment forecast PA · Partial reset (capped growth)
- Current annual tax
- $1,415 · $118/mo
- Projected year-2 tax
- $1,734 · $144/mo
- Expected delta
- +$319/yr (+$27/mo · 22.5%)
ⓘ Screening estimate from a state-policy table — verify with the county assessor before closing.
Climate risk First Street
- Flood 1/10 Low FEMA zone X (unshaded) · 0% chance over 30 yrs
- Wildfire 1/10 Low
- Heat 4/10 Moderate 7 d/yr ≥97°F today · 19 d/yr by 30 yrs out
- Wind 2/10 Low
- Air quality 5/10 Major 8 unhealthy d/yr today · 8 by 30 yrs out
Nearby sold comps map
Loading sold comps map…
Walkable amenities ~0.75 mi
Loading nearby amenities…
Taxation est. · year 1
- Rental income
- $16,462
- − Mortgage interest
- −$7,276
- − Property taxes
- −$1,415
- − Insurance
- −$650
- − Repairs & maintenance
- −$1,317
- − Management
- −$1,317
- − Depreciation
- −$3,779
- Taxable income
- $708
- Est. tax owed @ 24.0%
- −$170
- After-tax cash flow
- $2,596/yr
For passive investors: Depreciation is non-cash, so a rental often shows a tax loss while cash-flowing — sheltering income. Rental losses are passive: they offset passive income freely, and up to $25,000/yr can offset ordinary (W-2) income if you actively participate and your MAGI is under $100k (phasing out to $0 by $150k); unused losses carry forward. On sale, claimed depreciation is recaptured at up to 25%, and gains may owe capital-gains tax (a 1031 exchange can defer both). Figures are a year-1 estimate at your 24.0% rate — not tax advice; consult a CPA.
Schools (NCES district)
- District
- South Allegheny SD
- NCES district ID
- 4221910
- Math proficiency
- 23% ▼ -10.00%
- Reading proficiency
- 44% ▼ -13.00%
- Median HH income
- $40,891
- Composite
- 28.15/100
- National rank
- #6815
- State rank
- #430 of 539 in PA
Livability — Glassport
- Score
- 71/100
- State rank
- #716
- US rank
- #7113
Category grades
Schools grade is shown separately in the Schools card above.
Census & demographics
- Census place
- Glassport, PA
- City population
- 4,400
- Population (ZIP)
- 4,400
Population outlook (Allegheny County) Hauer SSP2
- Today (2025)
- 1,250,282 people
- By 2030
- 1,256,482 · +0.5%
- By 2040
- 1,256,318 · +0.5%
- By 2050
- 1,244,169 · -0.5%
- By 2075
- 1,197,693 · -4.2%
- By 2100
- 1,093,187 · -12.6%
Race, ethnicity, and origin ACS 2023
- Neighborhood character
- Predominantly White (88%)
- Race & ethnicity
- White 88% Hispanic / Latino 6% Black 4% Two or more races 3%
- Hispanic origin (detail)
- Mexican 4%
- Common ancestry
- Romanian 18% Portuguese 6% Serbian 6%
- Foreign-born
- 1% · South Korea, Canada
- Languages at home
- 97% English-only · German/W. Germanic 1% Spanish 1% Korean 1%
Political lean MEDSL · Allegheny
- 2024 margin
- Strong D (+20.3) · D 59.7% · R 39.4%
- 2008→2024 swing
- +4.8pp toward D · 2008: 15.5pp · 2024: 20.3pp
- All cycles
- 2024: D+20.3 2020: D+20.4 2016: D+16.4 2012: D+14.4 2008: D+15.5
Not yet ingested
- Civics
- —
Market trends
- HPI YoY
- ▲ 0.18%
- Current HPI
- 214.7403
- Rent YoY
- —
- Metro
- —
- State GDP YoY
- ▲ 1.68%
- F500 in state
- 34
Industry mix (Fortune 500 HQ in PA)
| Industry | F500 HQs | Revenue |
|---|---|---|
| Healthcare | 2 | $309B |
|
||
| Insurance | 2 | $27B |
|
||
| Telecommunications / Media | 1 | $124B |
|
||
| Industrial Distribution | 1 | $22B |
|
||
| Financial Services | 1 | $20B |
|
||
| Chemicals / Materials | 1 | $18B |
|
||
Price history
+419.6% since first listed12 events — show timeline
- 2026-05-13 Listed $129,900 West Penn MLS
- 2025-06-13 Price Changed $125,000 West Penn MLS
- 2024-11-26 Listed $110,000 West Penn MLS
- 2021-01-30 Listed $68,000 West Penn MLS
- 2009-02-06 Sold (Public Records) $12,500 Public Records
- 2009-01-23 Price Changed $14,900 West Penn MLS
- 2009-01-23 Sold (MLS) $12,500 West Penn MLS
- 2008-12-10 Listed $12,500 West Penn MLS
- 1997-10-08 Sold (Public Records) $40,000 Public Records
- 1997-10-06 Sold (MLS) $40,000 West Penn MLS
- 1997-07-30 Listed $39,000 West Penn MLS
- 1986-04-24 Sold (Public Records) $25,000 Public Records
Property tax history
+4.4%/yrLatest (2026): $1,415 · +6.9% YoY. Source: county tax records.
Cash-flow waterfall
monthlySold comps — $/sqft
last 12 mo · ≤1 miLoading sold comps…