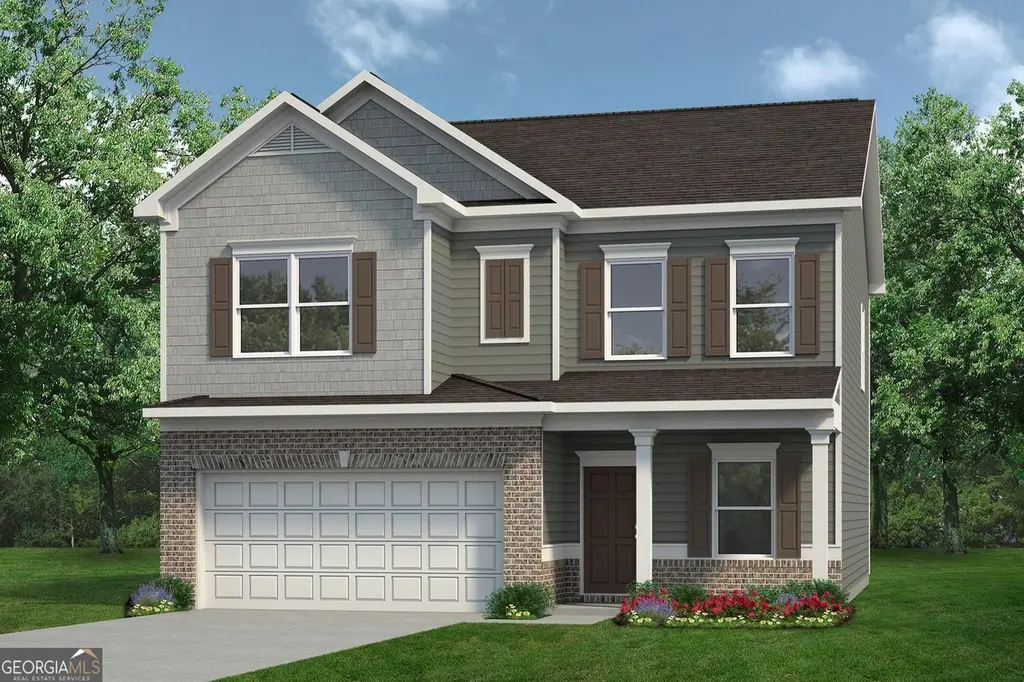
213 Antiquity Cir · Perry, GA
Flood risk 1/10 · Minimal
- FEMA flood zone
- X (unshaded)
- Chance of flooding over 30 yrs
- 0.0%
- Est. flood insurance / yr
- $507 – $1,088
Fire risk 4/10 · Minor
- Est. fire insurance / yr
- $963 – $1,789
Heat risk 7/10 · Major
- Hot days now (above 109°F)
- 7 days/yr
- Hot days in 30 yrs
- 18 days/yr
Wind risk 8/10 · Major
- Chance of severe wind over 30 yrs
- 80.0%
Air-quality risk 2/10 · Minimal
- Unhealthy air days now
- 2 days/yr
- Unhealthy air days in 30 yrs
- 2 days/yr
Risk factors via First Street. Map © Google.
Why this score? — see what drove the D grade
The composite is a weighted blend of 9 inputs, each scored 0–100. Each bar is that input's sub-score; the figure is the points it added to the 100-point composite (weight × sub-score).
- Cash flow +11.8/30.0
- ARV discount +11.0/15.0
- Condition / age +5.0/5.0
- Schools +3.9/10.0
- DSCR +3.5/10.0
- 1% rule +3.4/10.0
- Livability +3.4/5.0
- Rent growth +2.5/5.0
- Appreciation +0.0/10.0
$295,095
🖨 Deal sheet 📄 Offer letter ✓ Due diligence
Listing remarks
Move in Ready August 2026! The Coleman plan by Smith Douglas Homes in the new community Avalon. Step into this beautifully designed 4bedroom, 2.5bath home, where modern comfort and thoughtful planning come together across two spacious levels. From the moment you enter, the inviting foyer leads you to a dedicated dining room at the front of the home, an ideal space for hosting gatherings and enjoying meals. Expansive sight lines draw you toward the back of the home, where the openconcept layout seamlessly connects the family room, breakfast nook, and wellappointed kitchen. The large patio just off the breakfast area extends your living space outdoors, creating the perfect setting for morning
Key facts
- Large patio
- Move in ready
- Owner's suite
Tags
Property features AI
Finance
- Other:
- Financial info: List price $295,095
- HOA & community:
Exterior
- Parking: 2 parking spaces
- Security:
- Utilities: Natural gas; Electric; Central air
- Home design: Single-family property (The Coleman plan); Active listing
- Construction:
- Exterior features:
Interior
- Kitchen:
- Bedrooms: 4 bedrooms
- Flooring:
- Bathrooms: 2 full bathrooms and 1 half bathroom
- Heating & cooling: Natural gas and electric heating with heat pump; Central air conditioning
- Interior features: Spec home — The Coleman plan; Living area approximately 2,053
- Laundry & utility:
Neighborhood map
What this means for you Summary
Snapshot
- This is a 4-bed/2.5-bath single-family listed at $295k. Condition is rated excellent.
Deal economics
- At list price, monthly cash flow is $-81 ($-976/yr) — negative.
- To cash-flow at today's rent, offer at most $283k (4.0% below list).
- To meet the 1% rule (rent ≥ 1% of price), the offer needs to be $248k (16.0% below list).
- Recommended offer: $248k (16.0% below list) — sets the bar for 1% rule.
- Cap rate 6.0% vs local median 4.5% in Perry — top-decile yield for the area; either an underpriced asset or a hidden risk that comps aren't pricing in. Stress-test before assuming the spread holds.
Location & tenants
- Location reads 68/100 on livability (#149 in GA) — a middle-class / working-renter tenant base. Strengths: cost of living A+, housing A+, crime B+; Watch: amenities F, commute F, health & safety F.
- Houston County (urban): math 43% / reading 46% proficiency, ranked #23 of 174 in GA (top 13%) — families likely to look elsewhere, expect single-tenant / working-renter base with shorter leases.
- Market conditions: 466 active listings in the ZIP; 10 comparable units currently listed for rent nearby; rentals at typical pace (median 21d on market — plan ~3-4 weeks tenant-placement turnaround); 40% of comp listings sitting > 30 days — soft ceiling on asking rent; 1,545 units permitted in Houston County in 2024 (336 in 5+ unit buildings).
- This rent runs 40% of the median local income ($75k/yr) — at the standard rent-burdened threshold; future hikes will face affordability resistance.
Forward outlook
- Local home prices are declining (-3.0%/yr); year-one equity from $2k of loan paydown is wiped out by about $9k of value loss. Plan a longer hold.
- Houston County population projected at +22% by 2050 — long-run rental-demand tailwind backs the buy-and-hold thesis.
Negotiation context
- Only 7 days on market — expect competitive offers; lowballing is unlikely to land.
Risks & watch-outs
- Climate carrying-cost: severe wind risk, 80% chance of damaging wind over 30y; extreme-heat days projected 7→18/yr by 2055 (HVAC capex compounding) — expect insurance premiums to compound above CPI over the hold.
Questions for the listing agent
- What do current leases actually rent for vs. the listed asking? Can we see a recent rent roll and the last 12 months of T-12 income?
- Is there a deadline driving the sale (1031 exchange, divorce, estate, relocation)? That informs how much negotiation room exists.
- The area grade is low — what's the realistic commute time and amenity access for the typical tenant pool here? Any planned neighborhood developments (good or bad) we should know about?
- What's the average days-on-market for RENTAL listings here right now (not sales)? A rising rental-DOM trend means longer vacancies and softer asking-rent achievability than the comps imply.
- What's the recent tenant-quality profile in this submarket — average credit score on applications, eviction rate, late-payment / NSF rate, and stable-employment percentage? A property-management company in the area should have these aggregated.
- How much new for-sale + rental construction is in the pipeline within 1–3 miles? Heavy new supply typically softens prices + rents 12–24 months out; constrained supply supports both.
Investment metrics
- 1% rule
- 0.84% ✗
- Cap rate
- 5.96%
- Cash-on-cash
- -1.18%
- DSCR
- 0.95
- GRM
- 9.9
CMA / ARV
- ARV (on-the-fly)
- $320,268
- Comps found
- 12
Show comp detail 12 sales within ~0.75 mi
| Address | Dist | Beds/Ba | Sqft | Sold | Price | $/sf | Match |
|---|---|---|---|---|---|---|---|
| 115 Springfield Ct | 0.49mi | 4/2.5 | 1,897 (-8%) | 2mo | $240,000 | $127 | 63 |
| 214 Farmland Cir Lot 8 AG | 0.60mi | 3/2.0 (-1) | 2,003 (-2%) | 2mo | $370,200 | $185 | 59 |
| 1202 Fairway Dr | 0.67mi | 3/2.0 (-1) | 2,040 (-1%) | 9mo | $318,000 | $156 | 54 |
| 1202 Fairway Dr | 0.67mi | 3/2.0 (-1) | 2,040 (-1%) | 9mo | $318,000 | $156 | 54 |
| 905 Chapel Ridge Dr | 0.62mi | 4/2.5 | 2,013 (-2%) | 17mo | $292,500 | $145 | 54 |
| 205 Farmland Cir | 0.72mi | 5/3.0 (+1) | 2,125 (+4%) | 1mo | $379,900 | $179 | 52 |
| 102 Ridge Circle North Cir | 0.63mi | 4/2.0 | 1,848 (-10%) | 2mo | $240,000 | $130 | 50 |
| 1309 Georgia Ave | 0.57mi | 3/2.0 (-1) | 1,899 (-8%) | 7mo | $150,000 | $79 | 48 |
| 202 Farmland Cir Lot 2 | 0.60mi | 3/2.0 (-1) | 1,851 (-10%) | 3mo | $336,900 | $182 | 46 |
| 120 Bramblewood Way | 0.62mi | 4/2.0 | 1,756 (-14%) | 8mo | $295,339 | $168 | 38 |
| 405 Otter's Ridge Dr | 0.62mi | 4/2.0 | 1,766 (-14%) | 18mo | $302,900 | $172 | 31 |
| 105 N Ridge Cir | 0.67mi | 3/2.0 (-1) | 1,783 (-13%) | 21mo | $203,000 | $114 | 23 |
Match score weights: distance 35% · size 25% · config 20% · recency 20%. Top-matched comps best support the ARV.
Projected returns pro-forma
-3.0% appreciation · 3.0% rent growth · sell at horizon
- IRR
- -18.2%
- Equity multiple
- 0.36×
- Total profit
- $-52,959
- Equity at exit
- $44,000
- IRR
- -10.5%
- Equity multiple
- 0.36×
- Total profit
- $-52,632
- Equity at exit
- $25,514
Cash invested: $82,627 (down + closing). Projections, not guarantees.
Landlord ↔ Tenant lean methodology
- Overall (STATE)
- 90 Strongly Landlord-Friendly
- State Georgia
- 90 Strongly Landlord-Friendly · R+3
- County
- — inherits STATE
- City
- — inherits STATE
ZIP-level market 31069
- Active inventory
- 466
- Price-to-rent
- 9.9×
Monthly cashflow live
- Estimated rent
- $2,479 high interval (Pro) →
- Mortgage (P&I)
- −$1,548
- Tax est. 1.5%
- −$369 /mo · $4,426/yr
- Insurance
- −$123
- HOA
- −$0
- Vacancy / Maint / Mgmt
- −$520
- Net cashflow
- $-81
Break-even live
UW: 25.0% down · 7.5% · 30yr · 1.5% tax · 5.0% vac · 8.0% maint · 8.0% mgmt
Financing live
Cash to close
- Down payment
- $73,774
- Closing costs
- $8,853
- Reserves months
- —
- Total cash needed
- —
Loan-product check · same deal, 3 products live
Conventional
25% down · 7.5% · 30yr
- Down + closing
- —
- Monthly P&I
- —
- Monthly cashflow
- —
- DSCR
- —
- Eligible?
- —
Personal DTI + credit; lowest rate.
DSCR
20% down · 8.5% · 30yr
- Down + closing
- —
- Monthly P&I
- —
- Monthly cashflow
- —
- DSCR
- —
- Eligible?
- —
No personal income docs; deal must DSCR.
Hard money
10% down · 12.0% · 12mo
- Down + closing
- —
- Monthly P&I
- —
- Monthly cashflow
- —
- DSCR
- —
- Eligible?
- —
Short-term bridge; refi at stabilization.
Rent comps 10 comps
| Address | Beds | Baths | Sqft | Rent | $/sqft | DOM | Units | Dist |
|---|---|---|---|---|---|---|---|---|
| 1215 Macon Rd Perry, GA | 3.0 | 2.5 | 1768 | $1,700 | $0.96 | 13d | 1 | 0.40mi |
| 1304 Georgia Ave Perry, GA | 4.0 | 2.0 | 1485 | $3,500 | $2.36 | 21d | 1 | 0.58mi |
| 1304 Georgia Ave Perry, GA | 4.0 | 2.0 | 1485 | $3,500 | $2.36 | 43d | 1 | 0.58mi |
| 1218 Creekwood Dr Perry, GA | 4.0 | 2.0 | 1545 | $1,900 | $1.23 | 43d | 1 | 1.04mi |
| 1218 Creekwood Dr Perry, GA | 4.0 | 2.0 | 1545 | $1,900 | $1.23 | 21d | 1 | 1.04mi |
| 111 Judy Kay Way Perry, GA | 3.0 | 2.0 | 1759 | $2,000 | $1.14 | 21d | 1 | 1.08mi |
| 1726 Greenwood Cir Perry, GA | 3.0 | 2.0 | 1647 | $3,490 | $2.12 | 21d | 1 | 1.14mi |
| 1726 Greenwood Cir Perry, GA | 3.0 | 2.0 | 1647 | $3,490 | $2.12 | 43d | 1 | 1.14mi |
| 1739 Houston Lake Rd Perry, GA | 3.0 | 2.0 | 2163 | $1,895 | $0.88 | 43d | 1 | 1.22mi |
| 1115 Kingston Rd Perry, GA | 4.0 | 3.0 | 1740 | $2,000 | $1.15 | 21d | 1 | 1.29mi |
Listing history 7 events
-
2026-06-19days on market $295,095 Active 7 DOM
-
2026-06-18days on market $295,095 Active 6 DOM
-
2026-06-17days on market $295,095 Active 5 DOM
-
2026-06-16days on market $295,095 Active 4 DOM
-
2026-06-15days on market $295,095 Active 3 DOM
-
2026-06-13remarks 699-char remark
-
2026-06-13$295,095 Active 1 DOM
ⓘ Source: listings_history table (triggers on properties + properties_extension) + one-shot
backfill from property_details.listing_events for pre-trigger history.
Climate risk First Street
- Flood 1/10 Low FEMA zone X (unshaded) · 0% chance over 30 yrs
- Wildfire 4/10 Moderate
- Heat 7/10 Severe 7 d/yr ≥109°F today · 18 d/yr by 30 yrs out
- Wind 8/10 Severe 80% chance of damaging wind over 30 yrs
- Air quality 2/10 Low 2 unhealthy d/yr today · 2 by 30 yrs out
Nearby sold comps map
Loading sold comps map…
Walkable amenities ~0.75 mi
Loading nearby amenities…
Taxation est. · year 1
- Rental income
- $29,742
- − Mortgage interest
- −$16,530
- − Property taxes
- −$4,426
- − Insurance
- −$1,475
- − Repairs & maintenance
- −$2,379
- − Management
- −$2,379
- − Depreciation
- −$8,585
- Taxable loss
- −$6,033
- Est. tax savings @ 24.0%
- +$1,448
- After-tax cash flow
- $472/yr
For passive investors: Depreciation is non-cash, so a rental often shows a tax loss while cash-flowing — sheltering income. Rental losses are passive: they offset passive income freely, and up to $25,000/yr can offset ordinary (W-2) income if you actively participate and your MAGI is under $100k (phasing out to $0 by $150k); unused losses carry forward. On sale, claimed depreciation is recaptured at up to 25%, and gains may owe capital-gains tax (a 1031 exchange can defer both). Figures are a year-1 estimate at your 24.0% rate — not tax advice; consult a CPA.
Condition & rehab AI · 12 photos
This move-in-ready home is in excellent condition with modern finishes and a well-maintained exterior. Potential buyers and renters will appreciate the updates that can be made to further enhance its curb appeal and value.
Value-add opportunities
- Both Paint exterior — Enhances curb appeal and value
- Both Replace carpet with hardwood — Improves flow and value
- Both Install smart home devices — Enhances convenience and marketability
Renovation cost estimate screening
Value-add ROI direction
- Both Paint exterior — Enhances curb appeal and value ↑
- Both Replace carpet with hardwood — Improves flow and value ↑
- Both Install smart home devices — Enhances convenience and marketability ↑
ⓘ Cost ranges are severity-bucket heuristics (US national rule-of-thumb). Get contractor quotes + a written scope before underwriting a rehab budget.
Schools (NCES district)
- District
- Houston County
- NCES district ID
- 1302880
- Math proficiency
- 43% ▼ -7.00%
- Reading proficiency
- 46% ▼ -2.00%
- Median HH income
- $54,823
- Composite
- 38.68/100
- National rank
- #4144
- State rank
- #23 of 174 in GA
Livability — Perry
- Score
- 68/100
- State rank
- #149
- US rank
- #9757
Category grades
Schools grade is shown separately in the Schools card above.
Census & demographics
- Census place
- Perry, GA
- County
- Houston County · 157,321 people
- City population
- 22,953
- Metro
- Warner Robins, GA
- Population (ZIP)
- 22,953
- Household income
- $74,501
- Rent vs Own
- Severe rent burden
- 666.0
Population outlook (Houston County) Hauer SSP2
- Today (2025)
- 169,502 people
- By 2030
- 178,486 · +5.3%
- By 2040
- 194,642 · +14.8%
- By 2050
- 207,119 · +22.2%
- By 2075
- 231,480 · +36.6%
- By 2100
- 235,034 · +38.7%
Race, ethnicity, and origin ACS 2023
- Neighborhood character
- Majority White (64%)
- Race & ethnicity
- White 64% Black 24% Hispanic / Latino 4% Asian 3% Two or more races 3%
- Common ancestry
- Slovak 2% Romanian 1% Lithuanian 1%
- Foreign-born
- 4% · Canada, South Korea
- Languages at home
- 96% English-only · Spanish 2% Chinese 1%
Political lean MEDSL · Houston
- 2024 margin
- R (+11.3) · D 44.0% · R 55.3%
- 2008→2024 swing
- +8.9pp toward D · 2008: -20.2pp · 2024: -11.3pp
- All cycles
- 2024: R+11.3 2020: R+12.4 2016: R+21.6 2012: R+20.7 2008: R+20.2
Not yet ingested
- Civics
- —
Market trends
- HPI YoY
- ▼ -162.01%
- Current HPI
- 240.9327
- Rent YoY
- —
- Metro
- Warner Robins, GA
- State GDP YoY
- ▲ 2.66%
- F500 in state
- 28
Industry mix (Fortune 500 HQ in GA)
| Industry | F500 HQs | Revenue |
|---|---|---|
| Paper / Packaging | 2 | $29B |
|
||
| Retail | 1 | $160B |
|
||
| Transportation / Logistics | 1 | $91B |
|
||
| Airlines | 1 | $62B |
|
||
| Consumer Goods | 1 | $47B |
|
||
| Utilities | 1 | $25B |
|
||
Cash-flow waterfall
monthlySold comps — $/sqft
last 12 mo · ≤1 miLoading sold comps…