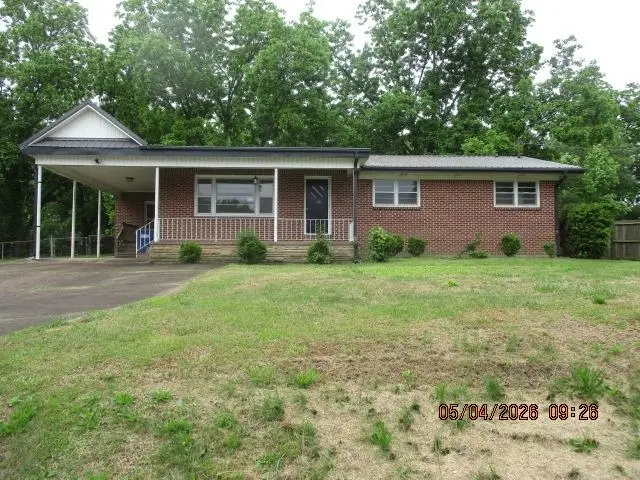
1111 1st Pl NW #1 · Arab, AL
Flood risk 1/10 · Minimal
- FEMA flood zone
- X (unshaded)
- Chance of flooding over 30 yrs
- 0.0%
- Est. flood insurance / yr
- $507 – $1,088
Fire risk 2/10 · Minimal
- Est. fire insurance / yr
- $916 – $1,700
Heat risk 4/10 · Minor
- Hot days now (above 104°F)
- 7 days/yr
- Hot days in 30 yrs
- 20 days/yr
Wind risk 4/10 · Minor
- Chance of severe wind over 30 yrs
- 22.0%
Air-quality risk 2/10 · Minimal
- Unhealthy air days now
- 1 days/yr
- Unhealthy air days in 30 yrs
- 3 days/yr
Risk factors via First Street. Map © Google.
Why this score? — see what drove the D grade
The composite is a weighted blend of 9 inputs, each scored 0–100. Each bar is that input's sub-score; the figure is the points it added to the 100-point composite (weight × sub-score).
- ARV discount +15.0/15.0
- Cash flow +8.7/30.0
- Schools +4.7/10.0
- Condition / age +3.8/5.0
- Livability +3.2/5.0
- 1% rule +2.7/10.0
- Rent growth +2.5/5.0
- DSCR +2.4/10.0
- Appreciation +0.0/10.0
$162,500
🖨 Deal sheet (PDF) 📄 Offer letter ✓ Due diligence
Listing remarks
All offers must be submitted at www. vrmproperties.com. Agents must register as a User, enter the property address, and click on "Start Offer". This property may qualify for Seller Financing (Vendee). If property was built prior to 1978, Lead Based Paint Potentially Exists. 4 bedroom 1.5 bath , on corner lot, fenced back yard, purchaser to verify sq footage , land amount, septic system, school district sold as is where is
Key facts
- 0.7 acre lot
- Parking
- Built 1973
Property features AI
Finance
- Other: Located in the Arab area (not in a subdivision); Listing broker: Alabama Realty Group
Exterior
- Parking: Carport with 1 space
- Utilities: Public sewer
- Home design: Single-family residential property
- Construction: Approximately 1,643 above-grade finished area
- Exterior features: Corner lot with dimensions approximately 170 x 190 x 170 x 190; Zoned R1
Interior
- Bedrooms: 4 bedrooms on the main level
- Bathrooms: 1 full bathroom; 1 half bathroom
- Interior features: 7 total rooms
Neighborhood map
What this means for you Summary
Snapshot
- This is a 4-bed/1.5-bath single-family listed at $162k. Condition is rated good.
Deal economics
- At list price, monthly cash flow is $-136 ($-2k/yr) — negative.
- To cash-flow at today's rent, offer at most $143k (12.1% below list).
- To meet the 1% rule (rent ≥ 1% of price), the offer needs to be $125k (23.1% below list).
- Recommended offer: $125k (23.1% below list) — sets the bar for 1% rule.
- Cap rate 5.3% vs local median 3.0% in Arab — top-decile yield for the area; either an underpriced asset or a hidden risk that comps aren't pricing in. Stress-test before assuming the spread holds.
Location & tenants
- Location reads 64/100 on livability (#149 in AL) — a middle-class / working-renter tenant base. Strengths: cost of living A+, housing A+; Watch: employment C-, crime D, amenities F.
- Arab City (rural): math 47% / reading 64% proficiency, ranked #9 of 129 in AL (top 7%) — acceptable for families but not a draw, mixed tenant base, ~2y average lease.
- Zoned schools: Arab Elementary School (math 59% / reading 73%, grade B+, #36 of 627 statewide, top 6%, 580 students, 52% FRL); Arab High School (math 37% / reading 47%, grade F, #28 of 305 statewide, top 10%, 779 students, 40% FRL) — zoned schools average 46% FRL vs 29% district-wide (17 pts higher); higher-poverty schools than district average — tighter screening recommended.
- Market conditions: 178 active listings in the ZIP; 1 comparable units currently listed for rent nearby; 163 units permitted in Marshall County in 2024 (0 in 5+ unit buildings).
Forward outlook
- Local home prices are declining (-3.0%/yr); year-one equity from $1k of loan paydown is wiped out by about $5k of value loss. Plan a longer hold.
Negotiation context
- It's been on market 46 days — a 3% lower offer ($158k) is reasonable based on typical stale-listing flexibility.
Questions for the listing agent
- What do current leases actually rent for vs. the listed asking? Can we see a recent rent roll and the last 12 months of T-12 income?
- It's been on market 46 days. Have you received any prior offers? Is the seller open to a 23% concession, seller financing, or rate buy-down credit?
- Built in 1973 — when were the roof, HVAC, electrical panel, plumbing, and water heater last replaced?
- Is there a deadline driving the sale (1031 exchange, divorce, estate, relocation)? That informs how much negotiation room exists.
- Crime grade is D in this area — have there been break-ins, vandalism, or insurance claims at this property in the last 3 years? What carrier currently insures it and at what premium?
- The area grade is low — what's the realistic commute time and amenity access for the typical tenant pool here? Any planned neighborhood developments (good or bad) we should know about?
- What's the average days-on-market for RENTAL listings here right now (not sales)? A rising rental-DOM trend means longer vacancies and softer asking-rent achievability than the comps imply.
- What's the recent tenant-quality profile in this submarket — average credit score on applications, eviction rate, late-payment / NSF rate, and stable-employment percentage? A property-management company in the area should have these aggregated.
- How much new for-sale + rental construction is in the pipeline within 1–3 miles? Heavy new supply typically softens prices + rents 12–24 months out; constrained supply supports both.
Investment metrics
- 1% rule
- 0.77% ✗
- Cap rate
- 5.29%
- Cash-on-cash
- -3.57%
- DSCR
- 0.84
- GRM
- 10.8
CMA / ARV
- ARV (median comp)
- $231,445
- List price
- $162,500
- Delta
- -29.79%
- Verdict
- UNDERPRICED
- Comps
- 20 within 1.0 mi
Show comp detail 9 sales within ~0.75 mi
| Address | Dist | Beds/Ba | Sqft | Sold | Price | $/sf | Match |
|---|---|---|---|---|---|---|---|
| 206 12th St NW | 0.26mi | 3/2.0 (-1) | 1,634 (-0%) | 10mo | $185,000 | $113 | 72 |
| 1011 Old Cullman Rd | 0.26mi | 4/2.0 | 1,727 (+5%) | 15mo | $329,000 | $191 | 65 |
| 139 Skidmore Dr NW | 0.21mi | 3/2.0 (-1) | 1,418 (-14%) | 3mo | $284,000 | $200 | 58 |
| 82 10th St NW | 0.20mi | 3/2.0 (-1) | 1,564 (-5%) | 23mo | $239,500 | $153 | 56 |
| 535 10th St NW | 0.57mi | 3/2.0 (-1) | 1,680 (+2%) | 12mo | $280,000 | $167 | 53 |
| 425 10th St NW | 0.46mi | 3/2.5 (-1) | 1,540 (-6%) | 16mo | $189,000 | $123 | 46 |
| 132 11th St NW | 0.19mi | 3/2.0 (-1) | 1,416 (-14%) | 21mo | $289,000 | $204 | 44 |
| 227 11th St NW | 0.28mi | 3/2.0 (-1) | 1,422 (-14%) | 17mo | $225,000 | $158 | 43 |
| 841 SW School Cir SW | 0.62mi | 4/2.0 | 1,750 (+6%) | 21mo | $230,900 | $132 | 41 |
Match score weights: distance 35% · size 25% · config 20% · recency 20%. Top-matched comps best support the ARV.
Projected returns pro-forma
-3.0% appreciation · 3.0% rent growth · sell at horizon
- IRR
- -22.3%
- Equity multiple
- 0.23×
- Total profit
- $-34,943
- Equity at exit
- $24,229
- IRR
- -16.3%
- Equity multiple
- 0.09×
- Total profit
- $-41,464
- Equity at exit
- $14,050
Cash invested: $45,500 (down + closing). Projections, not guarantees.
Landlord ↔ Tenant lean methodology
- Overall (STATE)
- 90 Strongly Landlord-Friendly
- State Alabama
- 90 Strongly Landlord-Friendly · R+15
- County
- — inherits STATE
- City
- — inherits STATE
ZIP-level market 35016
- Home prices YoY
- -28.0%
- Active inventory
- 178
- Price-to-rent
- 10.8×
Monthly cashflow live
- Estimated rent
- $1,250 medium interval (Pro) →
- Mortgage (P&I)
- −$852
- Tax est. 1.5%
- −$203 /mo · $2,438/yr
- Insurance
- −$68
- HOA
- −$0
- Vacancy / Maint / Mgmt
- −$262
- Net cashflow
- $-136
Break-even live
Sensitivity live
| Price | -10% $-23 | -5% $-79 | +0% $-136 | +5% $-192 | +10% $-248 |
|---|---|---|---|---|---|
| Rent | -10% $-234 | -5% $-185 | +0% $-136 | +5% $-86 | +10% $-37 |
| Rate | -1.0pp $-54 | -0.5pp $-94 | base $-136 | +0.5pp $-178 | +1.0pp $-220 |
UW: 25.0% down · 7.5% · 30yr · 1.5% tax · 5.0% vac · 8.0% maint · 8.0% mgmt
Financing live
Cash to close
- Down payment
- $40,625
- Closing costs
- $4,875
- Reserves months
- —
- Total cash needed
- —
Loan-product check · same deal, 3 products live
Conventional
25% down · 7.5% · 30yr
- Down + closing
- —
- Monthly P&I
- —
- Monthly cashflow
- —
- DSCR
- —
- Eligible?
- —
Personal DTI + credit; lowest rate.
DSCR
20% down · 8.5% · 30yr
- Down + closing
- —
- Monthly P&I
- —
- Monthly cashflow
- —
- DSCR
- —
- Eligible?
- —
No personal income docs; deal must DSCR.
Hard money
10% down · 12.0% · 12mo
- Down + closing
- —
- Monthly P&I
- —
- Monthly cashflow
- —
- DSCR
- —
- Eligible?
- —
Short-term bridge; refi at stabilization.
Rent comps 1 comps
| Address | Beds | Baths | Sqft | Rent | $/sqft | DOM | Units | Dist |
|---|---|---|---|---|---|---|---|---|
| 353 4th Ave NW Arab, AL | 3.0 | 1.0 | 1092 | $1,250 | $1.14 | 4d | 1 | 0.98mi |
Listing history 17 events
-
2026-06-21days on market $162,500 Active 46 DOM
-
2026-06-19days on market $162,500 Active 44 DOM
-
2026-06-18days on market $162,500 Active 43 DOM
-
2026-06-17days on market $162,500 Active 42 DOM
-
2026-06-16days on market $162,500 Active 41 DOM
-
2026-06-15days on market $162,500 Active 40 DOM
-
2026-06-14days on market $162,500 Active 38 DOM
-
2026-06-12days on market $162,500 Active 37 DOM
-
2026-06-09days on market $162,500 Active 34 DOM
-
2026-06-08days on market $162,500 Active 33 DOM
-
2026-06-07days on market $162,500 Active 32 DOM
-
2026-06-04days on market $162,500 Active 28 DOM
-
2026-06-02days on market $162,500 Active 27 DOM
-
2026-06-01days on market $162,500 Active 26 DOM
-
2026-05-31days on market $162,500 Active 25 DOM
-
2026-05-31days on market $162,500 Active 24 DOM
-
2026-05-05$162,500 Active 435-char remark
ⓘ Source: listings_history table (triggers on properties + properties_extension) + one-shot
backfill from property_details.listing_events for pre-trigger history.
Climate risk First Street
- Flood 1/10 Low FEMA zone X (unshaded) · 0% chance over 30 yrs
- Wildfire 2/10 Low
- Heat 4/10 Moderate 7 d/yr ≥104°F today · 20 d/yr by 30 yrs out
- Wind 4/10 Moderate 22% chance of damaging wind over 30 yrs
- Air quality 2/10 Low 1 unhealthy d/yr today · 3 by 30 yrs out
Nearby sold comps map
Loading sold comps map…
Walkable amenities ~0.75 mi
Loading nearby amenities…
Taxation est. · year 1
- Rental income
- $15,000
- − Mortgage interest
- −$9,103
- − Property taxes
- −$2,438
- − Insurance
- −$812
- − Repairs & maintenance
- −$1,200
- − Management
- −$1,200
- − Depreciation
- −$4,727
- Taxable loss
- −$4,480
- Est. tax savings @ 24.0%
- +$1,075
- After-tax cash flow
- $-551/yr
For passive investors: Depreciation is non-cash, so a rental often shows a tax loss while cash-flowing — sheltering income. Rental losses are passive: they offset passive income freely, and up to $25,000/yr can offset ordinary (W-2) income if you actively participate and your MAGI is under $100k (phasing out to $0 by $150k); unused losses carry forward. On sale, claimed depreciation is recaptured at up to 25%, and gains may owe capital-gains tax (a 1031 exchange can defer both). Figures are a year-1 estimate at your 24.0% rate — not tax advice; consult a CPA.
Condition & rehab AI · 13 photos
The home is in good condition with cosmetic updates needed to modernize the kitchen and bathrooms, increasing its resale value.
Repairs flagged
- Minor Backsplash — Dated and could be replaced for a fresh look
- Minor Appliances — Older models that could be upgraded for a more modern feel
- Minor Bathroom Fixtures — Older fixtures that could be replaced for a more modern look
Value-add opportunities
- Resale Replace back splash — Modernizes the kitchen and adds value
- Resale Upgrade appliances — Modernizes the kitchen and adds value
- Resale Replace bathroom fixtures — Modernizes the bathrooms and adds value
Renovation cost estimate screening
| Repair item | Severity | Est. cost |
|---|---|---|
| Backsplash · Dated and could be replaced for a fresh look | Minor | $500–3,000 |
| Appliances · Older models that could be upgraded for a more modern feel | Minor | $500–3,000 |
| Bathroom Fixtures · Older fixtures that could be replaced for a more modern look | Minor | $500–3,000 |
| Total estimated repair cost · 3 items | $1,500–9,000 |
Value-add ROI direction
- Resale Replace back splash — Modernizes the kitchen and adds value ↑
- Resale Upgrade appliances — Modernizes the kitchen and adds value ↑
- Resale Replace bathroom fixtures — Modernizes the bathrooms and adds value ↑
ⓘ Cost ranges are severity-bucket heuristics (US national rule-of-thumb). Get contractor quotes + a written scope before underwriting a rehab budget.
Schools (NCES district)
- District
- Arab City
- NCES district ID
- 0100100
- Math proficiency
- 47% ▼ -25.00%
- Reading proficiency
- 64% ▬ 0.00%
- Median HH income
- $42,728
- Composite
- 46.58/100
- National rank
- #2422
- State rank
- #9 of 129 in AL
Livability — Arab
- Score
- 64/100
- State rank
- #149
- US rank
- #13733
Category grades
Schools grade is shown separately in the Schools card above.
Census & demographics
- Census place
- Arab, AL
- City population
- 17,435
- Population (ZIP)
- 17,435
Population outlook (Marshall County) Hauer SSP2
- Today (2025)
- 97,402 people
- By 2030
- 98,138 · +0.8%
- By 2040
- 98,502 · +1.1%
- By 2050
- 97,024 · -0.4%
- By 2075
- 89,334 · -8.3%
- By 2100
- 74,749 · -23.3%
Race, ethnicity, and origin ACS 2023
- Neighborhood character
- Predominantly White (89%)
- Race & ethnicity
- White 89% Hispanic / Latino 5% Two or more races 5% Asian 1%
- Hispanic origin (detail)
- Mexican 4%
- Common ancestry
- Slovak 2% Italian 1% Serbian 1%
- Foreign-born
- 2% · Canada, China
- Languages at home
- 97% English-only · Spanish 2%
Political lean MEDSL · Marshall
- 2024 margin
- Solid R (+71.7) · D 13.8% · R 85.5%
- 2008→2024 swing
- -15.4pp toward R · 2008: -56.4pp · 2024: -71.7pp
- All cycles
- 2024: R+71.7 2020: R+68.7 2016: R+69.5 2012: R+60.1 2008: R+56.4
Not yet ingested
- Civics
- —
Market trends
- HPI YoY
- ▼ -70.17%
- Current HPI
- 180.2225
- Rent YoY
- —
- Metro
- —
- State GDP YoY
- ▲ 2.94%
- F500 in state
- 4
Industry mix (Fortune 500 HQ in AL)
| Industry | F500 HQs | Revenue |
|---|---|---|
| Financial Services | 1 | $8B |
|
||
| Healthcare | 1 | $5B |
|
||
Price history
1 event — show timeline
- 2026-05-05 Listed $162,500 SAARMLS
Cash-flow waterfall
monthlySold comps — $/sqft
last 12 mo · ≤1 miLoading sold comps…