 🌊 Lakefront
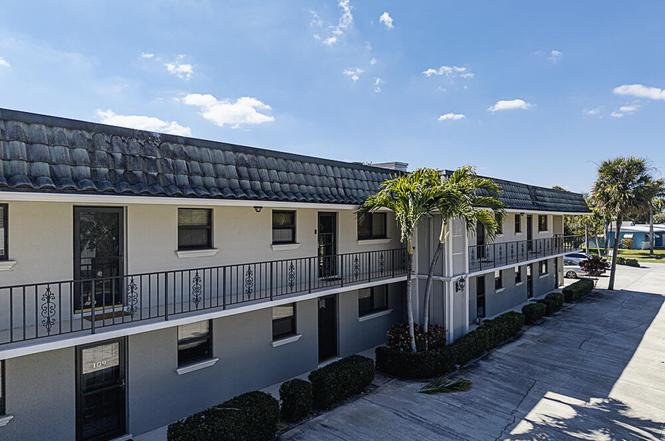
714 Northlake Ct #208 · North Palm Beach, FL
Flood risk 3/10 · Minor
- FEMA flood zone
- X (unshaded)
- Chance of flooding over 30 yrs
- 0.1%
- Est. flood insurance / yr
- $507 – $1,088
Fire risk 1/10 · Minimal
- Est. fire insurance / yr
- $947 – $1,759
Heat risk 10/10 · Severe
- Hot days now (above 106°F)
- 7 days/yr
- Hot days in 30 yrs
- 24 days/yr
Wind risk 10/10 · Severe
- Chance of severe wind over 30 yrs
- 99.0%
Air-quality risk 2/10 · Minimal
- Unhealthy air days now
- 0 days/yr
- Unhealthy air days in 30 yrs
- 1 days/yr
Risk factors via First Street. Map © Google.
Why this score? — see what drove the C- grade
The composite is a weighted blend of 9 inputs, each scored 0–100. Each bar is that input's sub-score; the figure is the points it added to the 100-point composite (weight × sub-score).
- Cash flow +17.3/30.0
- ARV discount +7.5/15.0
- 1% rule +7.3/10.0
- DSCR +5.4/10.0
- Schools +5.0/10.0
- Livability +3.9/5.0
- Rent growth +2.6/5.0
- Condition / age +2.5/5.0
- Appreciation +0.0/10.0
$289,900
🖨 Deal sheet (PDF) 📄 Offer letter ✓ Due diligence
Listing remarks MLS
Beautiful water views. A small complex with private pool and laundry room. Very quiet and private. Docks for rent at $2/ft.
Key facts
- Waterway view
- Close to shopping
- Heated pool
Tags
Property features AI
Finance
- HOA & community: Monthly HOA fee; Association amenities include cable TV, insurance, grounds maintenance, pest control, and common area upkeep; Sidewalks in the community; Pets allowed (restrictions possible)
Exterior
- Parking: Assigned parking
- Utilities: Public water; Public sewer; Three-phase electric; Cable available
- Home design: Condominium; Multi/split levels; Faces north; 2 total stories
- Construction: Concrete construction; Composition and rolled/hot mop and tar/gravel roofing; Resale condition; Building area reported by owner
- Exterior features: Screened porch; Covered porch; Ocean access; Basin waterfront
Interior
- Kitchen: Dishwasher; Electric range; Refrigerator
- Bedrooms: 2 bedrooms on the main level
- Flooring: Laminate flooring
- Bathrooms: 2 full bathrooms (main level)
- Heating & cooling: Central heating; Central air; Ceiling fans
- Interior features: Walk-in closets; Split bedroom layout; Blinds on windows
Neighborhood map
What this means for you Summary
Snapshot
- This is a 2-bed/2.0-bath condo listed at $290k.
Deal economics
- At list price, monthly cash flow is $214 ($3k/yr) — positive.
- The deal already cash-flows at list — no discount required.
- Meets the 1% rule at list price ($4k rent vs $290k).
- Recommended offer: $264k (9.0% below list) — sets the bar for market timing.
Location & tenants
- Location reads 77/100 on livability (#184 in FL, #2,894 nationally) — a middle-class / working-renter tenant base. Strengths: crime A+, employment A+, housing A+; Watch: amenities F, commute F, cost of living D-.
- Market conditions: Rents flat; 403 active listings in the ZIP; 11 comparable units currently listed for rent nearby; rentals at typical pace (median 25d on market — plan ~3-4 weeks tenant-placement turnaround); solid renter incomes; 3,974 units permitted in Palm Beach County in 2024 (1,012 in 5+ unit buildings).
- At $3,565/mo this rent would consume 46% of the median local household income ($92k/yr) (locally 835% of renters already pay >50% of income on rent) — very limited rent-growth headroom before tenants either downsize or default.
Forward outlook
- Local home prices are declining (-3.0%/yr); year-one equity from $2k of loan paydown is wiped out by about $9k of value loss. Plan a longer hold.
- Palm Beach County population projected at +30% by 2050 — long-run rental-demand tailwind backs the buy-and-hold thesis.
Negotiation context
- It's been on market 110 days — a 9% lower offer ($264k) is reasonable based on typical stale-listing flexibility.
- 6 sale attempts since 28y ago; this cycle's ask has dropped $45k (13%) from the opening price — seller is motivated, your offer sets the floor, not the list.
- Current owner paid $155k; list at $290k implies a 87% gain — meaningful room to come down on a strong offer.
Risks & watch-outs
- Watch-outs: HOA is 22% of rent.
- Climate carrying-cost: severe wind risk, 99% chance of damaging wind over 30y; extreme-heat days projected 7→24/yr by 2055 (HVAC capex compounding) — expect insurance premiums to compound above CPI over the hold.
Questions for the listing agent
- It's been on market 110 days. Have you received any prior offers? Is the seller open to a 9% concession, seller financing, or rate buy-down credit?
- Built in 1977 — when were the roof, HVAC, electrical panel, plumbing, and water heater last replaced?
- What does the HOA fee cover, when was the last increase, and are there any pending special assessments or reserve-fund shortfalls?
- Any open or pending special assessments — roof, HVAC, plumbing, elevator, façade? What's the per-unit balance and payoff schedule, and is the seller paying it off at close or rolling it to the buyer?
- Why hasn't it sold? Are there any deal-killer items the seller is aware of (foundation, flood, title, zoning, code violations)?
- Is there a deadline driving the sale (1031 exchange, divorce, estate, relocation)? That informs how much negotiation room exists.
- Schools are A-rated — typically a magnet for longer-tenancy family renters. What's the average tenant stay here, and is there a school-zone premium baked into asking?
- This sits on a lake — are riparian / water-frontage rights deeded with the parcel? Any dock permits, shoreline easements, or HOA water-use restrictions?
- What's the documented flood / surge / shoreline-erosion history here (FEMA AND non-FEMA — e.g., storm surge, creek backup, septic-field saturation)?
- Any water-quality or seasonal algae-bloom issues that affect tenant satisfaction or short-term-rental demand?
- What's the average days-on-market for RENTAL listings here right now (not sales)? A rising rental-DOM trend means longer vacancies and softer asking-rent achievability than the comps imply.
- What's the recent tenant-quality profile in this submarket — average credit score on applications, eviction rate, late-payment / NSF rate, and stable-employment percentage? A property-management company in the area should have these aggregated.
- How much new apartment / multifamily construction is in the pipeline within 1–3 miles? Heavy new supply (>2% of stock underway) typically softens rents 12–24 months out; light construction supports rent growth.
Investment metrics
- 1% rule
- 1.23% ✓
- Cap rate
- 7.18%
- Cash-on-cash
- 3.17%
- DSCR
- 1.14
- GRM
- 6.8
CMA / ARV
No comps found within radius.
Projected returns pro-forma
-3.0% appreciation · 0.27% rent growth · sell at horizon
- IRR
- -15.1%
- Equity multiple
- 0.48×
- Total profit
- $-42,436
- Equity at exit
- $43,225
- IRR
- -13.8%
- Equity multiple
- 0.33×
- Total profit
- $-54,698
- Equity at exit
- $25,065
Cash invested: $81,172 (down + closing). Projections, not guarantees.
Landlord ↔ Tenant lean methodology
- Overall (STATE)
- 87 Strongly Landlord-Friendly
- State Florida
- 87 Strongly Landlord-Friendly · R+3
- County
- — inherits STATE
- City
- — inherits STATE
ZIP-level market 33408
- Rents YoY
- 0.3%
- Active inventory
- 403
- Price-to-rent
- 6.8×
Monthly cashflow live
- Estimated rent
- $3,565 high interval (Pro) →
- Mortgage (P&I)
- −$1,520
- Tax from tax record
- −$185 /mo · $2,221/yr
- Insurance
- −$121
- HOA
- −$776
- Vacancy / Maint / Mgmt
- −$749
- Net cashflow
- $214
Break-even live
Sensitivity live
| Price | -10% $378 | -5% $296 | +0% $214 | +5% $132 | +10% $50 |
|---|---|---|---|---|---|
| Rent | -10% $-67 | -5% $74 | +0% $214 | +5% $355 | +10% $496 |
| Rate | -1.0pp $360 | -0.5pp $288 | base $214 | +0.5pp $139 | +1.0pp $63 |
UW: 25.0% down · 7.5% · 30yr · 1.5% tax · 5.0% vac · 8.0% maint · 8.0% mgmt
Financing live
Cash to close
- Down payment
- $72,475
- Closing costs
- $8,697
- Reserves months
- —
- Total cash needed
- —
Loan-product check · same deal, 3 products live
Conventional
25% down · 7.5% · 30yr
- Down + closing
- —
- Monthly P&I
- —
- Monthly cashflow
- —
- DSCR
- —
- Eligible?
- —
Personal DTI + credit; lowest rate.
DSCR
20% down · 8.5% · 30yr
- Down + closing
- —
- Monthly P&I
- —
- Monthly cashflow
- —
- DSCR
- —
- Eligible?
- —
No personal income docs; deal must DSCR.
Hard money
10% down · 12.0% · 12mo
- Down + closing
- —
- Monthly P&I
- —
- Monthly cashflow
- —
- DSCR
- —
- Eligible?
- —
Short-term bridge; refi at stabilization.
Rent comps 11 comps
| Address | Beds | Baths | Sqft | Rent | $/sqft | DOM | Units | Dist |
|---|---|---|---|---|---|---|---|---|
| 624 Southwind Cir #2 North Palm Beach, FL | 2.0 | 2.0 | 718 | $3,750 | $5.22 | 25d | 1 | 0.19mi |
| 308 Southwind Ct Unit 8 North Palm Beach, FL | 2.0 | 2.0 | 1100 | $2,900 | $2.64 | 25d | 1 | 0.27mi |
| 2545 Conroy Dr West Palm Beach, FL | 3.0 | 2.0 | 1066 | $3,295 | $3.09 | 25d | 1 | 0.29mi |
| 913 Lighthouse Dr North Palm Beach, FL | 3.0 | 2.5 | 1092 | $5,900 | $5.40 | 25d | 1 | 0.67mi |
| 526 Eastwind Dr Unit 526 North Palm Beach, FL | 2.0 | 1.0 | 840 | $3,995 | $4.76 | 25d | 1 | 0.74mi |
| 522 Eastwind Dr North Palm Beach, FL | 2.0 | 2.0 | 948 | $3,995 | $4.21 | 25d | 1 | 0.74mi |
| 524 Eastwind Dr Unit 524 North Palm Beach, FL | 2.0 | 1.0 | 774 | $3,995 | $5.16 | 25d | 1 | 0.74mi |
| 913 Lake Shore Dr Lake Park, FL | 1.0–2.0 | 1.0–2.0 | 1066 | $3,731 | $3.50 | 0d | 10 | 1.18mi |
| 901 W 37th St Riviera Beach, FL | 3.0 | 1.0 | 900 | $2,895 | $3.22 | 25d | 1 | 1.28mi |
| 8731 Uranus Ter West Palm Beach, FL | 2.0 | 1.0 | 900 | $3,200 | $3.56 | 25d | 1 | 1.40mi |
| 220 Lake Shore Dr Lake Park, FL | 1.0–3.0 | 1.5–3.5 | 1575 | $14,498 | $9.20 | 0d | 19 | 1.50mi |
HOA detail condo
- Monthly dues
- $776 · $9,312/yr
- Likely covers
- waterpool
- Assessments
- None detected in remarks — confirm with the listing agent.
Listing history 38 events
-
2026-06-21days on market $289,900 Active 110 DOM
-
2026-06-18days on market $289,900 Active 107 DOM
-
2026-06-17days on market $289,900 Active 106 DOM
-
2026-06-16days on market $289,900 Active 105 DOM
-
2026-06-15days on market $289,900 Active 104 DOM
-
2026-06-13days on market $289,900 Active 102 DOM
-
2026-06-09days on market $289,900 Active 98 DOM
-
2026-06-08days on market $289,900 Active 97 DOM
-
2026-06-07days on market $289,900 Active 96 DOM
-
2026-06-04days on market $289,900 Active 93 DOM
-
2026-06-03days on market $289,900 Active 92 DOM
-
2026-06-02days on market $289,900 Active 91 DOM
-
2026-06-01days on market $289,900 Active 90 DOM
-
2026-05-31days on market $289,900 Active 89 DOM
-
2026-05-04price $289,900
-
2026-04-19price $299,900
-
2026-04-06price $309,900
-
2026-03-12price $319,900
-
2026-03-03$334,500 Active
-
2017-04-26soldstatus $155,000
-
2017-04-25soldstatus $155,000 Closed 123-char remark
Show marketing remark (123 chars)
Beautiful water views. A small complex with private pool and laundry room. Very quiet and private. Docks for rent at $2/ft.
-
2017-04-01status Pending 123-char remark
Show marketing remark (123 chars)
Beautiful water views. A small complex with private pool and laundry room. Very quiet and private. Docks for rent at $2/ft.
-
2017-03-13historical Contingent 123-char remark
Show marketing remark (123 chars)
Beautiful water views. A small complex with private pool and laundry room. Very quiet and private. Docks for rent at $2/ft.
-
2017-02-28$169,900 Active 123-char remark
Show marketing remark (123 chars)
Beautiful water views. A small complex with private pool and laundry room. Very quiet and private. Docks for rent at $2/ft.
-
2017-01-20historical
-
2016-12-14$169,000 Active
-
2016-03-16historical
-
2015-10-05$179,000 Active
-
2003-06-06soldstatus $134,000
-
2001-10-05soldstatus $87,000
-
2001-07-28soldstatus $75,100
-
2001-06-08soldstatus $75,100
-
2001-06-01historical
-
2001-01-15$74,900
-
1998-11-30soldstatus $71,000
-
1998-10-19historical
-
1998-08-03$71,000
-
1987-10-01soldstatus $65,000
ⓘ Source: listings_history table (triggers on properties + properties_extension) + one-shot
backfill from property_details.listing_events for pre-trigger history.
Tax reassessment forecast FL · Resets to sale price
- Current annual tax
- $2,221 · $185/mo
- Projected year-2 tax
- $2,406 · $201/mo
- Expected delta
- +$186/yr (+$15/mo · 8.4%)
ⓘ Screening estimate from a state-policy table — verify with the county assessor before closing.
Climate risk First Street
- Flood 3/10 Moderate FEMA zone X (unshaded) · 10% chance over 30 yrs
- Wildfire 1/10 Low
- Heat 10/10 Extreme 7 d/yr ≥106°F today · 24 d/yr by 30 yrs out
- Wind 10/10 Extreme 99% chance of damaging wind over 30 yrs
- Air quality 2/10 Low 0 unhealthy d/yr today · 1 by 30 yrs out
Nearby sold comps map
Loading sold comps map…
Walkable amenities ~0.75 mi
Loading nearby amenities…
Taxation est. · year 1
- Rental income
- $42,782
- − Mortgage interest
- −$16,239
- − Property taxes
- −$2,221
- − Insurance
- −$1,450
- − Repairs & maintenance
- −$3,423
- − Management
- −$3,423
- − HOA
- −$9,312
- − Depreciation
- −$8,433
- Taxable loss
- −$1,718
- Est. tax savings @ 24.0%
- +$412
- After-tax cash flow
- $2,984/yr
For passive investors: Depreciation is non-cash, so a rental often shows a tax loss while cash-flowing — sheltering income. Rental losses are passive: they offset passive income freely, and up to $25,000/yr can offset ordinary (W-2) income if you actively participate and your MAGI is under $100k (phasing out to $0 by $150k); unused losses carry forward. On sale, claimed depreciation is recaptured at up to 25%, and gains may owe capital-gains tax (a 1031 exchange can defer both). Figures are a year-1 estimate at your 24.0% rate — not tax advice; consult a CPA.
Schools (NCES district)
No district data.
Livability — North Palm Beach
- Score
- 77/100
- State rank
- #184
- US rank
- #2894
Category grades
Schools grade is shown separately in the Schools card above.
Census & demographics
- Census place
- North Palm Beach, FL
- County
- Palm Beach County · 1,438,312 people
- City population
- 18,817
- Metro
- Miami-Fort Lauderdale-Pompano Beach, FL
- Population (ZIP)
- 18,817
- Household income
- $92,216
- Rent vs Own
- Severe rent burden
- 835.0
Population outlook (Palm Beach County) Hauer SSP2
- Today (2025)
- 1,637,487 people
- By 2030
- 1,743,255 · +6.5%
- By 2040
- 1,948,712 · +19.0%
- By 2050
- 2,132,979 · +30.3%
- By 2075
- 2,530,027 · +54.5%
- By 2100
- 2,706,979 · +65.3%
Race, ethnicity, and origin ACS 2023
- Neighborhood character
- Predominantly White (86%)
- Race & ethnicity
- White 86% Hispanic / Latino 9% Two or more races 7% Black 1% Asian 1%
- Hispanic origin (detail)
- Puerto Rican 2% Cuban 2%
- Common ancestry
- Lithuanian 4% Slovak 3% Romanian 3%
- Foreign-born
- 11% · Canada, Jamaica, Guatemala
- Languages at home
- 89% English-only · Spanish 7% Other Indo-European 1% French/Haitian/Cajun 1%
Political lean MEDSL · Palm Beach
- 2024 margin
- Toss-up / Even · D 50.0% · R 49.2%
- 2008→2024 swing
- -22.1pp toward R · 2008: 22.9pp · 2024: 0.8pp
- All cycles
- 2024: D+0.8 2020: D+12.8 2016: D+15.3 2012: D+17.0 2008: D+22.9
Not yet ingested
- Civics
- —
Market trends
- HPI YoY
- ▼ -223.14%
- Current HPI
- 365.2913
- Rent YoY
- ▲ 0.27%
- Metro
- Miami-Fort Lauderdale-Pompano Beach, FL
- State GDP YoY
- ▲ 3.28%
- F500 in state
- 36
Industry mix (Fortune 500 HQ in FL)
| Industry | F500 HQs | Revenue |
|---|---|---|
| Industrial Technology | 2 | $29B |
|
||
| Insurance | 2 | $17B |
|
||
| Retail | 1 | $60B |
|
||
| Technology Distribution | 1 | $58B |
|
||
| Homebuilding | 1 | $35B |
|
||
| Technology Manufacturing | 1 | $35B |
|
||
Price history
+346.0% since first listed24 events — show timeline
- 2026-05-04 Price Changed $289,900 Beaches MLS
- 2026-04-19 Price Changed $299,900 Beaches MLS
- 2026-04-06 Price Changed $309,900 Beaches MLS
- 2026-03-12 Price Changed $319,900 Beaches MLS
- 2026-03-03 Listed $334,500 Beaches MLS
- 2017-04-26 Sold (Public Records) $155,000 Public Records
- 2017-04-25 Sold (MLS) $155,000 Beaches MLS
- 2017-04-01 Pending — Beaches MLS
- 2017-03-13 Contingent — Beaches MLS
- 2017-02-28 Listed $169,900 Beaches MLS
- 2017-01-20 Listing Removed — MARMLS
- 2016-12-14 Listed $169,000 MARMLS
- 2016-03-16 Listing Removed — Beaches MLS
- 2015-10-05 Listed $179,000 Beaches MLS
- 2003-06-06 Sold (Public Records) $134,000 Public Records
- 2001-10-05 Sold (Public Records) $87,000 Public Records
- 2001-07-28 Sold (Public Records) $75,100 Public Records
- 2001-06-08 Sold (MLS) $75,100 Beaches MLS
- 2001-06-01 Listing Removed — Beaches MLS
- 2001-01-15 Listed $74,900 Beaches MLS
- 1998-11-30 Sold (MLS) $71,000 Beaches MLS
- 1998-10-19 Listing Removed — Beaches MLS
- 1998-08-03 Listed $71,000 Beaches MLS
- 1987-10-01 Sold (Public Records) $65,000 Public Records
Property tax history
+3.8%/yrLatest (2025): $2,221 · +3.7% YoY. Source: county tax records.
Cash-flow waterfall
monthlySold comps — $/sqft
last 12 mo · ≤1 miLoading sold comps…