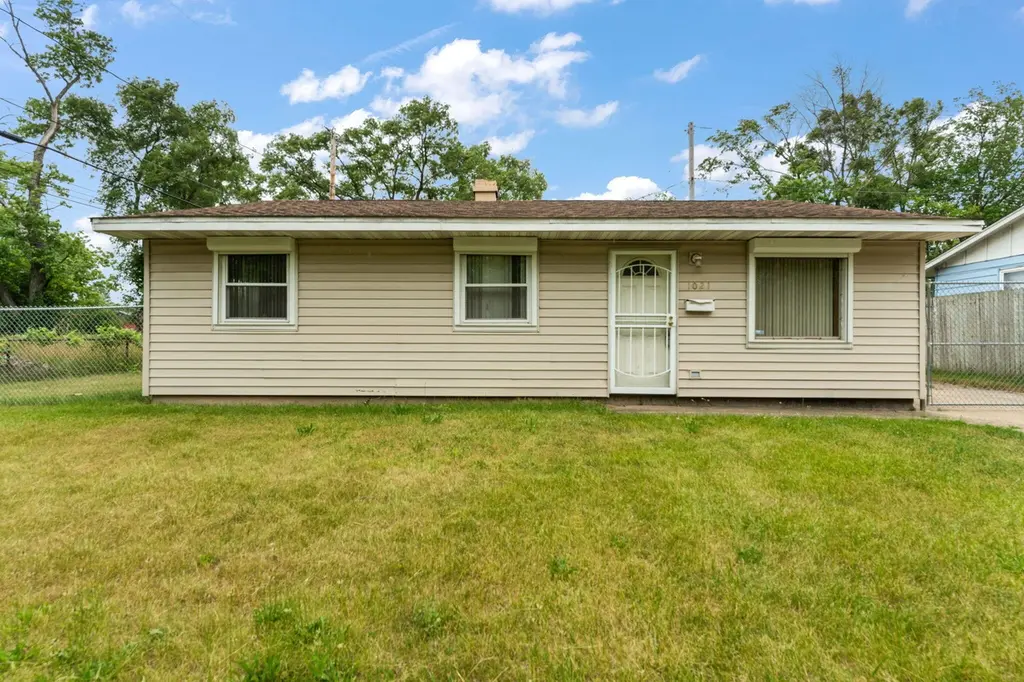
1021 Hamilton Pl · Gary, IN
Flood risk 1/10 · Minimal
- FEMA flood zone
- X (unshaded)
- Chance of flooding over 30 yrs
- 0.0%
- Est. flood insurance / yr
- $507 – $1,088
Fire risk 8/10 · Major
- Est. fire insurance / yr
- $717 – $1,331
Heat risk 2/10 · Minimal
- Hot days now (above 103°F)
- 7 days/yr
- Hot days in 30 yrs
- 15 days/yr
Wind risk 2/10 · Minimal
- Chance of severe wind over 30 yrs
- 0.0%
Air-quality risk 4/10 · Minor
- Unhealthy air days now
- 6 days/yr
- Unhealthy air days in 30 yrs
- 7 days/yr
Risk factors via First Street. Map © Google.
Why this score? — see what drove the F grade
The composite is a weighted blend of 9 inputs, each scored 0–100. Each bar is that input's sub-score; the figure is the points it added to the 100-point composite (weight × sub-score).
- Cash flow +16.2/30.0
- DSCR +5.0/10.0
- Livability +3.7/5.0
- 1% rule +3.1/10.0
- Rent growth +2.5/5.0
- Condition / age +2.5/5.0
- Schools +0.5/10.0
- ARV discount +0.0/15.0
- Appreciation +0.0/10.0
$165,000
🖨 Deal sheet 📄 Offer letter ✓ Due diligence
Listing remarks
Come check on this spacious 3 bedroom, 1 bathroom ranch offering just under 1,100 square feet in the growing Miller area. You pull up to a nice long drive way that could fit 3-4 cars. The house features a nice eat -in kitchen and a big dining room. All 3 bedrooms have nice space. This house is not too far of a drive from Miller Beach, the train station, or the other amenities the area has to offer. Don't miss out on your chance to check it out.
Key facts
- 5,489 sq ft lot
- Built 1960
- Listed 9 days
Property features AI
Finance
- Other: Vacant and available
Exterior
- Parking: Concrete driveway; On-street parking; Kitchen-level entry (parking access at kitchen level)
- Utilities: Public water; Public sewer
- Home design: Single-story home; Built in 1960
- Construction: Crawl space foundation
- Exterior features: Private yard; Neighborhood view; Partial backyard fencing; Storage
Interior
- Kitchen: Gas range; Refrigerator; Eat-in kitchen layout
- Bedrooms: Primary bedroom; Bedroom 2; Bedroom 3
- Flooring: Carpet; Tile; Hardwood
- Bathrooms: 1 full bathroom
- Heating & cooling: Central heating (forced air); Central air conditioning
- Interior features: Ceiling fans; Pantry; Eat-in kitchen; Private storage
- Laundry & utility: Crawl space (basement/utility access)
Neighborhood map
What this means for you Summary
Snapshot
- This is a 3-bed/1.0-bath single-family listed at $165k.
Deal economics
- At list price, monthly cash flow is $88 ($1k/yr) — positive.
- The deal already cash-flows at list — no discount required.
- To meet the 1% rule (rent ≥ 1% of price), the offer needs to be $134k (18.6% below list).
- Recommended offer: $134k (18.6% below list) — sets the bar for 1% rule.
- Cap rate 6.9% vs local median 9.1% in Gary — below-typical yield; the buyer is paying a premium for something (appreciation thesis, condition, location) that the cap rate doesn't capture.
Location & tenants
- Location reads 73/100 on livability (#105 in IN) — a middle-class / working-renter tenant base. Strengths: commute A+, cost of living A+, housing A+; Watch: schools F, crime F, employment F.
- Gary Community School Corporation (urban): math 3% / reading 11% proficiency, ranked #299 of 301 in IN (top 99%) — low school quality limits family demand, transient renter base, plan for 1-2y turnover; 80% free/reduced lunch — lower-income household profile, screen leases tightly.
- Market conditions: 88 active listings in the ZIP; 7 comparable units currently listed for rent nearby; rentals leasing fast (median 1d on market — plan ~1-2 weeks tenant-placement turnaround); 1,642 units permitted in Lake County in 2024 (14 in 5+ unit buildings).
- This rent runs 35% of the median local income ($46k/yr) — at the standard rent-burdened threshold; future hikes will face affordability resistance.
Forward outlook
- Local home prices are declining (-3.0%/yr); year-one equity from $1k of loan paydown is wiped out by about $5k of value loss. Plan a longer hold.
- Lake County population projected to shrink 7% by 2050 — rents likely to lag national; underwrite the cash flow, not the appreciation.
Negotiation context
- Only 10 days on market — expect competitive offers; lowballing is unlikely to land.
- 2 sale attempts since 16y ago with the ask held roughly flat each time — persistent listings suggest the price (not the market) is what's stuck; bring a comps-based counter.
Risks & watch-outs
- Climate carrying-cost: severe wildfire risk — expect insurance premiums to compound above CPI over the hold.
Questions for the listing agent
- Built in 1960 — when were the roof, HVAC, electrical panel, plumbing, and water heater last replaced?
- Is there a deadline driving the sale (1031 exchange, divorce, estate, relocation)? That informs how much negotiation room exists.
- Schools are F-rated, which usually means shorter tenancies and higher turnover. Who's the typical renter profile here, and what's been the actual vacancy rate?
- Crime grade is F in this area — have there been break-ins, vandalism, or insurance claims at this property in the last 3 years? What carrier currently insures it and at what premium?
- The area grade is low — what's the realistic commute time and amenity access for the typical tenant pool here? Any planned neighborhood developments (good or bad) we should know about?
- What's the average days-on-market for RENTAL listings here right now (not sales)? A rising rental-DOM trend means longer vacancies and softer asking-rent achievability than the comps imply.
- What's the recent tenant-quality profile in this submarket — average credit score on applications, eviction rate, late-payment / NSF rate, and stable-employment percentage? A property-management company in the area should have these aggregated.
- How much new for-sale + rental construction is in the pipeline within 1–3 miles? Heavy new supply typically softens prices + rents 12–24 months out; constrained supply supports both.
Investment metrics
- 1% rule
- 0.81% ✗
- Cap rate
- 6.93%
- Cash-on-cash
- 2.28%
- DSCR
- 1.10
- GRM
- 10.2
CMA / ARV
- ARV (on-the-fly)
- $131,520
- Comps found
- 12
Show comp detail 12 sales within ~0.75 mi
| Address | Dist | Beds/Ba | Sqft | Sold | Price | $/sf | Match |
|---|---|---|---|---|---|---|---|
| 1121 Dekalb St | 0.42mi | 3/1.0 | 1,060 (-3%) | 3mo | $127,500 | $120 | 72 |
| 1132 S Hamilton St | 0.11mi | 3/2.0 | 1,008 (-8%) | 14mo | $146,000 | $145 | 66 |
| 1119 Cass St | 0.66mi | 3/1.0 | 1,066 (-3%) | 4mo | $80,000 | $75 | 61 |
| 1132 Hamilton Pl | 0.09mi | 3/2.0 | 936 (-15%) | 10mo | $155,900 | $167 | 59 |
| 1310 Dearborn St | 0.62mi | 3/1.0 | 1,156 (+6%) | 5mo | $82,000 | $71 | 58 |
| 5617 E 13th Pl | 0.26mi | 2/1.0 (-1) | 936 (-15%) | 1mo | $69,000 | $74 | 58 |
| 5310 Miller Ave | 0.48mi | 3/2.0 | 1,130 (+3%) | 14mo | $125,000 | $111 | 57 |
| 387 S Hamilton St | 0.66mi | 3/1.0 | 1,080 (-2%) | 12mo | $75,000 | $69 | 57 |
| 5425 E 13th Pl | 0.35mi | 3/1.0 | 936 (-15%) | 8mo | $122,500 | $131 | 53 |
| 1118 Dearborn Cir | 0.57mi | 3/1.0 | 1,008 (-8%) | 9mo | $122,000 | $121 | 52 |
| 6532 Miller Ave | 0.65mi | 2/1.0 (-1) | 1,056 (-4%) | 16mo | $95,000 | $90 | 46 |
| 1151 Benton St | 0.72mi | 3/2.0 | 936 (-15%) | 3mo | $150,000 | $160 | 36 |
Match score weights: distance 35% · size 25% · config 20% · recency 20%. Top-matched comps best support the ARV.
Projected returns pro-forma
-3.0% appreciation · 3.0% rent growth · sell at horizon
- IRR
- -12.7%
- Equity multiple
- 0.54×
- Total profit
- $-21,229
- Equity at exit
- $24,602
- IRR
- -3.8%
- Equity multiple
- 0.75×
- Total profit
- $-11,622
- Equity at exit
- $14,266
Cash invested: $46,200 (down + closing). Projections, not guarantees.
Landlord ↔ Tenant lean methodology
- Overall (STATE)
- 90 Strongly Landlord-Friendly
- State Indiana
- 90 Strongly Landlord-Friendly · R+11
- County
- — inherits STATE
- City
- — inherits STATE
ZIP-level market 46403
- Home prices YoY
- -27.3%
- Active inventory
- 88
- Price-to-rent
- 10.2×
Monthly cashflow live
- Estimated rent
- $1,343 high interval (Pro) →
- Mortgage (P&I)
- −$865
- Tax from tax record
- −$39 /mo · $468/yr
- Insurance
- −$69
- HOA
- −$0
- Vacancy / Maint / Mgmt
- −$282
- Net cashflow
- $88
Break-even live
UW: 25.0% down · 7.5% · 30yr · 1.5% tax · 5.0% vac · 8.0% maint · 8.0% mgmt
Financing live
Cash to close
- Down payment
- $41,250
- Closing costs
- $4,950
- Reserves months
- —
- Total cash needed
- —
Loan-product check · same deal, 3 products live
Conventional
25% down · 7.5% · 30yr
- Down + closing
- —
- Monthly P&I
- —
- Monthly cashflow
- —
- DSCR
- —
- Eligible?
- —
Personal DTI + credit; lowest rate.
DSCR
20% down · 8.5% · 30yr
- Down + closing
- —
- Monthly P&I
- —
- Monthly cashflow
- —
- DSCR
- —
- Eligible?
- —
No personal income docs; deal must DSCR.
Hard money
10% down · 12.0% · 12mo
- Down + closing
- —
- Monthly P&I
- —
- Monthly cashflow
- —
- DSCR
- —
- Eligible?
- —
Short-term bridge; refi at stabilization.
Rent comps 7 comps
| Address | Beds | Baths | Sqft | Rent | $/sqft | DOM | Units | Dist |
|---|---|---|---|---|---|---|---|---|
| 1041 DeKalb St Gary, IN | 3.0 | 1.0 | 1006 | $1,250 | $1.24 | 43d | 1 | 0.41mi |
| 430 S Grand Blvd Gary, IN | 2.0 | 1.0 | 830 | $865 | $1.04 | 1d | 1 | 0.68mi |
| 1118 Benton St Gary, IN | 3.0 | 1.0 | 936 | $1,245 | $1.33 | 1d | 1 | 0.75mi |
| 283 N Hamilton St Gary, IN | 2.0 | 1.0 | 1100 | $1,100 | $1.00 | 3d | 1 | 1.22mi |
| 440 N Lake St Gary, IN | 3.0 | 1.0–2.0 | 677 | $1,400 | $2.07 | 1d | 5 | 1.39mi |
| 1252-54 Idaho St Gary, IN | 3.0 | 1.0 | 900 | $2,200 | $2.44 | 1d | 1 | 1.43mi |
| 904 Idaho St Gary, IN | 2.0 | 1.0 | 1176 | $1,200 | $1.02 | 43d | 1 | 1.43mi |
Listing history 8 events
-
2026-06-18days on market $165,000 Active 10 DOM
-
2026-06-17days on market $165,000 Active 9 DOM
-
2026-06-16days on market $165,000 Active 8 DOM
-
2026-06-15days on market $165,000 Active 7 DOM
-
2026-06-13days on market $165,000 Active 5 DOM
-
2026-06-13days on market $165,000 Active 4 DOM
-
2026-06-09remarks 448-char remark
-
2026-06-09$165,000 Active 1 DOM
ⓘ Source: listings_history table (triggers on properties + properties_extension) + one-shot
backfill from property_details.listing_events for pre-trigger history.
Tax reassessment forecast IN · Partial reset (capped growth)
- Current annual tax
- $468 · $39/mo
- Projected year-2 tax
- $935 · $78/mo
- Expected delta
- +$467/yr (+$39/mo · 99.9%)
ⓘ Screening estimate from a state-policy table — verify with the county assessor before closing.
Climate risk First Street
- Flood 1/10 Low FEMA zone X (unshaded) · 0% chance over 30 yrs
- Wildfire 8/10 Severe
- Heat 2/10 Low 7 d/yr ≥103°F today · 15 d/yr by 30 yrs out
- Wind 2/10 Low 0% chance of damaging wind over 30 yrs
- Air quality 4/10 Moderate 6 unhealthy d/yr today · 7 by 30 yrs out
Nearby sold comps map
Loading sold comps map…
Walkable amenities ~0.75 mi
Loading nearby amenities…
Taxation est. · year 1
- Rental income
- $16,113
- − Mortgage interest
- −$9,243
- − Property taxes
- −$468
- − Insurance
- −$825
- − Repairs & maintenance
- −$1,289
- − Management
- −$1,289
- − Depreciation
- −$4,800
- Taxable loss
- −$1,800
- Est. tax savings @ 24.0%
- +$432
- After-tax cash flow
- $1,485/yr
For passive investors: Depreciation is non-cash, so a rental often shows a tax loss while cash-flowing — sheltering income. Rental losses are passive: they offset passive income freely, and up to $25,000/yr can offset ordinary (W-2) income if you actively participate and your MAGI is under $100k (phasing out to $0 by $150k); unused losses carry forward. On sale, claimed depreciation is recaptured at up to 25%, and gains may owe capital-gains tax (a 1031 exchange can defer both). Figures are a year-1 estimate at your 24.0% rate — not tax advice; consult a CPA.
Schools (NCES district)
- District
- Gary Community School Corporation
- NCES district ID
- 1803870
- Math proficiency
- 3% ▼ -10.00%
- Reading proficiency
- 11% ▼ -6.00%
- Median HH income
- $27,739
- Composite
- 4.98/100
- National rank
- #10039
- State rank
- #299 of 301 in IN
Livability — Gary
- Score
- 73/100
- State rank
- #105
- US rank
- #5592
Category grades
Schools grade is shown separately in the Schools card above.
Census & demographics
- Census place
- Gary, IN
- County
- Lake County · 422,878 people
- City population
- 63,701
- Metro
- Chicago-Naperville-Elgin, IL-IN-WI
- Population (ZIP)
- 10,929
- Household income
- $45,991
- Rent vs Own
- Severe rent burden
- 656.0
Population outlook (Lake County) Hauer SSP2
- Today (2025)
- 484,026 people
- By 2030
- 478,091 · -1.2%
- By 2040
- 462,974 · -4.3%
- By 2050
- 449,894 · -7.1%
- By 2075
- 436,169 · -9.9%
- By 2100
- 426,607 · -11.9%
Race, ethnicity, and origin ACS 2023
- Neighborhood character
- Predominantly Black (71%)
- Race & ethnicity
- Black 71% White 18% Hispanic / Latino 9% Two or more races 4%
- Hispanic origin (detail)
- Mexican 5% Puerto Rican 4%
- Common ancestry
- Romanian 2% Hispanic 1% Iranian 1%
- Foreign-born
- 3% · Canada
- Languages at home
- 96% English-only · Spanish 2%
Political lean MEDSL · Lake
- 2024 margin
- Lean D (+5.6) · D 52.1% · R 46.5% · Other 1.5%
- 2008→2024 swing
- -28.6pp toward R · 2008: 34.3pp · 2024: 5.6pp
- All cycles
- 2024: D+5.6 2020: D+15.1 2016: D+20.6 2012: D+31.0 2008: D+34.3
Not yet ingested
- Civics
- —
Market trends
- HPI YoY
- ▼ -110.41%
- Current HPI
- 294.0935
- Rent YoY
- —
- Metro
- Chicago-Naperville-Elgin, IL-IN-WI
- State GDP YoY
- ▲ 2.90%
- F500 in state
- 18
Industry mix (Fortune 500 HQ in IN)
| Industry | F500 HQs | Revenue |
|---|---|---|
| Industrial Machinery | 2 | $37B |
|
||
| Healthcare | 1 | $177B |
|
||
| Pharmaceuticals | 1 | $45B |
|
||
| Metals / Steel | 1 | $18B |
|
||
| Agriculture | 1 | $17B |
|
||
| Packaging | 1 | $12B |
|
||
Price history
+195.2% since first listed3 events — show timeline
- 2026-06-08 Listed $165,000 NIRA MLS as Distributed by MLS Grid
- 2011-07-07 Listing Removed — NIRA MLS as Distributed by MLS Grid
- 2010-11-01 Listed $55,900 NIRA MLS as Distributed by MLS Grid
Property tax history
+1.3%/yrLatest (2024): $468 · +8.3% YoY. Source: county tax records.
Cash-flow waterfall
monthlySold comps — $/sqft
last 12 mo · ≤1 miLoading sold comps…