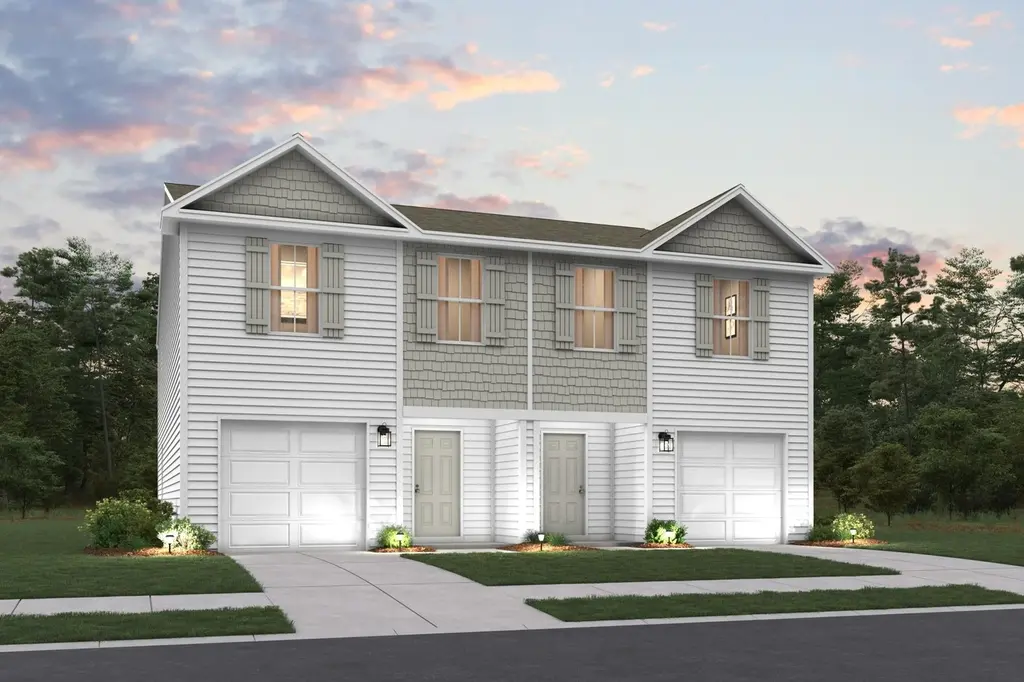
2349 Brookville Dr Unit A · Greenville, NC
Flood risk No data
- FEMA flood zone
- —
- Chance of flooding over 30 yrs
- —
- Est. flood insurance / yr
- —
Fire risk No data
- Est. fire insurance / yr
- —
Heat risk No data
- Hot days now (above threshold)
- —
- Hot days in 30 yrs
- —
Wind risk No data
- Chance of severe wind over 30 yrs
- —
Air-quality risk No data
- Unhealthy air days now
- —
- Unhealthy air days in 30 yrs
- —
Risk factors via First Street. Map © Google.
Why this score? — see what drove the D+ grade
The composite is a weighted blend of 9 inputs, each scored 0–100. Each bar is that input's sub-score; the figure is the points it added to the 100-point composite (weight × sub-score).
- ARV discount +15.0/15.0
- Cash flow +10.7/30.0
- Condition / age +4.8/5.0
- Rent growth +3.9/5.0
- Livability +3.9/5.0
- Schools +3.6/10.0
- 1% rule +3.1/10.0
- DSCR +3.1/10.0
- Appreciation +0.0/10.0
$221,990
🖨 Deal sheet 📄 Offer letter ✓ Due diligence
Listing remarks
3 bed | 2.5 bath | 1-bay | 1648 sqft
Key facts
- Garage
- Built 2026
- Listed 6 days
Property features AI
Finance
- Financial info: List price $221,990
Exterior
- Parking: 1 covered garage space (1 parking space total)
- Home design: Condominium/townhome unit at 2349 Brookville Dr Unit A, Greenville, NC; Plan name: HOLLY SPRINGS
- Construction: Spec/new construction (listed 2026)
- Exterior features: Living area approximately 1,648 square feet
Interior
- Bedrooms: 3 bedrooms
- Bathrooms: 2 full bathrooms and 1 half bathroom (2.5 total)
- Interior features: Open living area (model: HOLLY SPRINGS); Spec home (new construction)
Neighborhood map
What this means for you Summary
Snapshot
- This is a 3-bed/2.5-bath single-family listed at $222k. Condition is rated excellent.
Deal economics
- At list price, monthly cash flow is $-107 ($-1k/yr) — negative.
- To cash-flow at today's rent, offer at most $207k (7.0% below list).
- To meet the 1% rule (rent ≥ 1% of price), the offer needs to be $181k (18.6% below list).
- Recommended offer: $181k (18.6% below list) — sets the bar for 1% rule.
- Cap rate 5.7% vs local median 3.8% in Greenville — top-decile yield for the area; either an underpriced asset or a hidden risk that comps aren't pricing in. Stress-test before assuming the spread holds.
Location & tenants
- Location reads 77/100 on livability (#30 in NC, #2,977 nationally) — a middle-class / working-renter tenant base. Strengths: commute A+, cost of living A+, health & safety A+; Watch: schools C-, crime F, employment F.
- Pitt County Schools (rural): math 41% / reading 44% proficiency, ranked #100 of 178 in NC (top 56%) — families likely to look elsewhere, expect single-tenant / working-renter base with shorter leases.
- Market conditions: Rents rising fast (+5.4%/yr); 350 active listings in the ZIP; 18 comparable units currently listed for rent nearby; rentals at typical pace (median 21d on market — plan ~3-4 weeks tenant-placement turnaround); 1,300 units permitted in Pitt County in 2024 (204 in 5+ unit buildings).
- This rent runs 44% of the median local income ($49k/yr) — at the standard rent-burdened threshold; future hikes will face affordability resistance.
Forward outlook
- Local home prices are declining (-3.0%/yr); year-one equity from $2k of loan paydown is wiped out by about $7k of value loss. Plan a longer hold.
- Pitt County population projected at +22% by 2050 — long-run rental-demand tailwind backs the buy-and-hold thesis.
Negotiation context
- Only 7 days on market — expect competitive offers; lowballing is unlikely to land.
Questions for the listing agent
- What do current leases actually rent for vs. the listed asking? Can we see a recent rent roll and the last 12 months of T-12 income?
- Is there a deadline driving the sale (1031 exchange, divorce, estate, relocation)? That informs how much negotiation room exists.
- Crime grade is F in this area — have there been break-ins, vandalism, or insurance claims at this property in the last 3 years? What carrier currently insures it and at what premium?
- The area grade is low — what's the realistic commute time and amenity access for the typical tenant pool here? Any planned neighborhood developments (good or bad) we should know about?
- What's the average days-on-market for RENTAL listings here right now (not sales)? A rising rental-DOM trend means longer vacancies and softer asking-rent achievability than the comps imply.
- What's the recent tenant-quality profile in this submarket — average credit score on applications, eviction rate, late-payment / NSF rate, and stable-employment percentage? A property-management company in the area should have these aggregated.
- How much new for-sale + rental construction is in the pipeline within 1–3 miles? Heavy new supply typically softens prices + rents 12–24 months out; constrained supply supports both.
Investment metrics
- 1% rule
- 0.81% ✗
- Cap rate
- 5.72%
- Cash-on-cash
- -2.06%
- DSCR
- 0.91
- GRM
- 10.2
CMA / ARV
- ARV (on-the-fly)
- $271,920
- Comps found
- 12
Show comp detail 12 sales within ~0.75 mi
| Address | Dist | Beds/Ba | Sqft | Sold | Price | $/sf | Match |
|---|---|---|---|---|---|---|---|
| 2421 A Brookville Dr | 0.02mi | 3/2.5 | 1,648 (0%) | 6mo | $204,990 | $124 | 94 |
| 2204 S Kali Ln Unit B | 0.11mi | 3/2.5 | 1,543 (-6%) | 7mo | $263,900 | $171 | 78 |
| 3525 Willette Dr | 0.67mi | 3/2.0 | 1,676 (+2%) | 3mo | $276,000 | $165 | 62 |
| 2217 Sweet Bay Dr Unit B | 0.51mi | 3/2.5 | 1,576 (-4%) | 11mo | $235,500 | $149 | 60 |
| 2028 Cambria Dr Unit A | 0.36mi | 3/2.5 | 1,750 (+6%) | 15mo | $243,000 | $139 | 60 |
| 939 Teakwood Dr | 0.41mi | 3/2.0 | 1,424 (-14%) | 3mo | $289,000 | $203 | 54 |
| 3501 Holman Way Unit A | 0.74mi | 3/2.5 | 1,700 (+3%) | 9mo | $266,500 | $157 | 53 |
| 2501 Brookville Dr Unit B | 0.33mi | 3/2.0 | 1,440 (-13%) | 12mo | $255,000 | $177 | 51 |
| 2203 Great Laurel Ct | 0.41mi | 4/2.5 (+1) | 1,885 (+14%) | 2mo | $304,000 | $161 | 50 |
| 2360 Great Laurel Ct | 0.74mi | 3/2.5 | 1,820 (+10%) | 9mo | $347,400 | $191 | 41 |
| 2362 Great Laurel Ct | 0.75mi | 3/2.5 | 1,790 (+9%) | 13mo | $344,900 | $193 | 40 |
| 214 Allendale Dr | 0.71mi | 3/2.5 | 1,879 (+14%) | 9mo | $185,000 | $98 | 36 |
Match score weights: distance 35% · size 25% · config 20% · recency 20%. Top-matched comps best support the ARV.
Projected returns pro-forma
-3.0% appreciation · 5.44% rent growth · sell at horizon
- IRR
- -17.0%
- Equity multiple
- 0.39×
- Total profit
- $-38,192
- Equity at exit
- $33,099
- IRR
- -5.0%
- Equity multiple
- 0.64×
- Total profit
- $-22,288
- Equity at exit
- $19,194
Cash invested: $62,157 (down + closing). Projections, not guarantees.
Landlord ↔ Tenant lean methodology
- Overall (STATE)
- 85 Strongly Landlord-Friendly
- State North Carolina
- 85 Strongly Landlord-Friendly · R+3
- County
- — inherits STATE
- City
- — inherits STATE
ZIP-level market 27834
- Rents YoY
- 5.4%
- Active inventory
- 350
- Price-to-rent
- 10.2×
Monthly cashflow live
- Estimated rent
- $1,807 high interval (Pro) →
- Mortgage (P&I)
- −$1,164
- Tax est. 1.5%
- −$277 /mo · $3,330/yr
- Insurance
- −$92
- HOA
- −$0
- Vacancy / Maint / Mgmt
- −$379
- Net cashflow
- $-107
Break-even live
UW: 25.0% down · 7.5% · 30yr · 1.5% tax · 5.0% vac · 8.0% maint · 8.0% mgmt
Financing live
Cash to close
- Down payment
- $55,498
- Closing costs
- $6,660
- Reserves months
- —
- Total cash needed
- —
Loan-product check · same deal, 3 products live
Conventional
25% down · 7.5% · 30yr
- Down + closing
- —
- Monthly P&I
- —
- Monthly cashflow
- —
- DSCR
- —
- Eligible?
- —
Personal DTI + credit; lowest rate.
DSCR
20% down · 8.5% · 30yr
- Down + closing
- —
- Monthly P&I
- —
- Monthly cashflow
- —
- DSCR
- —
- Eligible?
- —
No personal income docs; deal must DSCR.
Hard money
10% down · 12.0% · 12mo
- Down + closing
- —
- Monthly P&I
- —
- Monthly cashflow
- —
- DSCR
- —
- Eligible?
- —
Short-term bridge; refi at stabilization.
Rent comps 18 comps
| Address | Beds | Baths | Sqft | Rent | $/sqft | DOM | Units | Dist |
|---|---|---|---|---|---|---|---|---|
| 2221 Brookville Dr Unit B Greenville, NC | 3.0 | 2.0 | 1508 | $1,700 | $1.13 | 20d | 1 | 0.13mi |
| 1632 Cambria Dr Unit B Greenville, NC | 3.0 | 3.0 | 1919 | $2,000 | $1.04 | 20d | 1 | 0.15mi |
| 1951 Cambria Dr Unit B Greenville, NC | 3.0 | 3.0 | 1552 | $1,800 | $1.16 | 20d | 1 | 0.30mi |
| 2500 Brookville Dr Greenville, NC | 3.0 | 2.0 | 1423 | $1,800 | $1.26 | 13d | 1 | 0.34mi |
| 1548 Manning Forest Dr Unit M7 Greenville, NC | 2.0 | 1.5 | 1094 | $1,300 | $1.19 | 13d | 1 | 0.40mi |
| 1005 Allen Ridge Dr Greenville, NC | 2.0–3.0 | 2.0 | 1134 | $1,999 | $1.76 | 13d | 13 | 0.45mi |
| 4129 Laurel Ridge Dr Greenville, NC | 2.0 | 4.0 | 1050 | $2,500 | $2.38 | 20d | 1 | 0.48mi |
| 4129 Laurel Ridge Dr Unit F Greenville, NC | 2.0 | 3.5 | 1050 | $2,500 | $2.38 | 20d | 1 | 0.48mi |
| 4511 Laurel Ridge Dr Unit B Greenville, NC | 3.0 | 2.5 | 1619 | $1,950 | $1.20 | 20d | 1 | 0.50mi |
| 974 Ellery Dr Greenville, NC | 3.0 | 2.0 | 1901 | $1,995 | $1.05 | 20d | 1 | 0.67mi |
| 2308 Sweet Bay Dr Unit B Greenville, NC | 3.0 | 2.0 | 1446 | $1,925 | $1.33 | 20d | 1 | 0.86mi |
| 3709 Nantucket Rd Unit A Greenville, NC | 3.0 | 2.0 | 1427 | $1,700 | $1.19 | 13d | 1 | 1.17mi |
| 828 Sarah Rebecca Dr Greenville, NC | 3.0 | 2.5 | 1636 | $2,000 | $1.22 | 20d | 1 | 1.41mi |
| 1015 Spring Forest Rd Unit F5 Greenville, NC | 3.0 | 2.5 | 1453 | $1,200 | $0.83 | 20d | 1 | 1.44mi |
| 1150 Cross Creek Cir Greenville, NC | 2.0 | 2.0 | 1100 | $1,200 | $1.09 | 20d | 1 | 1.47mi |
| 1301 Westpointe Dr Greenville, NC | 2.0–3.0 | 1.0–2.0 | 1074 | $1,250 | $1.16 | 20d | 1 | 1.47mi |
| 1151 Cross Creek Cir Greenville, NC | 3.0 | 2.5 | 1338 | $1,600 | $1.20 | 20d | 1 | 1.48mi |
| 1035 Spring Forest Rd Greenville, NC | 3.0 | 2.0–2.5 | 1453 | $1,450 | $1.00 | 20d | 2 | 1.48mi |
Listing history 7 events
-
2026-06-19days on market $221,990 Active 7 DOM
-
2026-06-18days on market $221,990 Active 6 DOM
-
2026-06-17days on market $221,990 Active 5 DOM
-
2026-06-16days on market $221,990 Active 4 DOM
-
2026-06-15days on market $221,990 Active 3 DOM
-
2026-06-13remarks 36-char remark
-
2026-06-13$221,990 Active 1 DOM
ⓘ Source: listings_history table (triggers on properties + properties_extension) + one-shot
backfill from property_details.listing_events for pre-trigger history.
Nearby sold comps map
Loading sold comps map…
Walkable amenities ~0.75 mi
Loading nearby amenities…
Taxation est. · year 1
- Rental income
- $21,683
- − Mortgage interest
- −$12,435
- − Property taxes
- −$3,330
- − Insurance
- −$1,110
- − Repairs & maintenance
- −$1,735
- − Management
- −$1,735
- − Depreciation
- −$6,458
- Taxable loss
- −$5,119
- Est. tax savings @ 24.0%
- +$1,228
- After-tax cash flow
- $-51/yr
For passive investors: Depreciation is non-cash, so a rental often shows a tax loss while cash-flowing — sheltering income. Rental losses are passive: they offset passive income freely, and up to $25,000/yr can offset ordinary (W-2) income if you actively participate and your MAGI is under $100k (phasing out to $0 by $150k); unused losses carry forward. On sale, claimed depreciation is recaptured at up to 25%, and gains may owe capital-gains tax (a 1031 exchange can defer both). Figures are a year-1 estimate at your 24.0% rate — not tax advice; consult a CPA.
Condition & rehab AI · 5 photos
This home is in excellent condition with no visible repairs needed. It offers a modern kitchen, well-maintained bathrooms, and a good curb appeal. Upgrades in painting, landscaping, and smart home features can further enhance its value.
Value-add opportunities
- Both Painting the exterior and interior walls — Fresh paint can enhance curb appeal and interior aesthetics.
- Both Landscaping improvements — Enhanced landscaping can improve curb appeal and attract potential buyers/tenants.
- Resale Upgrading the kitchen appliances — Modern appliances can increase the home's appeal to potential buyers.
- Both Adding smart home features — Smart home features can increase convenience and appeal to both buyers and tenants.
- Both Upgrading the HVAC system — A more efficient HVAC system can improve comfort and reduce energy costs, attracting more buyers/tenants.
- Both Adding a smart thermostat — A smart thermostat can improve energy efficiency and comfort, attracting more buyers/tenants.
Renovation cost estimate screening
Value-add ROI direction
- Both Painting the exterior and interior walls — Fresh paint can enhance curb appeal and interior aesthetics. ↑
- Both Landscaping improvements — Enhanced landscaping can improve curb appeal and attract potential buyers/tenants. ↑
- Resale Upgrading the kitchen appliances — Modern appliances can increase the home's appeal to potential buyers. ↑
- Both Adding smart home features — Smart home features can increase convenience and appeal to both buyers and tenants. ↑
- Both Upgrading the HVAC system — A more efficient HVAC system can improve comfort and reduce energy costs, attracting more buyers/tenants. ↑
- Both Adding a smart thermostat — A smart thermostat can improve energy efficiency and comfort, attracting more buyers/tenants. ↑
ⓘ Cost ranges are severity-bucket heuristics (US national rule-of-thumb). Get contractor quotes + a written scope before underwriting a rehab budget.
Schools (NCES district)
- District
- Pitt County Schools
- NCES district ID
- 3700012
- Math proficiency
- 41% ▬ 0.00%
- Reading proficiency
- 44% ▲ 2.00%
- Median HH income
- $40,631
- Composite
- 35.67/100
- National rank
- #4877
- State rank
- #100 of 178 in NC
Livability — Greenville
- Score
- 77/100
- State rank
- #30
- US rank
- #2977
Category grades
Schools grade is shown separately in the Schools card above.
Census & demographics
- County
- Pitt County · 142,592 people
- City population
- 115,121
- Metro
- Greenville, NC
- Population (ZIP)
- 56,347
- Household income
- $48,935
- Rent vs Own
- Severe rent burden
- 3319.0
Population outlook (Pitt County) Hauer SSP2
- Today (2025)
- 194,585 people
- By 2030
- 203,756 · +4.7%
- By 2040
- 220,807 · +13.5%
- By 2050
- 236,614 · +21.6%
- By 2075
- 275,940 · +41.8%
- By 2100
- 300,058 · +54.2%
Race, ethnicity, and origin ACS 2023
- Neighborhood character
- Diverse neighborhood (Simpson 0.59)
- Race & ethnicity
- Black 54% White 33% Hispanic / Latino 8% Two or more races 3% Asian 2%
- Hispanic origin (detail)
- Mexican 7%
- Common ancestry
- Lithuanian 1% Slovak 1% Romanian 1%
- Foreign-born
- 7% · Canada, China
- Languages at home
- 91% English-only · Spanish 6% Other Asian/Pacific 1%
Political lean MEDSL · Pitt
- 2024 margin
- Lean D (+6.0) · D 52.5% · R 46.5% · Other 1.1%
- 2008→2024 swing
- -2.8pp toward R · 2008: 8.8pp · 2024: 6.0pp
- All cycles
- 2024: D+6.0 2020: D+9.4 2016: D+7.4 2012: D+6.7 2008: D+8.8
Not yet ingested
- Civics
- —
Market trends
- HPI YoY
- ▼ -187.99%
- Current HPI
- 190.6869
- Rent YoY
- ▲ 5.44%
- Metro
- Greenville, NC
- State GDP YoY
- ▲ 3.28%
- F500 in state
- 26
Industry mix (Fortune 500 HQ in NC)
| Industry | F500 HQs | Revenue |
|---|---|---|
| Financial Services | 2 | $213B |
|
||
| Retail | 2 | $95B |
|
||
| Industrial Conglomerate | 1 | $38B |
|
||
| Metals / Steel | 1 | $35B |
|
||
| Utilities | 1 | $30B |
|
||
| Industrial Machinery | 1 | $19B |
|
||
Cash-flow waterfall
monthlySold comps — $/sqft
last 12 mo · ≤1 miLoading sold comps…