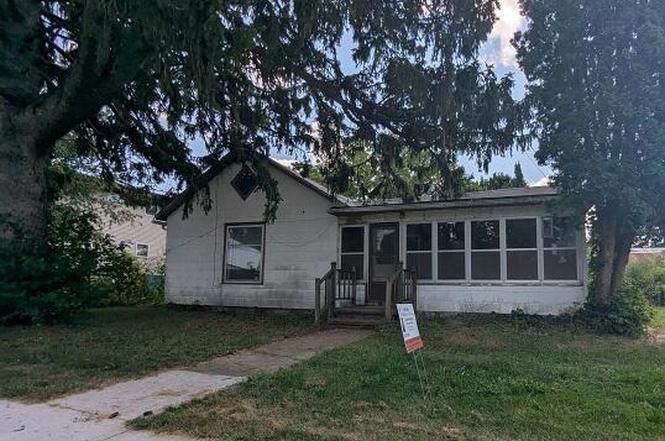
181 W Second St · Vermontville, MI
Flood risk 1/10 · Minimal
- FEMA flood zone
- X (unshaded)
- Chance of flooding over 30 yrs
- 0.0%
- Est. flood insurance / yr
- $507 – $1,088
Fire risk 1/10 · Minimal
- Est. fire insurance / yr
- $784 – $1,456
Heat risk 2/10 · Minimal
- Hot days now (above 97°F)
- 7 days/yr
- Hot days in 30 yrs
- 16 days/yr
Wind risk 2/10 · Minimal
- Chance of severe wind over 30 yrs
- —
Air-quality risk 2/10 · Minimal
- Unhealthy air days now
- 1 days/yr
- Unhealthy air days in 30 yrs
- 2 days/yr
Risk factors via First Street. Map © Google.
Why this score? — see what drove the B- grade
The composite is a weighted blend of 9 inputs, each scored 0–100. Each bar is that input's sub-score; the figure is the points it added to the 100-point composite (weight × sub-score).
- Cash flow +30.0/30.0
- DSCR +10.0/10.0
- 1% rule +9.9/10.0
- ARV discount +7.5/15.0
- Livability +3.2/5.0
- Schools +2.7/10.0
- Rent growth +2.5/5.0
- Condition / age +2.5/5.0
- Appreciation +0.0/10.0
$64,900
🖨 Deal sheet 📄 Offer letter ✓ Due diligence
Listing remarks MLS
Older ranch home welcomes you to an enclosed front porch and huge dining area, large livingroom and large kitchen. Home features 3 bedrooms. Michigan basement, large backyard! Home is close to Vermontville Village. Per seller, EMD is to be held with seller's title company.
Key facts
- Huge dining area
- Large backyard
- Large kitchen
Tags
Neighborhood map
What this means for you Summary
Snapshot
- This is a 2-bed/1.0-bath single-family listed at $65k.
Deal economics
- At list price, monthly cash flow is $374 ($4k/yr) — positive.
- The deal already cash-flows at list — no discount required.
- Meets the 1% rule at list price ($970 rent vs $65k).
- Recommended offer: $63k (3.0% below list) — sets the bar for market timing.
Location & tenants
- Location reads 63/100 on livability (#513 in MI) — a middle-class / working-renter tenant base. Strengths: cost of living A+, housing A+; Watch: employment D, schools D-, crime F.
- Maple Valley Schools (rural): math 27% / reading 36% proficiency, ranked #332 of 540 in MI (top 62%) — families likely to look elsewhere, expect single-tenant / working-renter base with shorter leases.
- Market conditions: 13 active listings in the ZIP; 98 units permitted in Eaton County in 2024 (0 in 5+ unit buildings).
Forward outlook
- Local home prices are declining (-3.0%/yr); year-one equity from $449 of loan paydown is wiped out by about $2k of value loss. Plan a longer hold.
- Eaton County population projected to shrink 5% by 2050 — rents likely to lag national; underwrite the cash flow, not the appreciation.
- At projected returns (-3.0% appreciation + 3.0% rent growth), your $18k cash investment doubles in ~5 years — after that, you're playing with house money.
Negotiation context
- It's been on market 38 days — a 3% lower offer ($63k) is reasonable based on typical stale-listing flexibility.
- 4 sale attempts; this cycle's ask is 4227% above the opening price — seller raised mid-cycle; expect resistance to lowballs.
Questions for the listing agent
- It's been on market 38 days. Have you received any prior offers? Is the seller open to a 3% concession, seller financing, or rate buy-down credit?
- Is there a deadline driving the sale (1031 exchange, divorce, estate, relocation)? That informs how much negotiation room exists.
- Schools are D-rated, which usually means shorter tenancies and higher turnover. Who's the typical renter profile here, and what's been the actual vacancy rate?
- Crime grade is F in this area — have there been break-ins, vandalism, or insurance claims at this property in the last 3 years? What carrier currently insures it and at what premium?
- What's the average days-on-market for RENTAL listings here right now (not sales)? A rising rental-DOM trend means longer vacancies and softer asking-rent achievability than the comps imply.
- What's the recent tenant-quality profile in this submarket — average credit score on applications, eviction rate, late-payment / NSF rate, and stable-employment percentage? A property-management company in the area should have these aggregated.
- How much new for-sale + rental construction is in the pipeline within 1–3 miles? Heavy new supply typically softens prices + rents 12–24 months out; constrained supply supports both.
Investment metrics
- 1% rule
- 1.49% ✓
- Cap rate
- 13.21%
- Cash-on-cash
- 24.70%
- DSCR
- 2.10
- GRM
- 5.6
CMA / ARV
- ARV (on-the-fly)
- $162,540
- Comps found
- 5
Show comp detail 5 sales within ~0.75 mi
| Address | Dist | Beds/Ba | Sqft | Sold | Price | $/sf | Match |
|---|---|---|---|---|---|---|---|
| 172 Sherman St | 0.30mi | 3/2.0 (+1) | 1,248 (-1%) | 0mo | $175,000 | $140 | 75 |
| 344 E Main St | 0.46mi | 2/1.0 | 1,168 (-7%) | 5mo | $136,250 | $117 | 62 |
| 380 Elm St | 0.11mi | 3/1.0 (+1) | 1,400 (+11%) | 22mo | $180,000 | $129 | 53 |
| 174 E First St | 0.19mi | 3/1.5 (+1) | 1,392 (+10%) | 20mo | $188,000 | $135 | 50 |
| 875 Linden St | 0.60mi | 3/2.0 (+1) | 1,200 (-5%) | 8mo | $145,000 | $121 | 48 |
Match score weights: distance 35% · size 25% · config 20% · recency 20%. Top-matched comps best support the ARV.
Projected returns pro-forma
-3.0% appreciation · 3.0% rent growth · sell at horizon
- IRR
- 18.1%
- Equity multiple
- 1.73×
- Total profit
- $13,289
- Equity at exit
- $9,677
- IRR
- 26.5%
- Equity multiple
- 3.32×
- Total profit
- $42,170
- Equity at exit
- $5,611
Cash invested: $18,172 (down + closing). Projections, not guarantees.
Landlord ↔ Tenant lean methodology
- Overall (STATE)
- 62 Landlord-Friendly
- State Michigan
- 62 Landlord-Friendly · EVEN
- County
- — inherits STATE
- City
- — inherits STATE
ZIP-level market 49096
- Home prices YoY
- -18.5%
- Active inventory
- 13
- Price-to-rent
- 5.6×
Monthly cashflow live
- Estimated rent
- $970 medium interval (Pro) →
- Mortgage (P&I)
- −$340
- Tax from tax record
- −$24 /mo · $293/yr
- Insurance
- −$27
- HOA
- −$0
- Vacancy / Maint / Mgmt
- −$204
- Net cashflow
- $374
Break-even live
UW: 25.0% down · 7.5% · 30yr · 1.5% tax · 5.0% vac · 8.0% maint · 8.0% mgmt
Financing live
Cash to close
- Down payment
- $16,225
- Closing costs
- $1,947
- Reserves months
- —
- Total cash needed
- —
Loan-product check · same deal, 3 products live
Conventional
25% down · 7.5% · 30yr
- Down + closing
- —
- Monthly P&I
- —
- Monthly cashflow
- —
- DSCR
- —
- Eligible?
- —
Personal DTI + credit; lowest rate.
DSCR
20% down · 8.5% · 30yr
- Down + closing
- —
- Monthly P&I
- —
- Monthly cashflow
- —
- DSCR
- —
- Eligible?
- —
No personal income docs; deal must DSCR.
Hard money
10% down · 12.0% · 12mo
- Down + closing
- —
- Monthly P&I
- —
- Monthly cashflow
- —
- DSCR
- —
- Eligible?
- —
Short-term bridge; refi at stabilization.
Listing history 9 events
-
2026-02-20historical $1,500
-
2026-02-06$1,500
-
2025-11-10soldstatus $58,500
-
2025-09-26status Pending 273-char remark
Show marketing remark (274 chars)
Older ranch home welcomes you to an enclosed front porch and huge dining area, large livingroom and large kitchen. Home features 3 bedrooms. Michigan basement, large backyard! Home is close to Vermontville Village. Per seller, EMD is to be held with seller's title company.
-
2025-09-26status Pending 274-char remark
Show marketing remark (274 chars)
Older ranch home welcomes you to an enclosed front porch and huge dining area, large livingroom and large kitchen. Home features 3 bedrooms. Michigan basement, large backyard! Home is close to Vermontville Village. Per seller, EMD is to be held with seller's title company.
-
2025-09-26status Pending
Show marketing remark (274 chars)
Older ranch home welcomes you to an enclosed front porch and huge dining area, large livingroom and large kitchen. Home features 3 bedrooms. Michigan basement, large backyard! Home is close to Vermontville Village. Per seller, EMD is to be held with seller's title company.
-
2025-08-19$64,900 Active 273-char remark
Show marketing remark (274 chars)
Older ranch home welcomes you to an enclosed front porch and huge dining area, large livingroom and large kitchen. Home features 3 bedrooms. Michigan basement, large backyard! Home is close to Vermontville Village. Per seller, EMD is to be held with seller's title company.
-
2025-08-19$64,900 Active 274-char remark
Show marketing remark (274 chars)
Older ranch home welcomes you to an enclosed front porch and huge dining area, large livingroom and large kitchen. Home features 3 bedrooms. Michigan basement, large backyard! Home is close to Vermontville Village. Per seller, EMD is to be held with seller's title company.
-
2025-08-19$64,900 Active
Show marketing remark (274 chars)
Older ranch home welcomes you to an enclosed front porch and huge dining area, large livingroom and large kitchen. Home features 3 bedrooms. Michigan basement, large backyard! Home is close to Vermontville Village. Per seller, EMD is to be held with seller's title company.
ⓘ Source: listings_history table (triggers on properties + properties_extension) + one-shot
backfill from property_details.listing_events for pre-trigger history.
Tax reassessment forecast MI · Partial reset (capped growth)
- Current annual tax
- $293 · $24/mo
- Projected year-2 tax
- $646 · $54/mo
- Expected delta
- +$353/yr (+$29/mo · 120.3%)
ⓘ Screening estimate from a state-policy table — verify with the county assessor before closing.
Climate risk First Street
- Flood 1/10 Low FEMA zone X (unshaded) · 0% chance over 30 yrs
- Wildfire 1/10 Low
- Heat 2/10 Low 7 d/yr ≥97°F today · 16 d/yr by 30 yrs out
- Wind 2/10 Low
- Air quality 2/10 Low 1 unhealthy d/yr today · 2 by 30 yrs out
Nearby sold comps map
Loading sold comps map…
Walkable amenities ~0.75 mi
Loading nearby amenities…
Taxation est. · year 1
- Rental income
- $11,634
- − Mortgage interest
- −$3,635
- − Property taxes
- −$293
- − Insurance
- −$324
- − Repairs & maintenance
- −$931
- − Management
- −$931
- − Depreciation
- −$1,888
- Taxable income
- $3,632
- Est. tax owed @ 24.0%
- −$872
- After-tax cash flow
- $3,618/yr
For passive investors: Depreciation is non-cash, so a rental often shows a tax loss while cash-flowing — sheltering income. Rental losses are passive: they offset passive income freely, and up to $25,000/yr can offset ordinary (W-2) income if you actively participate and your MAGI is under $100k (phasing out to $0 by $150k); unused losses carry forward. On sale, claimed depreciation is recaptured at up to 25%, and gains may owe capital-gains tax (a 1031 exchange can defer both). Figures are a year-1 estimate at your 24.0% rate — not tax advice; consult a CPA.
Schools (NCES district)
- District
- Maple Valley Schools
- NCES district ID
- 2622620
- Math proficiency
- 27% ▼ -8.00%
- Reading proficiency
- 36% ▼ -9.00%
- Median HH income
- $49,074
- Composite
- 27.33/100
- National rank
- #6987
- State rank
- #332 of 540 in MI
Livability — Vermontville
- Score
- 63/100
- State rank
- #513
- US rank
- #15340
Category grades
Schools grade is shown separately in the Schools card above.
Census & demographics
- Census place
- Vermontville, MI
- Population (ZIP)
- 3,196
Population outlook (Eaton County) Hauer SSP2
- Today (2025)
- 110,811 people
- By 2030
- 110,598 · -0.2%
- By 2040
- 108,304 · -2.3%
- By 2050
- 104,961 · -5.3%
- By 2075
- 97,197 · -12.3%
- By 2100
- 85,150 · -23.2%
Race, ethnicity, and origin ACS 2023
- Neighborhood character
- Predominantly White (91%)
- Race & ethnicity
- White 91% Hispanic / Latino 4% Two or more races 4%
- Common ancestry
- Polish 5% Iranian 3% Slovak 2%
- Foreign-born
- 1% · Canada
- Languages at home
- 90% English-only · German/W. Germanic 8% Spanish 1%
Political lean MEDSL · Eaton
- 2024 margin
- Toss-up / Even · D 47.6% · R 50.8% · Other 1.6%
- 2008→2024 swing
- -11.6pp toward R · 2008: 8.4pp · 2024: -3.1pp
- All cycles
- 2024: R+3.1 2020: R+0.8 2016: R+5.5 2012: D+3.1 2008: D+8.4
Not yet ingested
- Civics
- —
Market trends
- HPI YoY
- ▼ -49.70%
- Current HPI
- 219.3993
- Rent YoY
- —
- Metro
- —
- State GDP YoY
- ▲ 1.37%
- F500 in state
- 28
Industry mix (Fortune 500 HQ in MI)
| Industry | F500 HQs | Revenue |
|---|---|---|
| Automotive Parts | 3 | $48B |
|
||
| Automotive | 2 | $372B |
|
||
| Chemicals | 1 | $45B |
|
||
| Automotive Retail | 1 | $29B |
|
||
| Healthcare / Medical Devices | 1 | $23B |
|
||
| Automotive Technology | 1 | $20B |
|
||
Price history
-97.7% since first listed9 events — show timeline
- 2026-02-20 Rental Removed $1,500 TURBOTENANT
- 2026-02-06 Listed for Rent $1,500 TURBOTENANT
- 2025-11-10 Sold (Public Records) $58,500 Public Records
- 2025-09-26 Pending — MiRealSource-MiMLS
- 2025-09-26 Pending — REALCOMP
- 2025-09-26 Pending — SW Michigan MLS
- 2025-08-19 Listed $64,900 SW Michigan MLS
- 2025-08-19 Listed $64,900 REALCOMP
- 2025-08-19 Listed $64,900 MiRealSource-MiMLS
Property tax history
-15.4%/yrLatest (2025): $293 · +2.2% YoY. Source: county tax records.
Cash-flow waterfall
monthlySold comps — $/sqft
last 12 mo · ≤1 miLoading sold comps…