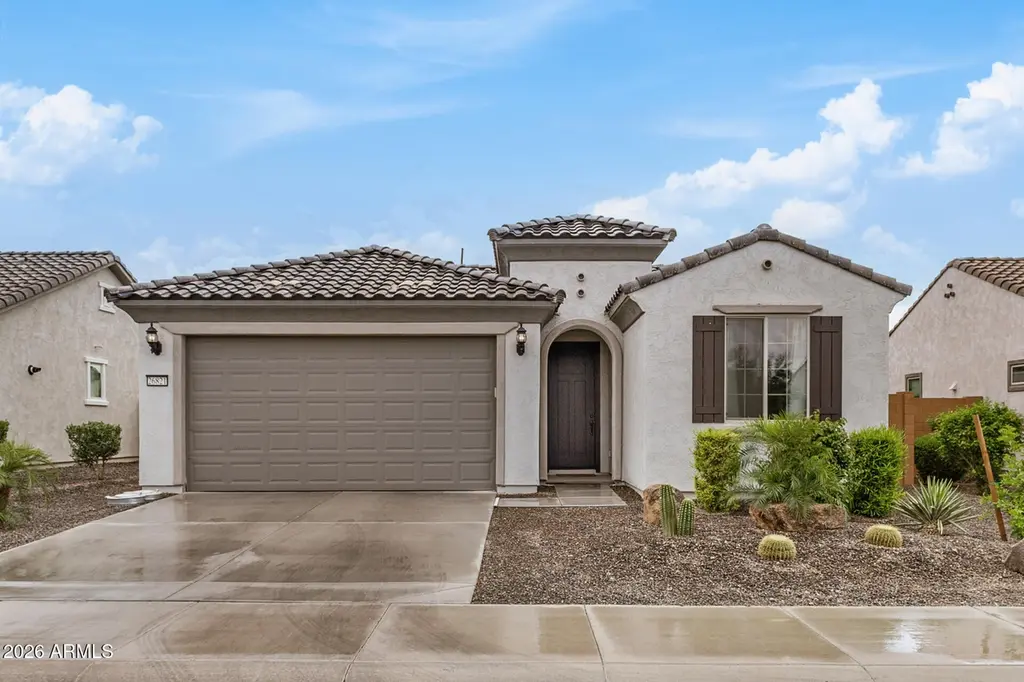
26821 W Melinda Ln · Buckeye, AZ
Flood risk 1/10 · Minimal
- FEMA flood zone
- X (shaded)
- Chance of flooding over 30 yrs
- 0.0%
- Est. flood insurance / yr
- $507 – $1,088
Fire risk 5/10 · Moderate
- Est. fire insurance / yr
- $610 – $1,132
Heat risk 9/10 · Severe
- Hot days now (above 111°F)
- 7 days/yr
- Hot days in 30 yrs
- 17 days/yr
Wind risk 1/10 · Minimal
- Chance of severe wind over 30 yrs
- —
Air-quality risk 2/10 · Minimal
- Unhealthy air days now
- 0 days/yr
- Unhealthy air days in 30 yrs
- 1 days/yr
Risk factors via First Street. Map © Google.
Why this score? — see what drove the D- grade
The composite is a weighted blend of 9 inputs, each scored 0–100. Each bar is that input's sub-score; the figure is the points it added to the 100-point composite (weight × sub-score).
- ARV discount +12.6/15.0
- Cash flow +8.8/30.0
- Rent growth +3.4/5.0
- Livability +3.4/5.0
- Schools +2.9/10.0
- Condition / age +2.5/5.0
- 1% rule +2.4/10.0
- DSCR +2.4/10.0
- Appreciation +0.0/10.0
$374,900
🖨 Deal sheet (PDF) 📄 Offer letter ✓ Due diligence
Listing remarks
Absolutely STUNNING 2 bed 2 bath Odyssey model in Sun City Festival! This home was newly built in 2022, featuring an open concept, modern layout with SO MANY upgrades. Plank tile throughout the living areas creates a seamless flow. The kitchen steals the show with the quartz countertops, soft close cabinets, gas range and wall mounted oven, and an island perfect for entertaining. The spacious primary bedroom features a walk in shower, dual vanity sink and a large walk in closet. In the private backyard you'll find a covered patio and low maintenance landscaping. All of this tucked into the desirable 55+ community of Sun City Festival, with it's world class mountain views, amenities, and gol
Key facts
- Quartz countertops
- Covered patio
- Soft close cabinets
Tags
Property features AI
Finance
- Other: Directions: Use GPS
- HOA & community: Homeowners association with quarterly fee; Association fee includes grounds maintenance; Community amenities: pool, spa (heated), golf, tennis courts, pickleball courts, playground, biking/walking paths, fitness center
Exterior
- Parking: Covered parking for 2 vehicles; 2-car garage
- Utilities: Public sewer; City water
- Home design: Single family residence; Fee simple ownership
- Construction: Stucco and painted wood frame construction
- Exterior features: Desert front yard; Desert back yard; Block fencing; Tile and concrete roof
Interior
- Kitchen: Refrigerator; Dishwasher; Disposal; Built-in gas oven; Built-in microwave; Non-laminate counters
- Bedrooms: 2 possible bedrooms
- Flooring: Carpet; Tile
- Bathrooms: 2 full bathrooms
- Heating & cooling: Natural gas heating; Central air conditioning; Ceiling fans
- Interior features: Double vanity; 9+ foot flat ceilings; Kitchen island; Pantry; Walk-in pantry; Dual-pane windows
Neighborhood map
What this means for you Summary
Snapshot
- This is a 2-bed/3.0-bath single-family listed at $375k.
Deal economics
- At list price, monthly cash flow is $-308 ($-4k/yr) — negative.
- To cash-flow at today's rent, offer at most $321k (14.5% below list).
- To meet the 1% rule (rent ≥ 1% of price), the offer needs to be $278k (25.7% below list).
- Recommended offer: $278k (25.7% below list) — sets the bar for 1% rule.
- Cap rate 5.3% vs local median 3.1% in Buckeye — top-decile yield for the area; either an underpriced asset or a hidden risk that comps aren't pricing in. Stress-test before assuming the spread holds.
Location & tenants
- Location reads 68/100 on livability (#53 in AZ) — a middle-class / working-renter tenant base. Strengths: employment A+, housing A+, crime A; Watch: amenities F, commute F, health & safety F.
- Wickenburg Unified District (4236) (rural): math 33% / reading 35% proficiency, ranked #92 of 249 in AZ (top 37%) — families likely to look elsewhere, expect single-tenant / working-renter base with shorter leases.
- Zoned schools: Festival Foothills Elementary School (math 47% / reading 47%, grade D-, #308 of 1,109 statewide, top 29%, 314 students, 31% FRL); Vulture Peak Middle School (math 27% / reading 32%, grade F, #84 of 218 statewide, top 41%, 162 students, 51% FRL); Wickenburg High School (math 27% / reading 32%, grade F, #120 of 381 statewide, top 34%, 460 students, 40% FRL).
- Market conditions: Rents rising (+3.4%/yr); 951 active listings in the ZIP; 29 comparable units currently listed for rent nearby; rentals leasing fast (median 3d on market — plan ~1-2 weeks tenant-placement turnaround); high-income renter base; 36,011 units permitted in Maricopa County in 2024 (12,801 in 5+ unit buildings).
Forward outlook
- Local home prices are declining (-3.0%/yr); year-one equity from $3k of loan paydown is wiped out by about $11k of value loss. Plan a longer hold.
- Maricopa County population projected at +38% by 2050 — long-run rental-demand tailwind backs the buy-and-hold thesis.
Negotiation context
- Only 6 days on market — expect competitive offers; lowballing is unlikely to land.
Risks & watch-outs
- Climate carrying-cost: moderate wildfire risk; extreme-heat days projected 7→17/yr by 2055 (HVAC capex compounding) — expect insurance premiums to compound above CPI over the hold.
Questions for the listing agent
- What do current leases actually rent for vs. the listed asking? Can we see a recent rent roll and the last 12 months of T-12 income?
- What does the HOA fee cover, when was the last increase, and are there any pending special assessments or reserve-fund shortfalls?
- Is there a deadline driving the sale (1031 exchange, divorce, estate, relocation)? That informs how much negotiation room exists.
- Schools are D-rated, which usually means shorter tenancies and higher turnover. Who's the typical renter profile here, and what's been the actual vacancy rate?
- The area grade is low — what's the realistic commute time and amenity access for the typical tenant pool here? Any planned neighborhood developments (good or bad) we should know about?
- What's the average days-on-market for RENTAL listings here right now (not sales)? A rising rental-DOM trend means longer vacancies and softer asking-rent achievability than the comps imply.
- What's the recent tenant-quality profile in this submarket — average credit score on applications, eviction rate, late-payment / NSF rate, and stable-employment percentage? A property-management company in the area should have these aggregated.
- How much new for-sale + rental construction is in the pipeline within 1–3 miles? Heavy new supply typically softens prices + rents 12–24 months out; constrained supply supports both.
Investment metrics
- 1% rule
- 0.74% ✗
- Cap rate
- 5.31%
- Cash-on-cash
- -3.52%
- DSCR
- 0.84
- GRM
- 11.2
CMA / ARV
- ARV (median comp)
- $422,978
- List price
- $374,900
- Delta
- -11.37%
- Verdict
- UNDERPRICED
- Comps
- 20 within 1.0 mi
Show comp detail 12 sales within ~0.75 mi
| Address | Dist | Beds/Ba | Sqft | Sold | Price | $/sf | Match |
|---|---|---|---|---|---|---|---|
| 26821 W Melinda Ln | 0.00mi | 2/2.0 | 1,525 (0%) | 1mo | $372,000 | $244 | 95 |
| 21392 N 268th Dr | 0.06mi | 2/2.0 | 1,576 (+3%) | 1mo | $380,000 | $241 | 86 |
| 21107 N 267th Dr | 0.25mi | 2/2.0 | 1,525 (0%) | 3mo | $364,000 | $239 | 82 |
| 21290 N 270th Ave | 0.27mi | 2/2.0 | 1,524 (-0%) | 3mo | $325,000 | $213 | 81 |
| 26794 W Firehawk Dr | 0.09mi | 2/2.0 | 1,604 (+5%) | 3mo | $419,990 | $262 | 81 |
| 27072 W Adam Ave | 0.32mi | 2/2.0 | 1,526 (+0%) | 3mo | $393,990 | $258 | 79 |
| 26801 W Melinda Ln | 0.03mi | 2/2.5 | 1,709 (+12%) | 0mo | $345,000 | $202 | 76 |
| 21343 N 272nd Ln | 0.56mi | 2/2.0 | 1,574 (+3%) | 3mo | $412,990 | $262 | 62 |
| 20289 N 268th Ave | 0.71mi | 2/2.0 | 1,612 (+6%) | 2mo | $353,000 | $219 | 52 |
| 27134 W Ross Ave | 0.54mi | 2/2.0 | 1,700 (+12%) | 1mo | $387,500 | $228 | 51 |
| 20463 N 267th Ln | 0.61mi | 2/2.0 | 1,375 (-10%) | 1mo | $275,000 | $200 | 50 |
| 26638 W Irma Ln | 0.52mi | 3/2.0 (+1) | 1,375 (-10%) | 2mo | $375,000 | $273 | 49 |
Match score weights: distance 35% · size 25% · config 20% · recency 20%. Top-matched comps best support the ARV.
Projected returns pro-forma
-3.0% appreciation · 3.41% rent growth · sell at horizon
- IRR
- -21.8%
- Equity multiple
- 0.25×
- Total profit
- $-79,199
- Equity at exit
- $55,899
- IRR
- -14.7%
- Equity multiple
- 0.15×
- Total profit
- $-89,461
- Equity at exit
- $32,415
Cash invested: $104,972 (down + closing). Projections, not guarantees.
Landlord ↔ Tenant lean methodology
- Overall (STATE)
- 87 Strongly Landlord-Friendly
- State Arizona
- 87 Strongly Landlord-Friendly · R+3
- County
- — inherits STATE
- City
- — inherits STATE
ZIP-level market 85396
- Home prices YoY
- -18.8%
- Rents YoY
- 3.4%
- Active inventory
- 951
- Price-to-rent
- 11.2×
Monthly cashflow live
- Estimated rent
- $2,784 high interval (Pro) →
- Mortgage (P&I)
- −$1,966
- Tax from tax record
- −$205 /mo · $2,460/yr
- Insurance
- −$156
- HOA
- −$180
- Vacancy / Maint / Mgmt
- −$585
- Net cashflow
- $-308
Break-even live
Sensitivity live
| Price | -10% $-95 | -5% $-202 | +0% $-308 | +5% $-414 | +10% $-520 |
|---|---|---|---|---|---|
| Rent | -10% $-528 | -5% $-418 | +0% $-308 | +5% $-198 | +10% $-88 |
| Rate | -1.0pp $-119 | -0.5pp $-212 | base $-308 | +0.5pp $-405 | +1.0pp $-504 |
UW: 25.0% down · 7.5% · 30yr · 1.5% tax · 5.0% vac · 8.0% maint · 8.0% mgmt
Financing live
Cash to close
- Down payment
- $93,725
- Closing costs
- $11,247
- Reserves months
- —
- Total cash needed
- —
Loan-product check · same deal, 3 products live
Conventional
25% down · 7.5% · 30yr
- Down + closing
- —
- Monthly P&I
- —
- Monthly cashflow
- —
- DSCR
- —
- Eligible?
- —
Personal DTI + credit; lowest rate.
DSCR
20% down · 8.5% · 30yr
- Down + closing
- —
- Monthly P&I
- —
- Monthly cashflow
- —
- DSCR
- —
- Eligible?
- —
No personal income docs; deal must DSCR.
Hard money
10% down · 12.0% · 12mo
- Down + closing
- —
- Monthly P&I
- —
- Monthly cashflow
- —
- DSCR
- —
- Eligible?
- —
Short-term bridge; refi at stabilization.
Rent comps 29 comps
| Address | Beds | Baths | Sqft | Rent | $/sqft | DOM | Units | Dist |
|---|---|---|---|---|---|---|---|---|
| 26653 W Firehawk Dr Unit 1302342P Buckeye, AZ | 2.0 | 2.0 | 1883 | $2,459 | $1.31 | 3d | 1 | 0.27mi |
| 26824 W Potter Dr Buckeye, AZ | 2.0 | 2.0 | 2092 | $3,500 | $1.67 | 45d | 1 | 0.43mi |
| 27013 W Potter Dr Buckeye, AZ | 2.0 | 2.0 | 1612 | $4,200 | $2.61 | 45d | 1 | 0.49mi |
| 26990 W Burnett Rd Buckeye, AZ | 2.0 | 2.0 | 1961 | $4,000 | $2.04 | 0d | 1 | 0.54mi |
| 26766 W Mohawk Ln Buckeye, AZ | 2.0 | 2.0 | 1375 | $2,500 | $1.82 | 0d | 1 | 0.55mi |
| 20540 N 268th Dr Buckeye, AZ | 3.0 | 2.0 | 1961 | $2,000 | $1.02 | 0d | 1 | 0.56mi |
| 20669 N 266th Ave Buckeye, AZ | 3.0 | 2.0 | 1612 | $4,200 | $2.61 | 26d | 1 | 0.58mi |
| 26477 W Ross Ave Buckeye, AZ | 3.0 | 2.0 | 1375 | $1,500 | $1.09 | 45d | 1 | 0.62mi |
| 27244 W Potter Dr Buckeye, AZ | 2.0 | 2.0 | 1612 | $3,500 | $2.17 | 45d | 1 | 0.66mi |
| 26237 W Matthew Dr Buckeye, AZ | 2.0 | 2.0 | 1646 | $3,500 | $2.13 | 0d | 1 | 0.75mi |
| 26731 W Pontiac Dr Buckeye, AZ | 2.0 | 2.0 | 1373 | $1,475 | $1.07 | 4d | 1 | 0.76mi |
| 20493 N 264th Ave Buckeye, AZ | 2.0 | 2.0 | 1961 | $4,200 | $2.14 | 0d | 1 | 0.78mi |
| 20311 N 271st Ave Buckeye, AZ | 2.0 | 2.0 | 1612 | $3,000 | $1.86 | 3d | 1 | 0.78mi |
| 26197 W Vista North Dr Buckeye, AZ | 2.0 | 2.0 | 1375 | $2,850 | $2.07 | 12d | 1 | 0.84mi |
| 26197 W Vista North Dr Buckeye, AZ | 2.0 | 2.0 | 1375 | $2,900 | $2.11 | 0d | 1 | 0.84mi |
| 26208 W Tina Ln Buckeye, AZ | 2.0 | 2.0 | 1612 | $1,999 | $1.24 | 14d | 1 | 0.85mi |
| 26195 W Via del Sol Dr Buckeye, AZ | 2.0 | 2.0 | 1493 | $3,300 | $2.21 | 0d | 1 | 0.86mi |
| 26170 W Vista North Dr Buckeye, AZ | 2.0 | 2.0 | 1115 | $3,300 | $2.96 | 3d | 1 | 0.86mi |
| 20602 N 274th Ave Buckeye, AZ | 2.0 | 2.0 | 1561 | $3,500 | $2.24 | 0d | 1 | 0.89mi |
| 21605 N 261st Ave Buckeye, AZ | 2.0 | 2.0 | 1115 | $2,000 | $1.79 | 0d | 1 | 0.90mi |
| 20002 N 269th Dr Buckeye, AZ | 2.0 | 2.0 | 1961 | $3,500 | $1.78 | 0d | 1 | 0.90mi |
| 26028 W Matthew Dr Unit NA Buckeye, AZ | 3.0 | 2.0 | 2000 | $2,750 | $1.38 | 0d | 1 | 0.97mi |
| 26043 W Potter Dr Buckeye, AZ | 3.0 | 2.5 | 2025 | $1,900 | $0.94 | 0d | 1 | 1.10mi |
| 26043 W Potter Dr Buckeye, AZ | 3.0 | 2.5 | 2025 | $1,900 | $0.94 | 4d | 1 | 1.10mi |
| 26781 W Oraibi Dr Buckeye, AZ | 2.0 | 2.0 | 1561 | $2,000 | $1.28 | 20d | 1 | 1.17mi |
| 27389 W Wahalla Ln Buckeye, AZ | 2.0 | 2.5 | 1717 | $3,500 | $2.04 | 0d | 1 | 1.23mi |
| 26881 W Utopia Rd Buckeye, AZ | 2.0 | 2.0 | 1705 | $3,500 | $2.05 | 0d | 1 | 1.25mi |
| 26182 W Tonto Ln Buckeye, AZ | 3.0 | 2.0 | 1625 | $1,695 | $1.04 | 4d | 1 | 1.31mi |
| 26087 W Tonto Ln Buckeye, AZ | 2.0 | 2.0 | 1625 | $2,300 | $1.42 | 45d | 1 | 1.44mi |
HOA detail
- Monthly dues
- $180 · $2,160/yr
- Likely covers
- gaslandscaping
Listing history 2 events
-
2026-05-07status Pending 708-char remark
-
2026-05-01$374,900 Active 708-char remark
ⓘ Source: listings_history table (triggers on properties + properties_extension) + one-shot
backfill from property_details.listing_events for pre-trigger history.
Tax reassessment forecast AZ · Resets to sale price
- Current annual tax
- $2,460 · $205/mo
- Projected year-2 tax
- $2,474 · $206/mo
- Expected delta
- +$14/yr (+$1/mo · 0.6%)
ⓘ Screening estimate from a state-policy table — verify with the county assessor before closing.
Climate risk First Street
- Flood 1/10 Low FEMA zone X (shaded) · 0% chance over 30 yrs
- Wildfire 5/10 Major
- Heat 9/10 Extreme 7 d/yr ≥111°F today · 17 d/yr by 30 yrs out
- Wind 1/10 Low
- Air quality 2/10 Low 0 unhealthy d/yr today · 1 by 30 yrs out
Nearby sold comps map
Loading sold comps map…
Walkable amenities ~0.75 mi
Loading nearby amenities…
Taxation est. · year 1
- Rental income
- $33,412
- − Mortgage interest
- −$21,000
- − Property taxes
- −$2,460
- − Insurance
- −$1,874
- − Repairs & maintenance
- −$2,673
- − Management
- −$2,673
- − HOA
- −$2,160
- − Depreciation
- −$10,906
- Taxable loss
- −$10,335
- Est. tax savings @ 24.0%
- +$2,480
- After-tax cash flow
- $-1,211/yr
For passive investors: Depreciation is non-cash, so a rental often shows a tax loss while cash-flowing — sheltering income. Rental losses are passive: they offset passive income freely, and up to $25,000/yr can offset ordinary (W-2) income if you actively participate and your MAGI is under $100k (phasing out to $0 by $150k); unused losses carry forward. On sale, claimed depreciation is recaptured at up to 25%, and gains may owe capital-gains tax (a 1031 exchange can defer both). Figures are a year-1 estimate at your 24.0% rate — not tax advice; consult a CPA.
Schools (NCES district)
- District
- Wickenburg Unified District (4236)
- NCES district ID
- 0409190
- Math proficiency
- 33% ▼ -10.00%
- Reading proficiency
- 35% ▼ -7.00%
- Median HH income
- $47,369
- Composite
- 29.27/100
- National rank
- #6560
- State rank
- #92 of 249 in AZ
Livability — Buckeye
- Score
- 68/100
- State rank
- #53
- US rank
- #9428
Category grades
Schools grade is shown separately in the Schools card above.
Census & demographics
- Census place
- Buckeye, AZ
- County
- Maricopa County · 4,537,380 people
- City population
- 117,540
- Metro
- Phoenix-Mesa-Chandler, AZ
- Population (ZIP)
- 42,181
- Household income
- $114,056
- Rent vs Own
- Severe rent burden
- 156.0
Population outlook (Maricopa County) Hauer SSP2
- Today (2025)
- 4,979,203 people
- By 2030
- 5,378,229 · +8.0%
- By 2040
- 6,156,598 · +23.6%
- By 2050
- 6,872,376 · +38.0%
- By 2075
- 8,401,270 · +68.7%
- By 2100
- 9,247,439 · +85.7%
Race, ethnicity, and origin ACS 2023
- Neighborhood character
- Diverse neighborhood (Simpson 0.56)
- Race & ethnicity
- White 59% Hispanic / Latino 31% Two or more races 18% Black 4% Asian 2% Native American 1%
- Hispanic origin (detail)
- Mexican 25%
- Common ancestry
- Slovak 4% Portuguese 2% Italian 2%
- Foreign-born
- 8% · Canada, Vietnam
- Languages at home
- 85% English-only · Spanish 12% German/W. Germanic 1% Other Indo-European 1%
Political lean MEDSL · Maricopa
- 2024 margin
- Toss-up / Even · D 47.7% · R 51.2% · Other 1.1%
- 2008→2024 swing
- +7.1pp toward D · 2008: -10.6pp · 2024: -3.5pp
- All cycles
- 2024: R+3.5 2020: D+2.2 2016: R+3.5 2012: R+12.0 2008: R+10.6
Not yet ingested
- Civics
- —
Market trends
- HPI YoY
- ▼ -56.97%
- Current HPI
- 246.4705
- Rent YoY
- ▲ 3.41%
- Metro
- Phoenix-Mesa-Chandler, AZ
- State GDP YoY
- ▲ 4.54%
- F500 in state
- 20
Industry mix (Fortune 500 HQ in AZ)
| Industry | F500 HQs | Revenue |
|---|---|---|
| Technology | 2 | $13B |
|
||
| Mining / Metals | 1 | $23B |
|
||
| Environmental Services | 1 | $16B |
|
||
| Metals / Steel | 1 | $14B |
|
||
| Technology Distribution | 1 | $9B |
|
||
| Homebuilding | 1 | $8B |
|
||
Price history
-0.8% since first listed4 events — show timeline
- 2026-05-26 Sold (Public Records) $372,000 Public Records
- 2026-05-26 Sold (MLS) $372,000 ARMLS
- 2026-05-07 Pending — ARMLS
- 2026-05-01 Listed $374,900 ARMLS
Property tax history
+34.8%/yrLatest (2025): $2,460 · +17.6% YoY. Source: county tax records.
Cash-flow waterfall
monthlySold comps — $/sqft
last 12 mo · ≤1 miLoading sold comps…